Computer Science Degree Jobs in London

Computer Science Degree
England > London

The table below provides summary statistics for permanent job vacancies advertised in London with a requirement for Computer Science Degree qualifications. It includes a benchmarking guide to the salaries offered over the 6 months leading up to 24 June 2025, comparing them to the same period in the previous two years.

6 months to
24 Jun 2025
Same period 2024 Same period 2023
Rank 65 98 127
Rank change year-on-year +33 +29 -5
Permanent jobs citing Computer Science Degree 602 771 843
As % of all permanent jobs advertised in London 4.69% 3.11% 2.75%
As % of the Qualifications category 14.33% 11.41% 10.24%
Number of salaries quoted 225 545 596
10th Percentile £46,750 £40,500 £42,500
25th Percentile £60,000 £53,751 £56,250
Median annual salary (50th Percentile) £75,000 £73,750 £77,500
Median % change year-on-year +1.69% -4.84% +19.23%
75th Percentile £92,500 £90,000 £100,000
90th Percentile £120,000 £110,000 £122,500
England median annual salary £63,000 £60,000 £60,899
% change year-on-year +5.00% -1.48% +5.91%

All Academic and Professional Certifications
London

Computer Science Degree falls under the Academic Qualifications and Professional Certifications category. For comparison with the information above, the following table provides summary statistics for all permanent job vacancies requiring academic qualifications or professional certifications in London.

Permanent vacancies requiring academic qualifications or professional certifications 4,201 6,756 8,229
As % of all permanent jobs advertised in London 32.73% 27.28% 26.84%
Number of salaries quoted 1,844 4,069 5,221
10th Percentile £41,250 £36,150 £39,294
25th Percentile £51,625 £47,500 £51,250
Median annual salary (50th Percentile) £67,820 £67,000 £67,500
Median % change year-on-year +1.22% -0.74% +3.85%
75th Percentile £90,000 £85,000 £88,750
90th Percentile £110,000 £101,250 £112,500
England median annual salary £55,000 £53,500 £60,000
% change year-on-year +2.80% -10.83% +9.09%

Computer Science Degree
Job Vacancy Trend in London

Job postings citing Computer Science Degree as a proportion of all IT jobs advertised in London.
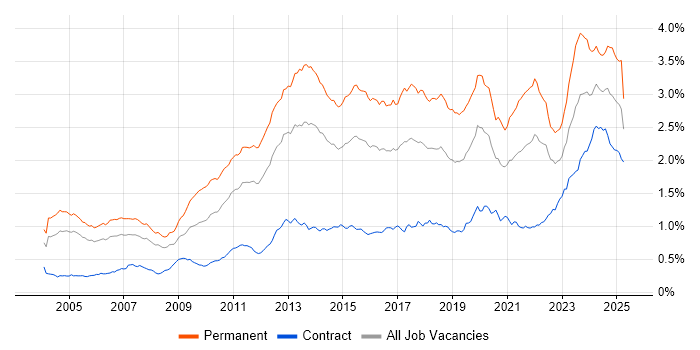
Job vacancy trend for Computer Science Degree in London

Computer Science Degree
Salary Trend in London

3-month moving average salary quoted in jobs citing Computer Science Degree in London.

Salary trend for Computer Science Degree in London

Computer Science Degree
Salary Histogram in London

Salary distribution for jobs citing Computer Science Degree in London over the 6 months to 24 June 2025.

Salary histogram for Computer Science Degree in London

Computer Science Degree
Job Locations in London

The table below looks at the demand and provides a guide to the median salaries quoted in IT jobs citing Computer Science Degree within the London region over the 6 months to 24 June 2025. The 'Rank Change' column provides an indication of the change in demand within each location based on the same 6 month period last year.

Location Rank Change
on Same Period
Last Year
Matching
Permanent
IT Job Ads
Median Salary
Past 6 Months
Median Salary
% Change
on Same Period
Last Year
Live
Jobs
Central London +16 135 £70,000 -5.08% 275
West London +71 76 £61,250 -4.30% 62
South London +52 71 £80,000 +60.00% 3
North London +4 21 £68,500 -2.14%
East London -13 13 - - 84
Computer Science Degree
England

Computer Science Degree
Co-occurring Skills and Capabilities in London by Category

The follow tables expand on the table above by listing co-occurrences grouped by category. The same employment type, locality and period is covered with up to 20 co-occurrences shown in each of the following categories:

Application Platforms
1 12 (1.99%) Apache
1 12 (1.99%) Apache Airflow
2 11 (1.83%) SharePoint
3 5 (0.83%) Luigi
4 3 (0.50%) IIS
4 3 (0.50%) Microsoft Exchange
5 2 (0.33%) CMS
6 1 (0.17%) Apache Spark
6 1 (0.17%) Confluence
6 1 (0.17%) nginx
Applications
1 6 (1.00%) Chatbot
2 4 (0.66%) Adobe XD
2 4 (0.66%) Microsoft Excel
2 4 (0.66%) Microsoft Office
2 4 (0.66%) Sketch
3 1 (0.17%) Microsoft PowerPoint
3 1 (0.17%) Microsoft Project
Business Applications
1 4 (0.66%) Remedy ITSM
2 3 (0.50%) SAP Business One
3 2 (0.33%) Dynamics CRM
3 2 (0.33%) Dynamics NAV
3 2 (0.33%) Shopify
4 1 (0.17%) Adaptiv
4 1 (0.17%) Dynamics GP
4 1 (0.17%) Endur
4 1 (0.17%) Magento
4 1 (0.17%) Oracle Applications
4 1 (0.17%) Oracle EBS
4 1 (0.17%) SAP GRC
4 1 (0.17%) SAP S/4HANA
Cloud Services
1 138 (22.92%) Azure
2 102 (16.94%) AWS
3 50 (8.31%) GCP
4 44 (7.31%) SaaS
5 35 (5.81%) Power Platform
6 29 (4.82%) Serverless
7 23 (3.82%) Azure DevOps
7 23 (3.82%) GitHub
8 20 (3.32%) AWS Lambda
8 20 (3.32%) Azure Data Factory
9 19 (3.16%) Microsoft 365
10 16 (2.66%) Microsoft Copilot
11 15 (2.49%) AWS CloudFormation
11 15 (2.49%) GitHub Actions
12 14 (2.33%) Cloud Computing
13 13 (2.16%) Amazon S3
13 13 (2.16%) Dynamics 365
13 13 (2.16%) Entra ID
14 11 (1.83%) Azure AI
14 11 (1.83%) Azure Monitor
Communications & Networking
1 208 (34.55%) Broadband
2 31 (5.15%) Firewall
3 24 (3.99%) Network Security
4 11 (1.83%) VPN
5 10 (1.66%) SAN
6 8 (1.33%) WAN
7 6 (1.00%) HTTP
8 5 (0.83%) DNS
8 5 (0.83%) Wireless
9 3 (0.50%) SD-WAN
9 3 (0.50%) Telnet
9 3 (0.50%) VoIP
10 2 (0.33%) DHCP
10 2 (0.33%) Fibre Channel
10 2 (0.33%) LAN
11 1 (0.17%) Internet
11 1 (0.17%) Kerberos
11 1 (0.17%) MPLS
11 1 (0.17%) OSPF
11 1 (0.17%) TCP/IP
Database & Business Intelligence
1 24 (3.99%) Power BI
2 22 (3.65%) Data Warehouse
3 20 (3.32%) SQL Server
4 17 (2.82%) NoSQL
5 12 (1.99%) Data Lake
5 12 (1.99%) Relational Database
6 11 (1.83%) Azure SQL Database
6 11 (1.83%) PostgreSQL
7 9 (1.50%) MySQL
8 8 (1.33%) Amazon Athena
8 8 (1.33%) Azure SQL Data Warehouse
8 8 (1.33%) Power Query
9 7 (1.16%) Big Data
10 6 (1.00%) Amazon RDS
10 6 (1.00%) BigQuery
10 6 (1.00%) MongoDB
10 6 (1.00%) SQL Server Integration Services
11 5 (0.83%) Amazon Aurora
11 5 (0.83%) Amazon Redshift
11 5 (0.83%) DynamoDB
Development Applications
1 45 (7.48%) Git
2 13 (2.16%) Jenkins
2 13 (2.16%) JIRA
3 10 (1.66%) Gradle
4 6 (1.00%) Moq
4 6 (1.00%) SpecFlow
5 5 (0.83%) Maven
5 5 (0.83%) SonarQube
6 4 (0.66%) Spinnaker
7 3 (0.50%) Cypress.io
7 3 (0.50%) Selenium
8 2 (0.33%) Artifactory
8 2 (0.33%) GitLab
8 2 (0.33%) JMeter
8 2 (0.33%) Subversion
8 2 (0.33%) TestRail
8 2 (0.33%) Vite
8 2 (0.33%) WebDriver
8 2 (0.33%) webpack
9 1 (0.17%) Bugzilla
General
1 384 (63.79%) Social Skills
2 107 (17.77%) Finance
3 103 (17.11%) Law
4 57 (9.47%) Analytical Skills
5 42 (6.98%) Games
6 32 (5.32%) Inclusion and Diversity
7 27 (4.49%) Marketing
7 27 (4.49%) Multimedia
8 23 (3.82%) Retail
9 21 (3.49%) Legal
10 16 (2.66%) Banking
10 16 (2.66%) Front Office
11 9 (1.50%) Presentation Skills
11 9 (1.50%) Public Sector
12 7 (1.16%) Pharmaceutical
13 6 (1.00%) Telecoms
14 5 (0.83%) Back Office
15 4 (0.66%) Agriculture
15 4 (0.66%) Investment Banking
16 2 (0.33%) Organisational Skills
Job Titles
1 142 (23.59%) Lead
2 110 (18.27%) Senior
3 80 (13.29%) Architect
4 67 (11.13%) Developer
5 59 (9.80%) Solutions Architect
6 56 (9.30%) Engineering Manager
7 51 (8.47%) Systems Engineer
8 46 (7.64%) Software Engineer
9 38 (6.31%) Senior Architect
9 38 (6.31%) Senior Solutions Architect
10 36 (5.98%) Senior Manager
10 36 (5.98%) ServiceNow Architect
11 32 (5.32%) Data Engineer
12 27 (4.49%) Analyst
13 26 (4.32%) Team Leader
14 25 (4.15%) Senior Service Manager
14 25 (4.15%) ServiceNow Manager
15 17 (2.82%) Lead Developer
16 16 (2.66%) Lead Data Engineer
17 15 (2.49%) Platform Engineer
Libraries, Frameworks & Software Standards
1 36 (5.98%) HTML
2 34 (5.65%) CSS
3 30 (4.98%) React
4 23 (3.82%) .NET
5 20 (3.32%) Kafka
6 19 (3.16%) REST
7 18 (2.99%) AngularJS
8 14 (2.33%) ARM Templates
8 14 (2.33%) Elastic Stack
8 14 (2.33%) OAuth
8 14 (2.33%) RESTful
9 12 (1.99%) OAuth2
9 12 (1.99%) Vue
10 11 (1.83%) HTML5
11 10 (1.66%) Material-UI
12 9 (1.50%) FIX Protocol
12 9 (1.50%) Pandas
13 8 (1.33%) GraphQL
14 7 (1.16%) Jest
14 7 (1.16%) Playwright
Miscellaneous
1 62 (10.30%) Management Information System
2 34 (5.65%) Product Ownership
3 25 (4.15%) Video\Live Streaming
4 22 (3.65%) Algorithms
5 19 (3.16%) Cloud Native
6 17 (2.82%) Hedge funds
7 15 (2.49%) Legacy Systems
8 12 (1.99%) Mobile App
9 11 (1.83%) Enterprise Software
9 11 (1.83%) Mobile Games
10 10 (1.66%) Security Posture
11 8 (1.33%) Distributed Systems
11 8 (1.33%) Equities
11 8 (1.33%) Fixed Income
12 7 (1.16%) Data Centre
12 7 (1.16%) Distributed Architecture
12 7 (1.16%) Linux Command Line
13 6 (1.00%) Analytical Mindset
13 6 (1.00%) Cyber Threat
13 6 (1.00%) Onboarding
Operating Systems
1 36 (5.98%) Windows
2 32 (5.32%) Linux
3 11 (1.83%) Windows Server
4 9 (1.50%) Unix
5 8 (1.33%) Apple iOS
6 6 (1.00%) Android
6 6 (1.00%) Red Hat Enterprise Linux
7 5 (0.83%) VMS
8 4 (0.66%) Windows 10
9 3 (0.50%) Rocky
9 3 (0.50%) Ubuntu
9 3 (0.50%) Windows Server 2016
9 3 (0.50%) Windows Server 2019
10 2 (0.33%) CentOS
10 2 (0.33%) Mac OS
10 2 (0.33%) Oracle Linux
11 1 (0.17%) Debian
11 1 (0.17%) Windows Server 2012
Processes & Methodologies
1 586 (97.34%) Computer Science
2 328 (54.49%) Problem-Solving
3 302 (50.17%) Roadmaps
4 241 (40.03%) Mentoring
5 210 (34.88%) Product Management
6 202 (33.55%) High Availability
7 183 (30.40%) Broadcast Engineering
8 125 (20.76%) Software Engineering
9 105 (17.44%) Agile
9 105 (17.44%) Artificial Intelligence
10 101 (16.78%) DevOps
11 93 (15.45%) CI/CD
12 68 (11.30%) ITSM
13 63 (10.47%) Service Delivery
14 61 (10.13%) Continuous Improvement
14 61 (10.13%) Data Science
15 60 (9.97%) User Experience
16 56 (9.30%) Machine Learning
17 53 (8.80%) Infrastructure as Code
18 51 (8.47%) Containerisation
Programming Languages
1 114 (18.94%) Python
2 76 (12.62%) SQL
3 70 (11.63%) Java
4 47 (7.81%) JavaScript
5 32 (5.32%) C#
6 31 (5.15%) PowerShell
7 21 (3.49%) TypeScript
8 17 (2.82%) C++
9 16 (2.66%) Scala
10 13 (2.16%) C
11 9 (1.50%) Bash
12 8 (1.33%) Data Analysis Expressions
13 7 (1.16%) Objective-C
13 7 (1.16%) Swift
14 5 (0.83%) Apex Code
14 5 (0.83%) Kotlin
14 5 (0.83%) SPARQL
15 4 (0.66%) PHP
16 3 (0.50%) Go
16 3 (0.50%) R
Qualifications
1 602 (100.00%) Degree
2 63 (10.47%) Master's Degree
3 43 (7.14%) Azure Certification
4 28 (4.65%) Security Cleared
5 26 (4.32%) SC Cleared
6 23 (3.82%) CISSP
7 20 (3.32%) AWS Certification
8 17 (2.82%) AWS Certified Solutions Architect
9 16 (2.66%) PMI Certification
10 15 (2.49%) Microsoft Certification
10 15 (2.49%) PMP
11 12 (1.99%) OSCP
12 10 (1.66%) GCIA
12 10 (1.66%) GCIH
13 7 (1.16%) CEH
13 7 (1.16%) CompTIA Security+
14 6 (1.00%) ITIL Certification
14 6 (1.00%) SANS
15 5 (0.83%) Cisco Certification
15 5 (0.83%) CISM
Quality Assurance & Compliance
1 40 (6.64%) QA
2 36 (5.98%) GDPR
3 20 (3.32%) HIPAA
4 19 (3.16%) Data Quality
5 17 (2.82%) ISO/IEC 27001
6 16 (2.66%) NIST
7 11 (1.83%) California Consumer Privacy Act
8 5 (0.83%) Accessibility
9 4 (0.66%) CDISC
9 4 (0.66%) NCSC
10 3 (0.50%) GRC
11 2 (0.33%) GxP
11 2 (0.33%) NIST 800
11 2 (0.33%) PCI DSS
12 1 (0.17%) Actionable Recommendations
12 1 (0.17%) ITGC
12 1 (0.17%) SOC 1
12 1 (0.17%) SOC 2
12 1 (0.17%) Software Quality Assurance
12 1 (0.17%) WCAG
System Software
1 52 (8.64%) Docker
2 15 (2.49%) Active Directory
3 7 (1.16%) VMware Infrastructure
4 6 (1.00%) Virtual Machines
5 4 (0.66%) vSphere
6 2 (0.33%) Virtual Desktop
7 1 (0.17%) BitLocker
7 1 (0.17%) Hyper-V
7 1 (0.17%) VMware ESXi
Systems Management
1 53 (8.80%) Terraform
2 49 (8.14%) Kubernetes
3 28 (4.65%) Grafana
4 27 (4.49%) Prometheus
5 8 (1.33%) Ansible
6 5 (0.83%) CSIRT
7 3 (0.50%) Argo
7 3 (0.50%) Microsoft Intune
7 3 (0.50%) Single Sign-On
8 2 (0.33%) EMC NetWorker
8 2 (0.33%) Nagios
8 2 (0.33%) Packer
8 2 (0.33%) Puppet
8 2 (0.33%) RSA Archer
8 2 (0.33%) SCCM
9 1 (0.17%) Active Directory Federation Services
9 1 (0.17%) Microsoft Clustering
9 1 (0.17%) Oracle RMAN
9 1 (0.17%) vCenter Server
9 1 (0.17%) WMI
Vendors
1 83 (13.79%) Microsoft
2 78 (12.96%) ServiceNow
3 39 (6.48%) Google
4 15 (2.49%) OpenAI
4 15 (2.49%) SAP
5 13 (2.16%) Salesforce
6 11 (1.83%) VMware
6 11 (1.83%) Workday
7 8 (1.33%) New Relic
7 8 (1.33%) Splunk
8 7 (1.16%) Red Hat
8 7 (1.16%) SolarWinds
9 6 (1.00%) CrowdStrike
9 6 (1.00%) Databricks
9 6 (1.00%) Oracle
10 5 (0.83%) Adobe
10 5 (0.83%) Cisco
10 5 (0.83%) Tanium
11 4 (0.66%) Bloomberg
11 4 (0.66%) Remedy