TCP/IP Jobs in London

Transmission Control Protocol/Internet Protocol (TCP/IP)
England > London

The table below provides summary statistics for permanent job vacancies advertised in London requiring TCP/IP skills. It includes a benchmarking guide to the annual salaries offered in vacancies that cited TCP/IP over the 6 months leading up to 17 July 2025, comparing them to the same period in the previous two years.

6 months to
17 Jul 2025
Same period 2024 Same period 2023
Rank 206 248 270
Rank change year-on-year +42 +22 +87
Permanent jobs citing TCP/IP 214 280 347
As % of all permanent jobs advertised in London 1.63% 1.23% 1.21%
As % of the Communications & Networking category 11.19% 9.43% 10.24%
Number of salaries quoted 142 227 294
10th Percentile £31,500 £37,680 £32,500
25th Percentile £36,250 £42,500 £41,250
Median annual salary (50th Percentile) £52,000 £58,500 £57,625
Median % change year-on-year -11.11% +1.52% +4.77%
75th Percentile £74,258 £75,000 £77,715
90th Percentile £83,750 £87,500 £107,125
England median annual salary £39,398 £42,500 £45,000
% change year-on-year -7.30% -5.56% +1.12%

All Communications and Computer Networking Skills
London

TCP/IP falls under the Communications and Computer Networking category. For comparison with the information above, the following table provides summary statistics for all permanent job vacancies requiring communications or computer networking skills in London.

Permanent vacancies with a requirement for communications or computer networking skills 1,913 2,969 3,388
As % of all permanent jobs advertised in London 14.57% 13.07% 11.83%
Number of salaries quoted 913 1,746 2,626
10th Percentile £31,800 £33,213 £32,500
25th Percentile £41,250 £41,250 £41,750
Median annual salary (50th Percentile) £62,500 £60,000 £62,500
Median % change year-on-year +4.17% -4.00% -
75th Percentile £82,500 £77,969 £82,548
90th Percentile £100,000 £95,000 £100,000
England median annual salary £36,500 £47,500 £50,250
% change year-on-year -23.16% -5.47% -4.29%

TCP/IP
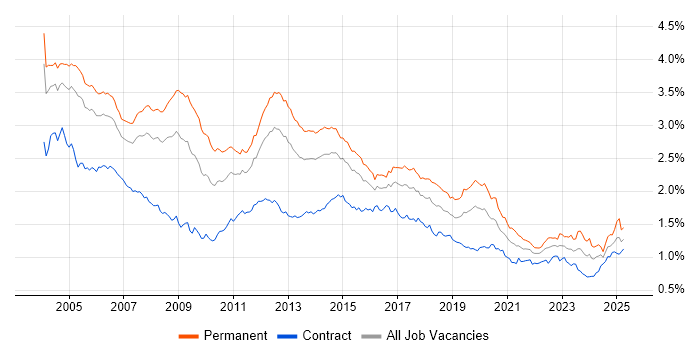
Job Vacancy Trend in London

Job postings citing TCP/IP as a proportion of all IT jobs advertised in London.

Job vacancy trend for TCP/IP in London

TCP/IP
Salary Trend in London

3-month moving average salary quoted in jobs citing TCP/IP in London.

Salary trend for TCP/IP in London

TCP/IP
Salary Histogram in London

Salary distribution for jobs citing TCP/IP in London over the 6 months to 17 July 2025.

Salary histogram for TCP/IP in London

TCP/IP
Job Locations in London

The table below looks at the demand and provides a guide to the median salaries quoted in IT jobs citing TCP/IP within the London region over the 6 months to 17 July 2025. The 'Rank Change' column provides an indication of the change in demand within each location based on the same 6 month period last year.

Location Rank Change
on Same Period
Last Year
Matching
Permanent
IT Job Ads
Median Salary
Past 6 Months
Median Salary
% Change
on Same Period
Last Year
Live
Jobs
Central London +6 31 £70,000 +45.08% 10
West London +25 7 £49,000 +26.45% 4
South London +2 6 £50,750 +56.15% 12
East London -8 6 £53,250 +18.33% 3
TCP/IP
England

TCP/IP
Co-occurring Skills and Capabilities in London by Category

The follow tables expand on the table above by listing co-occurrences grouped by category. The same employment type, locality and period is covered with up to 20 co-occurrences shown in each of the following categories:

Application Platforms
1 43 (20.09%) Microsoft Exchange
2 26 (12.15%) SharePoint
3 4 (1.87%) IIS
3 4 (1.87%) nginx
3 4 (1.87%) Traefik
4 1 (0.47%) Confluence
Applications
1 13 (6.07%) Microsoft Office
2 4 (1.87%) Microsoft Excel
3 2 (0.93%) MS Visio
4 1 (0.47%) Microsoft PowerPoint
4 1 (0.47%) OmniGraffle
Business Applications
1 5 (2.34%) Fidessa
2 1 (0.47%) Eikon
Cloud Services
1 89 (41.59%) Azure
2 66 (30.84%) Microsoft 365
3 56 (26.17%) AWS
4 26 (12.15%) Entra ID
5 17 (7.94%) OneDrive
6 14 (6.54%) Cloud Computing
7 12 (5.61%) SaaS
8 9 (4.21%) GCP
9 7 (3.27%) GitHub
10 6 (2.80%) Microsoft Purview
10 6 (2.80%) Mimecast
10 6 (2.80%) Nutanix
11 5 (2.34%) Akamai
11 5 (2.34%) IaaS
12 4 (1.87%) Amazon EKS
12 4 (1.87%) Cloudflare
12 4 (1.87%) Google Workspace
12 4 (1.87%) PaaS
12 4 (1.87%) Power Automate
13 3 (1.40%) Amazon ECS
Communications & Networking
1 104 (48.60%) DNS
2 87 (40.65%) LAN
3 81 (37.85%) WAN
4 78 (36.45%) DHCP
5 59 (27.57%) Firewall
6 48 (22.43%) VPN
7 32 (14.95%) VLAN
8 29 (13.55%) BGP
9 24 (11.21%) OSPF
10 18 (8.41%) MPLS
11 17 (7.94%) Network Security
12 13 (6.07%) HTTP
13 10 (4.67%) VoIP
14 9 (4.21%) Wi-Fi
14 9 (4.21%) Wireless
15 8 (3.74%) Cisco IOS
16 7 (3.27%) Link 16
16 7 (3.27%) RS-232
16 7 (3.27%) RS-485
16 7 (3.27%) Tactical Data Link
Database & Business Intelligence
1 12 (5.61%) SQL Server
2 3 (1.40%) Amazon RDS
2 3 (1.40%) Elasticsearch
2 3 (1.40%) PostgreSQL
2 3 (1.40%) Redis
3 2 (0.93%) MySQL
4 1 (0.47%) Apache Cassandra
4 1 (0.47%) JasperReports
4 1 (0.47%) Oracle Exadata
4 1 (0.47%) Oracle Reports
Development Applications
1 18 (8.41%) Git
2 7 (3.27%) JIRA
3 1 (0.47%) Cucumber
3 1 (0.47%) Fiddler
3 1 (0.47%) Jenkins
3 1 (0.47%) Robot Framework
General
1 90 (42.06%) Finance
2 85 (39.72%) Social Skills
3 58 (27.10%) Banking
4 38 (17.76%) Analytical Skills
5 22 (10.28%) Inclusion and Diversity
6 20 (9.35%) Telecoms
7 19 (8.88%) Law
8 17 (7.94%) Investment Banking
9 12 (5.61%) Legal
10 8 (3.74%) Military
10 8 (3.74%) Pharmaceutical
11 5 (2.34%) Back Office
12 4 (1.87%) Organisational Skills
12 4 (1.87%) Retail
13 3 (1.40%) Documentation Skills
13 3 (1.40%) Front Office
13 3 (1.40%) Presentation Skills
13 3 (1.40%) Public Sector
13 3 (1.40%) Spanish Language
14 2 (0.93%) Marketing
Job Titles
1 38 (17.76%) Analyst
2 23 (10.75%) Infrastructure Engineer
2 23 (10.75%) Senior
3 21 (9.81%) Developer
3 21 (9.81%) Support Analyst
4 20 (9.35%) Lead
5 19 (8.88%) C++ Developer
5 19 (8.88%) Support Engineer
6 18 (8.41%) Linux Developer
6 18 (8.41%) Low Latency C++ Developer
7 17 (7.94%) Linux Scripter
8 16 (7.48%) Investment Banking C++ Developer
8 16 (7.48%) IT Support
8 16 (7.48%) Network Engineer
9 13 (6.07%) Team Leader
10 12 (5.61%) Wintel Engineer
11 11 (5.14%) Junior
11 11 (5.14%) Windows Engineer
12 10 (4.67%) Desktop Support
12 10 (4.67%) Desktop Support Analyst
Libraries, Frameworks & Software Standards
1 5 (2.34%) FIX Protocol
2 4 (1.87%) Kafka
3 3 (1.40%) 802.1X
3 3 (1.40%) Django
3 3 (1.40%) Middleware
4 2 (0.93%) WebSockets
5 1 (0.47%) .NET
5 1 (0.47%) HTML
5 1 (0.47%) HTML5
5 1 (0.47%) Jinja
5 1 (0.47%) LDAP
5 1 (0.47%) Microsoft Graph
5 1 (0.47%) OAuth
5 1 (0.47%) OpenID
5 1 (0.47%) React
5 1 (0.47%) REST
5 1 (0.47%) SAML
5 1 (0.47%) WSH
5 1 (0.47%) YAML
5 1 (0.47%) YANG
Miscellaneous
1 18 (8.41%) FPGA
2 13 (6.07%) Data Centre
2 13 (6.07%) iPhone
3 11 (5.14%) Management Information System
4 10 (4.67%) Clustering
4 10 (4.67%) Hybrid Cloud
5 8 (3.74%) Hedge funds
5 8 (3.74%) Public Cloud
6 7 (3.27%) Cyber Threat
6 7 (3.27%) iPad
6 7 (3.27%) Self-Motivation
7 6 (2.80%) Equities
7 6 (2.80%) Video Conferencing
8 5 (2.34%) Derivative
8 5 (2.34%) Enterprise Software
8 5 (2.34%) Eurex
8 5 (2.34%) Onboarding
8 5 (2.34%) Replication
9 4 (1.87%) Cloud Native
9 4 (1.87%) Mobile Banking
Operating Systems
1 102 (47.66%) Windows
2 64 (29.91%) Linux
3 63 (29.44%) Windows Server
4 26 (12.15%) Windows Server 2012
5 24 (11.21%) Windows Server 2016
5 24 (11.21%) Windows Server 2019
6 16 (7.48%) Mac OS
6 16 (7.48%) Unix
7 15 (7.01%) Windows 10
8 13 (6.07%) Red Hat Enterprise Linux
9 8 (3.74%) Android
9 8 (3.74%) Windows 7
10 6 (2.80%) Windows Server 2008
11 5 (2.34%) Mac OS X
12 4 (1.87%) CentOS
12 4 (1.87%) Rocky
13 2 (0.93%) Solaris
14 1 (0.47%) Apple iOS
14 1 (0.47%) Ubuntu
Processes & Methodologies
1 58 (27.10%) ITIL
2 52 (24.30%) Problem-Solving
3 30 (14.02%) Cybersecurity
3 30 (14.02%) DevOps
3 30 (14.02%) Infrastructure Engineering
3 30 (14.02%) Patch Management
4 28 (13.08%) Root Cause Analysis
5 27 (12.62%) Disaster Recovery
6 24 (11.21%) Artificial Intelligence
6 24 (11.21%) Collaborative Working
6 24 (11.21%) Incident Management
6 24 (11.21%) Low Latency
6 24 (11.21%) Network Monitoring
7 22 (10.28%) Agile
7 22 (10.28%) Cost Optimisation
7 22 (10.28%) High Availability
8 20 (9.35%) Batch Scripting
9 19 (8.88%) Incident Response
9 19 (8.88%) Process Improvement
9 19 (8.88%) Task Automation
Programming Languages
1 41 (19.16%) PowerShell
2 37 (17.29%) Python
3 25 (11.68%) C
4 23 (10.75%) Java
5 20 (9.35%) SQL
6 19 (8.88%) C++
7 14 (6.54%) Bash
8 7 (3.27%) R
9 6 (2.80%) Perl
10 5 (2.34%) Shell Script
11 4 (1.87%) Go
12 2 (0.93%) JavaScript
13 1 (0.47%) Bourne shell
13 1 (0.47%) C#
13 1 (0.47%) C-shell
13 1 (0.47%) Ruby
13 1 (0.47%) TypeScript
13 1 (0.47%) VB.NET
13 1 (0.47%) VBScript
Qualifications
1 40 (18.69%) Degree
2 38 (17.76%) Cisco Certification
3 32 (14.95%) CCNA
4 30 (14.02%) Microsoft Certification
5 23 (10.75%) Azure Certification
6 16 (7.48%) CCNP
7 14 (6.54%) ITIL Foundation Certificate
8 13 (6.07%) Security Cleared
9 12 (5.61%) MCSE
10 11 (5.14%) VMware Certified Professional (VCP)
11 10 (4.67%) CompTIA Security+
12 8 (3.74%) GSEC
13 7 (3.27%) MCSA
13 7 (3.27%) SSCP
14 6 (2.80%) AWS Certification
14 6 (2.80%) SC Cleared
15 5 (2.34%) GIAC
16 4 (1.87%) ITIL Certification
16 4 (1.87%) Network+ Certification
17 3 (1.40%) CISSP
Quality Assurance & Compliance
1 34 (15.89%) SLA
2 14 (6.54%) ISO/IEC 27001
3 7 (3.27%) MIL-STD-1553
4 5 (2.34%) Cyber Essentials
5 3 (1.40%) NCSC
5 3 (1.40%) NIST
6 1 (0.47%) GDPR
6 1 (0.47%) NIST 800
6 1 (0.47%) QA
System Software
1 82 (38.32%) Active Directory
2 40 (18.69%) VMware Infrastructure
3 29 (13.55%) Hyper-V
4 13 (6.07%) Virtual Desktop
5 9 (4.21%) vSphere
6 7 (3.27%) VMware ESXi
7 6 (2.80%) Virtual Machines
8 5 (2.34%) NFS
9 4 (1.87%) Docker
9 4 (1.87%) Veritas Cluster Server
9 4 (1.87%) XenApp
10 2 (0.93%) Virtual Servers
10 2 (0.93%) VMware NSX
11 1 (0.47%) Firmware
11 1 (0.47%) pfSense
Systems Management
1 40 (18.69%) Microsoft Intune
2 30 (14.02%) SCCM
3 26 (12.15%) Ansible
4 18 (8.41%) Terraform
5 15 (7.01%) Kubernetes
6 14 (6.54%) Active Directory Federation Services
7 13 (6.07%) Single Sign-On
8 12 (5.61%) NetBackup
8 12 (5.61%) SCOM
9 4 (1.87%) Grafana
9 4 (1.87%) HAProxy
9 4 (1.87%) WSUS
10 3 (1.40%) AWS Copilot
11 2 (0.93%) Autotask
11 2 (0.93%) FortiGate
11 2 (0.93%) Nagios
11 2 (0.93%) vCenter Server
12 1 (0.47%) Backup Exec
12 1 (0.47%) Progress Chef
12 1 (0.47%) Puppet
Vendors
1 87 (40.65%) Microsoft
2 50 (23.36%) Cisco
3 45 (21.03%) VMware
4 22 (10.28%) Red Hat
5 21 (9.81%) SolarWinds
6 17 (7.94%) ServiceNow
7 15 (7.01%) Citrix
8 14 (6.54%) Juniper
8 14 (6.54%) Veeam
9 13 (6.07%) Bloomberg
9 13 (6.07%) Google
10 12 (5.61%) Reuters
11 9 (4.21%) Fortinet
11 9 (4.21%) Oracle
12 7 (3.27%) Commvault
12 7 (3.27%) Palo Alto
12 7 (3.27%) Pure Storage
13 6 (2.80%) Acronis
13 6 (2.80%) CheckPoint
13 6 (2.80%) EMC