SC Cleared Jobs in London

Security Check (SC) Clearance
England > London

The following table provides summary statistics for permanent job vacancies advertised in London with a requirement for SC Cleared qualifications. Included is a benchmarking guide to the salaries offered over the 6 months to 2 December 2023 with a comparison to the same period in the previous 2 years.

6 months to
2 Dec 2023
Same period 2022 Same period 2021
Rank 115 214 233
Rank change year-on-year +99 +19 -86
Permanent jobs citing SC Cleared 511 817 850
As % of all permanent jobs advertised in London 2.75% 1.71% 1.64%
As % of the Qualifications category 10.35% 7.59% 8.32%
Number of salaries quoted 368 450 621
10th Percentile £45,000 £41,665 £45,000
25th Percentile £57,500 £52,500 £55,000
Median annual salary (50th Percentile) £70,000 £68,488 £70,000
Median % change year-on-year +2.21% -2.16% +16.67%
75th Percentile £87,500 £91,063 £87,500
90th Percentile £93,750 £105,125 £95,000
England median annual salary £57,500 £57,500 £60,050
% change year-on-year - -4.25% +9.18%

All Academic and Professional Certifications
London

SC Cleared is in the Academic Qualifications and Professional Certifications category. The following table is for comparison with the above and provides summary statistics for all permanent job vacancies advertised in London with a requirement for academic qualifications or professional certifications.

Permanent vacancies requiring academic qualifications or professional certifications 4,939 10,766 10,215
As % of all permanent jobs advertised in London 26.58% 22.54% 19.76%
Number of salaries quoted 3,569 6,163 6,519
10th Percentile £38,750 £37,066 £37,500
25th Percentile £52,500 £50,000 £49,000
Median annual salary (50th Percentile) £70,000 £67,500 £67,500
Median % change year-on-year +3.70% - +3.85%
75th Percentile £90,000 £88,283 £87,500
90th Percentile £112,500 £107,500 £100,000
England median annual salary £57,500 £56,000 £55,000
% change year-on-year +2.68% +1.82% -

SC Cleared
Job Vacancy Trend in London

Job postings citing SC Cleared as a proportion of all IT jobs advertised in London.
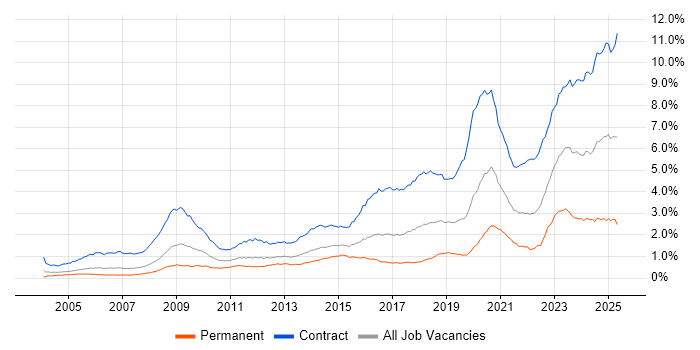
Job vacancy trend for SC Cleared in London

SC Cleared
Salary Trend in London

3-month moving average salary quoted in jobs citing SC Cleared in London.

Salary trend for SC Cleared in London

SC Cleared
Salary Histogram in London

Salary distribution for jobs citing SC Cleared in London over the 6 months to 2 December 2023.

Salary histogram for SC Cleared in London

SC Cleared
Job Locations in London

The table below looks at the demand and provides a guide to the median salaries quoted in IT jobs citing SC Cleared within the London region over the 6 months to 2 December 2023. The 'Rank Change' column provides an indication of the change in demand within each location based on the same 6 month period last year.

Location Rank Change
on Same Period
Last Year
Matching
Permanent
IT Job Ads
Median Salary
Past 6 Months
Median Salary
% Change
on Same Period
Last Year
Live
Jobs
Central London +108 136 £65,000 -7.14% 24
South London +4 27 £72,500 +11.54% 35
West London +49 8 £57,500 +40.24% 19
SC Cleared
England

SC Cleared
Co-occurring Skills and Capabilities in London by Category

The follow tables expand on the table above by listing co-occurrences grouped by category. The same employment type, locality and period is covered with up to 20 co-occurrences shown in each of the following categories:

Application Platforms
1 8 (1.57%) Confluence
1 8 (1.57%) JBoss
1 8 (1.57%) Red Hat Fuse
2 7 (1.37%) MS Exchange
3 3 (0.59%) Apache Spark
3 3 (0.59%) OpenStack
3 3 (0.59%) SharePoint
4 2 (0.39%) Anypoint
4 2 (0.39%) BizTalk Server
4 2 (0.39%) NetWeaver
4 2 (0.39%) Tomcat
5 1 (0.20%) Apache Airflow
5 1 (0.20%) CMS
5 1 (0.20%) Drupal
5 1 (0.20%) nginx
5 1 (0.20%) Oracle Application Server
5 1 (0.20%) WebSphere
5 1 (0.20%) WebSphere Application Server
5 1 (0.20%) WordPress
Applications
1 5 (0.98%) Microsoft Excel
1 5 (0.98%) Spreadsheet
2 4 (0.78%) Microsoft Project
3 3 (0.59%) Microsoft PowerPoint
4 2 (0.39%) Microsoft Office
5 1 (0.20%) MS Visio
Business Applications
1 28 (5.48%) Remedy ITSM
2 11 (2.15%) Elite 3E
3 5 (0.98%) Oracle EBS
4 4 (0.78%) Dynamics CRM
5 2 (0.39%) SAP CO
5 2 (0.39%) SAP FI
5 2 (0.39%) SAP FI/CO
5 2 (0.39%) SAP PS
5 2 (0.39%) SAP S/4HANA
6 1 (0.20%) HFM
6 1 (0.20%) Hyperion Planning
6 1 (0.20%) IBM Planning Analytics
6 1 (0.20%) Oracle FAH
6 1 (0.20%) SAP CRM
6 1 (0.20%) SAP CX
6 1 (0.20%) SAP GTS
6 1 (0.20%) SAP HR
6 1 (0.20%) SAP SCM
6 1 (0.20%) SAP SD
6 1 (0.20%) SAP WM
Cloud Services
1 124 (24.27%) AWS
2 105 (20.55%) Azure
3 41 (8.02%) SaaS
4 37 (7.24%) Serverless
5 33 (6.46%) GCP
6 29 (5.68%) Power Platform
7 26 (5.09%) Azure DevOps
8 22 (4.31%) AWS CloudFormation
9 19 (3.72%) Dynamics 365
10 18 (3.52%) Amazon ECS
11 17 (3.33%) dbt
12 14 (2.74%) Microsoft 365
13 13 (2.54%) AWS Lambda
13 13 (2.54%) Cloud Computing
14 10 (1.96%) Amazon S3
14 10 (1.96%) Entra ID
14 10 (1.96%) GitHub
15 9 (1.76%) PaaS
16 7 (1.37%) Oracle Service Cloud
17 6 (1.17%) Amazon CloudWatch
Communications & Networking
1 22 (4.31%) Firewall
2 21 (4.11%) Network Security
2 21 (4.11%) VPN
3 20 (3.91%) SSL
4 13 (2.54%) TCP/IP
5 8 (1.57%) HTTP
6 5 (0.98%) DNS
6 5 (0.98%) Internet
7 3 (0.59%) DHCP
8 2 (0.39%) FTP
8 2 (0.39%) HTTPS
8 2 (0.39%) Intrusion Detection
8 2 (0.39%) OSPF
8 2 (0.39%) SMTP
8 2 (0.39%) SSH
8 2 (0.39%) VRRP
9 1 (0.20%) VLAN
9 1 (0.20%) Wi-Fi
9 1 (0.20%) Wireless
9 1 (0.20%) Wireshark
Database & Business Intelligence
1 36 (7.05%) PostgreSQL
2 26 (5.09%) Relational Database
2 26 (5.09%) SQL Server
3 21 (4.11%) Redis
4 19 (3.72%) MySQL
5 17 (3.33%) Elasticsearch
6 15 (2.94%) Oracle Reports
6 15 (2.94%) Power BI
7 14 (2.74%) NoSQL
8 9 (1.76%) Metadata
8 9 (1.76%) RDBMS
9 8 (1.57%) Big Data
10 7 (1.37%) Oracle Database
11 6 (1.17%) Amazon RDS
11 6 (1.17%) Amazon Redshift
12 5 (0.98%) Data Warehouse
12 5 (0.98%) Oracle BI Publisher
13 4 (0.78%) BusinessObjects
14 3 (0.59%) Metadata Repository
14 3 (0.59%) Oracle BI EE
Development Applications
1 51 (9.98%) Jenkins
2 36 (7.05%) Git
3 32 (6.26%) JIRA
4 17 (3.33%) Selenium
5 16 (3.13%) Cucumber
6 15 (2.94%) Maven
7 12 (2.35%) IntelliJ
7 12 (2.35%) JUnit
8 11 (2.15%) Oracle Forms
9 10 (1.96%) GitLab
10 7 (1.37%) Serenity BDD
10 7 (1.37%) SoapUI
11 6 (1.17%) Bitbucket
12 5 (0.98%) Bitbucket Server
12 5 (0.98%) Gradle
12 5 (0.98%) JMeter
12 5 (0.98%) Mocha
12 5 (0.98%) Sinon.JS
12 5 (0.98%) Subversion
12 5 (0.98%) WebDriver
General
1 152 (29.75%) Social Skills
2 106 (20.74%) Public Sector
3 70 (13.70%) Inclusion and Diversity
4 33 (6.46%) Law
5 32 (6.26%) Presentation Skills
6 30 (5.87%) Police
7 24 (4.70%) Finance
8 23 (4.50%) Analytical Skills
9 17 (3.33%) Influencing Skills
9 17 (3.33%) Organisational Skills
10 15 (2.94%) Legal
11 11 (2.15%) Marketing
11 11 (2.15%) Retail
12 8 (1.57%) Telecoms
13 7 (1.37%) Aerospace
14 6 (1.17%) Documentation Skills
15 2 (0.39%) Aeronautics
15 2 (0.39%) Automotive
15 2 (0.39%) Banking
15 2 (0.39%) Digital Economy
Job Titles
1 96 (18.79%) Senior
2 86 (16.83%) Architect
3 74 (14.48%) Developer
4 64 (12.52%) Consultant
5 44 (8.61%) Solutions Architect
6 43 (8.41%) Analyst
7 37 (7.24%) DevOps Engineer
8 31 (6.07%) Software Engineer
9 28 (5.48%) Java Developer
10 23 (4.50%) Business Analyst
10 23 (4.50%) Lead
11 22 (4.31%) Security Architect
11 22 (4.31%) Senior Consultant
11 22 (4.31%) Technical Consultant
12 21 (4.11%) Presales Solution Architect
12 21 (4.11%) Technical Architect
13 20 (3.91%) AWS Engineer
13 20 (3.91%) Tester
14 19 (3.72%) AWS DevOps
14 19 (3.72%) AWS DevOps Engineer
Libraries, Frameworks & Software Standards
1 52 (10.18%) Web Services
2 47 (9.20%) SOAP
3 43 (8.41%) XML
4 38 (7.44%) HTML
5 34 (6.65%) REST
5 34 (6.65%) Spring
6 27 (5.28%) Node.js
7 26 (5.09%) React
8 25 (4.89%) CSS
9 23 (4.50%) JSON
9 23 (4.50%) Velocity
10 18 (3.52%) LDAP
11 17 (3.33%) .NET
11 17 (3.33%) Ajax
11 17 (3.33%) RESTful
12 15 (2.94%) Django
13 14 (2.74%) AngularJS
13 14 (2.74%) Kafka
14 12 (2.35%) Oracle Fusion
15 10 (1.96%) Spring Boot
Miscellaneous
1 28 (5.48%) Product Ownership
2 26 (5.09%) Management Information System
3 17 (3.33%) Cloud Native
3 17 (3.33%) CMDB
4 13 (2.54%) Distributed Systems
5 12 (2.35%) Legacy Systems
6 7 (1.37%) Blog
6 7 (1.37%) Hybrid Cloud
6 7 (1.37%) Operational Technology
6 7 (1.37%) PKI
6 7 (1.37%) Public Cloud
7 6 (1.17%) Team-Oriented Environment
8 5 (0.98%) Cyberattack
8 5 (0.98%) Data Centre
8 5 (0.98%) Self-Motivation
8 5 (0.98%) Virtual Team
9 4 (0.78%) Cyber Threat
9 4 (0.78%) Data Structures
10 3 (0.59%) IoT
10 3 (0.59%) iPhone
Operating Systems
1 49 (9.59%) Linux
2 40 (7.83%) Windows
3 15 (2.94%) Unix
3 15 (2.94%) Windows Server
4 9 (1.76%) Android
5 6 (1.17%) Apple iOS
5 6 (1.17%) Windows Server 2016
6 5 (0.98%) Solaris
7 4 (0.78%) Windows Server 2012
8 3 (0.59%) Mac OS
8 3 (0.59%) Windows Server 2019
9 2 (0.39%) AIX
9 2 (0.39%) Debian
9 2 (0.39%) Mac OS X
9 2 (0.39%) Red Hat Enterprise Linux
9 2 (0.39%) SUSE Linux Enterprise Server
9 2 (0.39%) VMS
10 1 (0.20%) Ubuntu
10 1 (0.20%) Windows 7
10 1 (0.20%) Windows Server 2003
Processes & Methodologies
1 183 (35.81%) Agile
2 103 (20.16%) DevOps
3 81 (15.85%) Actionable Insight
3 81 (15.85%) Problem-Solving
4 74 (14.48%) CI/CD
4 74 (14.48%) Software Engineering
5 67 (13.11%) Cybersecurity
6 66 (12.92%) Project Delivery
7 59 (11.55%) Presales
8 51 (9.98%) Thought Leadership
9 49 (9.59%) Continuous Integration
10 48 (9.39%) Project Management
11 43 (8.41%) Business Case
12 42 (8.22%) Analytics
12 42 (8.22%) Stakeholder Management
13 41 (8.02%) Mentoring
14 40 (7.83%) Containerisation
14 40 (7.83%) Scrum
15 38 (7.44%) Microservices
15 38 (7.44%) Open Source
Programming Languages
1 97 (18.98%) Python
2 86 (16.83%) Java
3 66 (12.92%) JavaScript
4 45 (8.81%) SQL
5 25 (4.89%) C#
6 22 (4.31%) Bash
6 22 (4.31%) Perl
7 21 (4.11%) Ruby
8 15 (2.94%) PowerShell
9 13 (2.54%) Go
10 9 (1.76%) Groovy
11 7 (1.37%) TypeScript
12 6 (1.17%) PL/SQL
13 5 (0.98%) ABAP
13 5 (0.98%) C++
14 4 (0.78%) X++
15 3 (0.59%) T-SQL
15 3 (0.59%) VBA
16 2 (0.39%) Scala
16 2 (0.39%) VB.NET
Qualifications
1 511 (100.00%) Security Cleared
2 92 (18.00%) Degree
3 55 (10.76%) DV Cleared
4 23 (4.50%) CISSP
5 18 (3.52%) Computer Science Degree
6 16 (3.13%) BPSS Clearance
7 12 (2.35%) Microsoft Certification
7 12 (2.35%) TOGAF Certification
8 10 (1.96%) ISSAP
9 9 (1.76%) AWS Certification
9 9 (1.76%) Azure Certification
9 9 (1.76%) CREST Certified
10 6 (1.17%) Cyber Scheme
11 5 (0.98%) CISM
12 4 (0.78%) Cisco Certification
12 4 (0.78%) Master's Degree
13 3 (0.59%) CHECK Team Leader
13 3 (0.59%) CHECK Team Member
13 3 (0.59%) DBS Check
13 3 (0.59%) SANS
Quality Assurance & Compliance
1 44 (8.61%) QA
2 22 (4.31%) ISO/IEC 27001
3 19 (3.72%) Data Quality
4 13 (2.54%) Accessibility
4 13 (2.54%) NIST
5 9 (1.76%) Cyber Essentials
5 9 (1.76%) NCSC
6 4 (0.78%) NIST 800
7 3 (0.59%) GRC
7 3 (0.59%) SLA
8 2 (0.39%) COBIT
8 2 (0.39%) PCI DSS
9 1 (0.20%) ARP4754
9 1 (0.20%) ARP4761
9 1 (0.20%) Cyber Essentials PLUS
9 1 (0.20%) HMG Security Policy Framework
9 1 (0.20%) ISO/IEC 15288
9 1 (0.20%) PMO
9 1 (0.20%) RMADS
9 1 (0.20%) WCAG
System Software
1 37 (7.24%) Docker
2 24 (4.70%) Active Directory
3 15 (2.94%) Hyper-V
3 15 (2.94%) VMware Infrastructure
4 6 (1.17%) VMware ESXi
5 4 (0.78%) Squid
6 2 (0.39%) vSphere
7 1 (0.20%) BitLocker
7 1 (0.20%) Firmware
7 1 (0.20%) Oracle RAC
7 1 (0.20%) Virtual Machines
7 1 (0.20%) XenApp
7 1 (0.20%) XenDesktop
Systems Management
1 54 (10.57%) Kubernetes
1 54 (10.57%) Terraform
2 22 (4.31%) Ansible
3 17 (3.33%) HP UCMDB
4 7 (1.37%) Grafana
5 6 (1.17%) Kibana
6 5 (0.98%) Prometheus
7 4 (0.78%) Active Directory Federation Services
8 3 (0.59%) NetBackup
8 3 (0.59%) vCenter Server
9 2 (0.39%) Consul
9 2 (0.39%) Microsoft Intune
9 2 (0.39%) Nagios
9 2 (0.39%) Packer
9 2 (0.39%) Puppet
9 2 (0.39%) Single Sign-On
10 1 (0.20%) logstash
10 1 (0.20%) Oracle Enterprise Manager
10 1 (0.20%) Proxmox
10 1 (0.20%) vRealize Orchestrator
Vendors
1 66 (12.92%) Microsoft
2 55 (10.76%) Oracle
3 33 (6.46%) ServiceNow
4 31 (6.07%) HP
4 31 (6.07%) Remedy
5 28 (5.48%) BMC
6 22 (4.31%) Google
6 22 (4.31%) VMware
7 8 (1.57%) SAP
8 6 (1.17%) F5
8 6 (1.17%) Veeam
9 5 (0.98%) NetApp
9 5 (0.98%) Splunk
10 4 (0.78%) Dell
10 4 (0.78%) Red Hat
11 3 (0.59%) ArcSight
11 3 (0.59%) Atlassian
11 3 (0.59%) Cisco
11 3 (0.59%) IBM
11 3 (0.59%) Peregrine