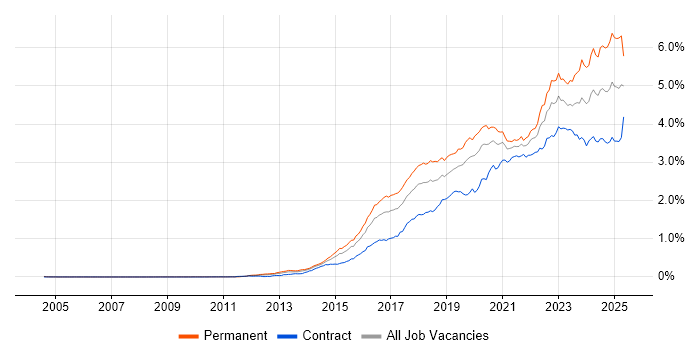
Cybersecurity Job Trends in London

Cybersecurity
England > London

The table below provides summary statistics and salary benchmarking for jobs advertised in London requiring Cybersecurity skills. It covers vacancies from the 6 months leading up to 18 September 2025, with comparisons to the same periods in the previous two years.

6 months to
18 Sep 2025
Same period 2024 Same period 2023
Rank 37 38 52
Rank change year-on-year +1 +14 +36
Permanent jobs citing Cybersecurity 828 1,110 1,088
As % of all permanent jobs advertised in London 6.93% 5.76% 4.96%
As % of the Processes & Methodologies category 7.36% 6.44% 5.28%
Number of salaries quoted 488 585 900
10th Percentile £36,250 £45,250 £42,500
25th Percentile £51,250 £56,500 £55,000
Median annual salary (50th Percentile) £70,000 £74,000 £70,000
Median % change year-on-year -5.41% +5.71% -3.45%
75th Percentile £95,000 £92,500 £92,500
90th Percentile £120,000 £115,000 £107,500
England median annual salary £55,000 £60,000 £64,000
% change year-on-year -8.33% -6.25% -1.54%

All Process and Methodology Skills
London

Cybersecurity falls under the Processes and Methodologies category. For comparison with the information above, the following table provides summary statistics for all permanent job vacancies requiring process or methodology skills in London.

Permanent vacancies with a requirement for process or methodology skills 11,248 17,241 20,615
As % of all permanent jobs advertised in London 94.12% 89.40% 93.94%
Number of salaries quoted 7,129 10,533 16,897
10th Percentile £38,500 £40,000 £42,500
25th Percentile £52,500 £55,000 £55,000
Median annual salary (50th Percentile) £75,000 £75,000 £75,000
Median % change year-on-year - - +7.14%
75th Percentile £97,500 £96,250 £95,000
90th Percentile £122,500 £120,000 £116,250
England median annual salary £55,000 £57,500 £62,400
% change year-on-year -4.35% -7.85% +4.00%

Cybersecurity
Job Vacancy Trend in London

Job postings citing Cybersecurity as a proportion of all IT jobs advertised in London.

Job vacancy trend for Cybersecurity in London

Cybersecurity
Salary Trend in London

Salary distribution trend for jobs in London citing Cybersecurity.

Salary distribution trend for jobs in London citing Cybersecurity

Cybersecurity
Salary Histogram in London

Salary distribution for jobs citing Cybersecurity in London over the 6 months to 18 September 2025.

Salary histogram for Cybersecurity in London

Cybersecurity
Job Locations in London

The table below looks at the demand and provides a guide to the median salaries quoted in IT jobs citing Cybersecurity within the London region over the 6 months to 18 September 2025. The 'Rank Change' column provides an indication of the change in demand within each location based on the same 6 month period last year.

Location Rank Change
on Same Period
Last Year
Matching
Permanent
IT Job Ads
Median Salary
Past 6 Months
Median Salary
% Change
on Same Period
Last Year
Live
Jobs
Central London -15 104 £75,000 +11.11% 122
West London +21 44 £90,000 -10.00% 44
South London +1 26 £46,000 -36.55% 30
East London +11 21 £97,500 +70.77% 34
North London -7 4 £41,250 -8.33% 17
Cybersecurity
England

Cybersecurity
Co-occurring Skills and Capabilities in London by Category

The follow tables expand on the table above by listing co-occurrences grouped by category. The same employment type, locality and period is covered with up to 20 co-occurrences shown in each of the following categories:

Application Platforms
1 22 (2.66%) SharePoint
2 16 (1.93%) Microsoft Exchange
3 8 (0.97%) Confluence
4 7 (0.85%) nginx
5 5 (0.60%) Apache
5 5 (0.60%) CMS
6 4 (0.48%) Apache Spark
6 4 (0.48%) Traefik
7 3 (0.36%) Apache Solr
8 2 (0.24%) Apache Airflow
9 1 (0.12%) IIS
9 1 (0.12%) Oracle Workflow
Applications
1 60 (7.25%) Maya
2 22 (2.66%) Microsoft Office
3 21 (2.54%) Microsoft Excel
4 9 (1.09%) Microsoft PowerPoint
5 4 (0.48%) Adobe XD
5 4 (0.48%) MS Visio
5 4 (0.48%) Sketch
6 3 (0.36%) CINEMA 4D
7 2 (0.24%) Adobe Creative Suite
8 1 (0.12%) GNU Octave
8 1 (0.12%) Microsoft Project
Business Applications
1 29 (3.50%) SAP S/4HANA
2 26 (3.14%) SAP IBP
3 17 (2.05%) Dynamics CRM
4 15 (1.81%) SAP CO
4 15 (1.81%) SAP FI
4 15 (1.81%) SAP FI/CO
4 15 (1.81%) SAP FSCM
5 12 (1.45%) SAP IS-U
6 9 (1.09%) Exchequer
7 7 (0.85%) Salesforce CRM
8 6 (0.72%) SAP FS
9 5 (0.60%) NetSuite
10 4 (0.48%) Fidessa
11 2 (0.24%) SAP CX
12 1 (0.12%) Lorenzo
12 1 (0.12%) Pegasus Opera
12 1 (0.12%) SystmOne
Cloud Services
1 179 (21.62%) Azure
2 154 (18.60%) AWS
3 82 (9.90%) Microsoft 365
4 52 (6.28%) GCP
5 50 (6.04%) Power Platform
6 30 (3.62%) Entra ID
7 29 (3.50%) SaaS
8 28 (3.38%) Cloud Computing
9 27 (3.26%) PaaS
10 26 (3.14%) Serverless
11 22 (2.66%) Azure DevOps
12 21 (2.54%) IaaS
13 19 (2.29%) Amazon EC2
14 18 (2.17%) GitHub
15 16 (1.93%) Boomi
15 16 (1.93%) Salesforce Commerce Cloud
16 12 (1.45%) AWS Lambda
16 12 (1.45%) Dynamics 365
17 11 (1.33%) Azure Sentinel
18 10 (1.21%) Amazon S3
Communications & Networking
1 97 (11.71%) Firewall
2 50 (6.04%) VPN
3 35 (4.23%) WAN
4 34 (4.11%) Network Security
5 25 (3.02%) LAN
6 24 (2.90%) TCP/IP
7 21 (2.54%) DNS
8 20 (2.42%) DHCP
8 20 (2.42%) Intrusion Detection
8 20 (2.42%) VoIP
9 12 (1.45%) VLAN
9 12 (1.45%) Wireshark
10 7 (0.85%) Wi-Fi
11 6 (0.72%) SAN
12 5 (0.60%) 4G
12 5 (0.60%) Internet
12 5 (0.60%) IP Telephony
12 5 (0.60%) NAS
12 5 (0.60%) SSL
12 5 (0.60%) Unified Communications
Database & Business Intelligence
1 43 (5.19%) Power BI
2 31 (3.74%) Tableau
3 28 (3.38%) Data Warehouse
3 28 (3.38%) SQL Server
4 26 (3.14%) SAP BW
5 19 (2.29%) Data Lake
6 14 (1.69%) PostgreSQL
7 13 (1.57%) Relational Database
8 10 (1.21%) Metadata
9 9 (1.09%) MySQL
10 8 (0.97%) Amazon Athena
10 8 (0.97%) Amazon Aurora
10 8 (0.97%) DynamoDB
10 8 (0.97%) NoSQL
11 6 (0.72%) Elasticsearch
12 5 (0.60%) Data Mining
13 4 (0.48%) Amazon RDS
13 4 (0.48%) Azure SQL Database
13 4 (0.48%) Big Data
13 4 (0.48%) Oracle Database
Development Applications
1 23 (2.78%) Git
2 13 (1.57%) JIRA
3 10 (1.21%) IntelliJ
4 9 (1.09%) Jenkins
5 8 (0.97%) GitLab
6 4 (0.48%) git-flow
6 4 (0.48%) Spinnaker
7 3 (0.36%) Babel
7 3 (0.36%) Bitbucket
7 3 (0.36%) gulp
7 3 (0.36%) webpack
8 2 (0.24%) Artifactory
8 2 (0.24%) Oracle APEX
9 1 (0.12%) Atlassian Bamboo
9 1 (0.12%) IDA Disassembler
9 1 (0.12%) JUnit
9 1 (0.12%) SonarQube
9 1 (0.12%) Sonatype Nexus
9 1 (0.12%) Zephyr
General
1 362 (43.72%) Social Skills
2 359 (43.36%) Finance
3 230 (27.78%) Analytical Skills
4 197 (23.79%) Law
5 116 (14.01%) Banking
6 115 (13.89%) Inclusion and Diversity
7 89 (10.75%) Legal
7 89 (10.75%) Marketing
8 81 (9.78%) Games
9 64 (7.73%) Telecoms
10 55 (6.64%) Public Sector
11 51 (6.16%) Manufacturing
12 47 (5.68%) Presentation Skills
13 37 (4.47%) Retail
14 33 (3.99%) Organisational Skills
15 32 (3.86%) Dutch Language
15 32 (3.86%) French Language
16 31 (3.74%) Electronics
17 19 (2.29%) Influencing Skills
18 15 (1.81%) Automotive
Job Titles
1 141 (17.03%) Senior
2 94 (11.35%) Analyst
3 91 (10.99%) Architect
4 88 (10.63%) Lead
5 87 (10.51%) IT Manager
6 61 (7.37%) IT Support
7 54 (6.52%) IT Architect
8 53 (6.40%) Security Analyst
9 50 (6.04%) Consultant
10 46 (5.56%) Security Engineer
11 45 (5.43%) Senior Architect
12 40 (4.83%) Support Manager
13 39 (4.71%) Operations Manager
14 35 (4.23%) IT Support Manager
15 33 (3.99%) IT Operations Manager
16 32 (3.86%) Senior Consultant
17 31 (3.74%) Software Engineer
18 23 (2.78%) Cybersecurity Analyst
19 22 (2.66%) Security Architect
20 21 (2.54%) IT Consultant
Libraries, Frameworks & Software Standards
1 37 (4.47%) React
2 33 (3.99%) REST
3 22 (2.66%) RESTful
4 20 (2.42%) Kafka
5 19 (2.29%) CSS
6 18 (2.17%) HTML
7 17 (2.05%) Vue
8 16 (1.93%) Middleware
8 16 (1.93%) YAML
9 12 (1.45%) AngularJS
10 11 (1.33%) Node.js
10 11 (1.33%) Web Services
11 9 (1.09%) .NET
12 6 (0.72%) GraphQL
12 6 (0.72%) jQuery
12 6 (0.72%) OAuth
12 6 (0.72%) Pandas
13 5 (0.60%) PyTorch
13 5 (0.60%) Spring Boot
13 5 (0.60%) TensorFlow
Miscellaneous
1 92 (11.11%) Enterprise Software
2 85 (10.27%) Management Information System
3 63 (7.61%) Cyberattack
4 61 (7.37%) Security Posture
5 59 (7.13%) Cyber Threat
6 43 (5.19%) Cloud Native
7 38 (4.59%) Onboarding
8 29 (3.50%) Self-Motivation
9 28 (3.38%) Virtual Team
10 24 (2.90%) Analytical Mindset
10 24 (2.90%) CCTV
11 17 (2.05%) Data Centre
11 17 (2.05%) Taxonomies
12 16 (1.93%) Cyber Defence
12 16 (1.93%) PMI
12 16 (1.93%) Reinsurance
12 16 (1.93%) Security Operations Centre
13 13 (1.57%) Blockchain
13 13 (1.57%) Operational Technology
14 12 (1.45%) Product Ownership
Operating Systems
1 85 (10.27%) Windows
2 55 (6.64%) Linux
3 24 (2.90%) Windows Server
4 17 (2.05%) Android
4 17 (2.05%) Mac OS
5 16 (1.93%) Windows 10
6 11 (1.33%) Apple iOS
7 10 (1.21%) Unix
8 7 (0.85%) Windows Server 2016
9 6 (0.72%) VMS
10 5 (0.60%) Red Hat Enterprise Linux
10 5 (0.60%) Ubuntu
10 5 (0.60%) Windows 7
11 2 (0.24%) Windows Server 2019
12 1 (0.12%) Debian
12 1 (0.12%) Kali Linux
Processes & Methodologies
1 255 (30.80%) Problem-Solving
2 210 (25.36%) Risk Management
3 155 (18.72%) Project Management
4 151 (18.24%) Incident Response
5 143 (17.27%) Analytics
6 136 (16.43%) Agile
7 134 (16.18%) Information Security
8 111 (13.41%) Mentoring
9 110 (13.29%) Roadmaps
10 104 (12.56%) Artificial Intelligence
11 103 (12.44%) Business Strategy
12 101 (12.20%) Computer Science
13 95 (11.47%) SIEM
14 92 (11.11%) Project Delivery
15 91 (10.99%) DevOps
16 90 (10.87%) Business Intelligence
17 87 (10.51%) IT Strategy
17 87 (10.51%) Service Management
18 83 (10.02%) CI/CD
19 82 (9.90%) Incident Management
Programming Languages
1 83 (10.02%) Python
2 63 (7.61%) PowerShell
3 41 (4.95%) SQL
4 35 (4.23%) Java
5 33 (3.99%) JavaScript
6 16 (1.93%) Bash
7 14 (1.69%) R
8 13 (1.57%) TypeScript
9 10 (1.21%) Go
10 9 (1.09%) Kotlin
11 8 (0.97%) C#
11 8 (0.97%) Scala
12 7 (0.85%) T-SQL
13 4 (0.48%) Bicep
13 4 (0.48%) Perl
14 2 (0.24%) Apex Code
14 2 (0.24%) Kusto Query Language
14 2 (0.24%) SOQL
14 2 (0.24%) SOSL
14 2 (0.24%) VBScript
Qualifications
1 277 (33.45%) Degree
2 166 (20.05%) CISSP
3 115 (13.89%) CISM
4 66 (7.97%) PMI Certification
5 55 (6.64%) CISA
5 55 (6.64%) Computer Science Degree
6 50 (6.04%) PMP
7 46 (5.56%) CRISC
7 46 (5.56%) Master's Degree
8 25 (3.02%) Security Cleared
9 22 (2.66%) Cisco Certification
10 20 (2.42%) Azure Certification
10 20 (2.42%) GCIH
10 20 (2.42%) SC Cleared
11 19 (2.29%) AWS Certification
12 18 (2.17%) GCIA
12 18 (2.17%) Microsoft Certification
13 17 (2.05%) CEH
14 15 (1.81%) (ISC)2 CCSP
15 13 (1.57%) GCFA
Quality Assurance & Compliance
1 178 (21.50%) ISO/IEC 27001
2 169 (20.41%) NIST
3 120 (14.49%) GDPR
4 89 (10.75%) Cyber Essentials
5 70 (8.45%) NCSC
6 58 (7.00%) QA
7 57 (6.88%) GRC
8 48 (5.80%) Cyber Essentials PLUS
9 36 (4.35%) SOC 2
10 27 (3.26%) NIST 800
11 26 (3.14%) PCI DSS
12 22 (2.66%) COBIT
13 18 (2.17%) SOC 1
14 17 (2.05%) GxP
15 14 (1.69%) Data Quality
15 14 (1.69%) SLA
16 13 (1.57%) ITGC
17 11 (1.33%) Accessibility
18 8 (0.97%) HIPAA
18 8 (0.97%) PMO
System Software
1 45 (5.43%) Active Directory
2 28 (3.38%) VMware Infrastructure
3 27 (3.26%) Docker
4 15 (1.81%) Hyper-V
5 6 (0.72%) BitLocker
5 6 (0.72%) VMware ESXi
6 5 (0.60%) Virtual Machines
7 2 (0.24%) Virtual Desktop
8 1 (0.12%) EMC RecoverPoint
Systems Management
1 41 (4.95%) Kubernetes
2 38 (4.59%) Microsoft Intune
3 31 (3.74%) Terraform
4 24 (2.90%) RSA Archer
5 15 (1.81%) Ansible
6 10 (1.21%) CSIRT
6 10 (1.21%) SCCM
6 10 (1.21%) Single Sign-On
7 9 (1.09%) PaperCut
8 8 (0.97%) Nessus
8 8 (0.97%) QRadar
9 7 (0.85%) Jamf Pro
10 6 (0.72%) Computer Emergency Response Teams
10 6 (0.72%) Grafana
10 6 (0.72%) Prometheus
11 5 (0.60%) Autotask
12 4 (0.48%) HAProxy
12 4 (0.48%) Nagios
12 4 (0.48%) vCenter Server
13 3 (0.36%) Progress Chef
Vendors
1 218 (26.33%) Microsoft
2 83 (10.02%) SAP
3 42 (5.07%) Salesforce
4 38 (4.59%) Oracle
5 34 (4.11%) VMware
6 31 (3.74%) Splunk
7 24 (2.90%) Adobe
8 18 (2.17%) CrowdStrike
8 18 (2.17%) Fortinet
9 17 (2.05%) Dell
10 16 (1.93%) Cisco
10 16 (1.93%) Google
10 16 (1.93%) MuleSoft
10 16 (1.93%) ServiceNow
11 14 (1.69%) Ariba
11 14 (1.69%) Palo Alto
12 13 (1.57%) Sophos
13 12 (1.45%) Qualys
14 9 (1.09%) Dell KACE
15 8 (0.97%) Apple