Firewall Job Trends in London

Firewall
England > London

The table below provides summary statistics and salary benchmarking for jobs advertised in London requiring Firewall skills. It covers permanent job vacancies from the 6 months leading up to 27 November 2025, with comparisons to the same periods in the previous two years.

6 months to
27 Nov 2025
Same period 2024 Same period 2023
Rank 89 79 63
Rank change year-on-year -10 -16 +57
Permanent jobs citing Firewall 444 648 788
As % of all permanent jobs in London 3.39% 3.68% 4.27%
As % of the Communications & Networking category 28.66% 30.37% 33.56%
Number of salaries quoted 328 430 683
10th Percentile £32,000 £37,500 £36,400
25th Percentile £43,000 £51,250 £50,879
Median annual salary (50th Percentile) £65,000 £70,000 £65,000
Median % change year-on-year -7.14% +7.69% +2.36%
75th Percentile £85,000 £85,000 £85,000
90th Percentile £97,500 £95,000 £100,000
England median annual salary £46,000 £52,500 £52,500
% change year-on-year -12.38% - -

All Communications and Computer Networking Skills
London

Firewall falls under the Communications and Computer Networking category. For comparison with the information above, the following table provides summary statistics for all permanent job vacancies requiring communications or computer networking skills in London.

Permanent vacancies with a requirement for communications or computer networking skills 1,549 2,134 2,348
As % of all permanent jobs advertised in London 11.82% 12.13% 12.74%
Number of salaries quoted 878 1,209 1,920
10th Percentile £28,697 £36,251 £33,475
25th Percentile £36,750 £47,500 £45,594
Median annual salary (50th Percentile) £60,000 £65,000 £65,000
Median % change year-on-year -7.69% - +4.00%
75th Percentile £85,000 £82,500 £82,500
90th Percentile £106,250 £100,000 £100,000
England median annual salary £40,000 £53,445 £51,500
% change year-on-year -25.16% +3.78% -1.90%

Firewall
Job Vacancy Trend in London

Historical trend showing the proportion of permanent IT job postings citing Firewall relative to all permanent IT jobs advertised in London.
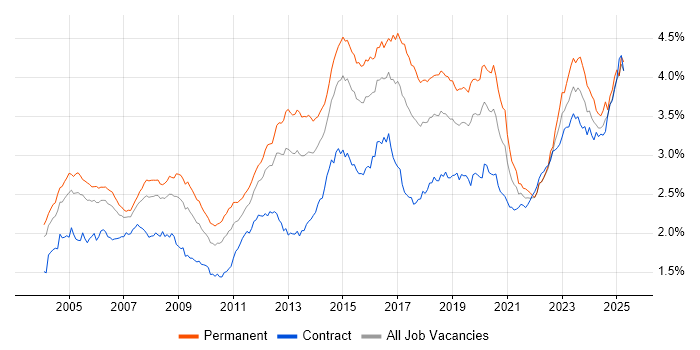
Firewall job vacancy trend in London

Firewall
Salary Trend in London

Salary distribution trend for jobs in London citing Firewall.

Salary distribution trend for jobs in London citing Firewall

Firewall
Salary Histogram in London

Salary distribution for jobs citing Firewall in London over the 6 months to 27 November 2025.

Salary histogram for Firewall in London

Firewall
Job Locations in London

The table below looks at the demand and provides a guide to the median salaries quoted in IT jobs citing Firewall within the London region over the 6 months to 27 November 2025. The 'Rank Change' column provides an indication of the change in demand within each location based on the same 6 month period last year.

Location Rank Change
on Same Period
Last Year
Matching
Permanent
IT Job Ads
Median Salary
Past 6 Months
Median Salary
% Change
on Same Period
Last Year
Live
Jobs
Central London -11 74 £70,000 -6.67% 34
East London +1 21 £34,500 -37.27% 2
West London +12 16 £50,000 -25.37% 7
South London +27 7 £46,000 -23.33% 5
North London +10 5 £75,000 +66.67% 1
Firewall
England

Firewall
Co-Occurring Skills & Capabilities in London by Category

The following tables expand on the one above by listing co-occurrences grouped by category. They cover the same employment type, locality and period, with up to 20 co-occurrences shown in each category:

Application Platforms
1 47 (10.59%) Microsoft Exchange
2 36 (8.11%) SharePoint
3 4 (0.90%) Moodle
4 3 (0.68%) Confluence
4 3 (0.68%) nginx
5 2 (0.45%) Apache Airflow
5 2 (0.45%) Skype for Business
6 1 (0.23%) Apache
6 1 (0.23%) IIS
Applications
1 16 (3.60%) MS Visio
2 12 (2.70%) Microsoft Office
3 3 (0.68%) Microsoft Project
4 2 (0.45%) AutoCAD
4 2 (0.45%) Microsoft Excel
4 2 (0.45%) Revit
5 1 (0.23%) Adobe Creative Suite
5 1 (0.23%) Microsoft PowerPoint
Business Applications
1 2 (0.45%) Fidessa
2 1 (0.23%) SAP S/4HANA
Cloud Services
1 227 (51.13%) Azure
2 118 (26.58%) Microsoft 365
3 87 (19.59%) AWS
4 63 (14.19%) Entra ID
5 33 (7.43%) SaaS
6 26 (5.86%) IaaS
7 19 (4.28%) GCP
7 19 (4.28%) PaaS
8 17 (3.83%) GitHub
9 16 (3.60%) Azure Monitor
10 14 (3.15%) Azure Sentinel
11 13 (2.93%) Power Platform
12 11 (2.48%) Google Workspace
13 10 (2.25%) Azure DevOps
13 10 (2.25%) Azure ExpressRoute
14 9 (2.03%) Azure Logic Apps
15 8 (1.80%) Microsoft Purview
15 8 (1.80%) Mimecast
15 8 (1.80%) Power Automate
16 7 (1.58%) Azure Key Vault
Communications & Networking
1 136 (30.63%) VPN
2 119 (26.80%) LAN
2 119 (26.80%) WAN
3 100 (22.52%) Network Security
4 65 (14.64%) Wi-Fi
4 65 (14.64%) Wireless
5 64 (14.41%) TCP/IP
6 61 (13.74%) VLAN
7 56 (12.61%) DNS
8 55 (12.39%) BGP
9 52 (11.71%) OSPF
10 51 (11.49%) SD-WAN
11 45 (10.14%) DHCP
12 33 (7.43%) Intrusion Detection
13 32 (7.21%) VoIP
14 22 (4.95%) Cisco Wireless
15 20 (4.50%) Wireshark
16 19 (4.28%) Cisco ASA
17 18 (4.05%) Cisco Nexus
17 18 (4.05%) WLAN
Database & Business Intelligence
1 18 (4.05%) SQL Server
2 12 (2.70%) Power BI
3 7 (1.58%) MySQL
4 6 (1.35%) NoSQL
4 6 (1.35%) Relational Database
5 3 (0.68%) Azure SQL Database
5 3 (0.68%) Data Lake
5 3 (0.68%) InfluxDB
6 2 (0.45%) Metadata
6 2 (0.45%) MongoDB
6 2 (0.45%) PostgreSQL
7 1 (0.23%) Oracle Reports
Development Applications
1 11 (2.48%) Git
2 5 (1.13%) JIRA
3 4 (0.90%) TeamCity
4 3 (0.68%) GitLab
5 2 (0.45%) Jaeger
5 2 (0.45%) Jenkins
5 2 (0.45%) MLflow
5 2 (0.45%) Sonatype Nexus
6 1 (0.23%) Burp Suite
6 1 (0.23%) SonarQube
General
1 137 (30.86%) Social Skills
2 118 (26.58%) Finance
3 39 (8.78%) Analytical Skills
4 29 (6.53%) Banking
5 26 (5.86%) Telecoms
6 21 (4.73%) Documentation Skills
7 18 (4.05%) Law
8 13 (2.93%) Financial Institution
8 13 (2.93%) Inclusion and Diversity
9 12 (2.70%) Marketing
10 9 (2.03%) Legal
11 7 (1.58%) Japanese Language
11 7 (1.58%) Manufacturing
11 7 (1.58%) Public Sector
11 7 (1.58%) Retail
12 6 (1.35%) Organisational Skills
13 4 (0.90%) Advertising
13 4 (0.90%) Back Office
13 4 (0.90%) Billing
13 4 (0.90%) Influencing Skills
Job Titles
1 103 (23.20%) Network Engineer
2 69 (15.54%) Analyst
2 69 (15.54%) Senior
3 61 (13.74%) Infrastructure Engineer
4 51 (11.49%) Support Engineer
5 45 (10.14%) IT Support
6 33 (7.43%) Support Analyst
7 32 (7.21%) Security Engineer
8 30 (6.76%) IT Engineer
9 27 (6.08%) IT Analyst
10 25 (5.63%) Lead
10 25 (5.63%) Security Analyst
11 22 (4.95%) Cisco Engineer
11 22 (4.95%) Senior Network Engineer
12 20 (4.50%) IT Support Engineer
13 19 (4.28%) Cloud Engineer
14 18 (4.05%) Azure Engineer
15 17 (3.83%) Network Support
16 16 (3.60%) IT Support Analyst
17 15 (3.38%) Senior Infrastructure Engineer
Libraries, Frameworks & Software Standards
1 9 (2.03%) 802.1X
2 7 (1.58%) .NET
3 5 (1.13%) RESTful
4 4 (0.90%) YAML
5 3 (0.68%) ADO
5 3 (0.68%) Elastic Stack
5 3 (0.68%) Microsoft Graph
5 3 (0.68%) OAuth
5 3 (0.68%) REST
5 3 (0.68%) SAML
6 2 (0.45%) AWS SAM
6 2 (0.45%) FastAPI
6 2 (0.45%) FIX Protocol
6 2 (0.45%) Kafka
6 2 (0.45%) Keycloak
6 2 (0.45%) LDAP
6 2 (0.45%) WebRTC
7 1 (0.23%) EDI
7 1 (0.23%) Oracle Fusion
7 1 (0.23%) WSH
Miscellaneous
1 61 (13.74%) Data Centre
2 37 (8.33%) Management Information System
3 27 (6.08%) Hybrid Cloud
4 20 (4.50%) Self-Motivation
5 19 (4.28%) Cyber Threat
6 18 (4.05%) Cloud Native
6 18 (4.05%) Driving Licence
6 18 (4.05%) Onboarding
7 14 (3.15%) Public Cloud
8 13 (2.93%) Enterprise Software
8 13 (2.93%) Security Posture
9 11 (2.48%) PKI
10 9 (2.03%) Video Conferencing
11 8 (1.80%) Virtual Team
12 7 (1.58%) CCTV
12 7 (1.58%) IoT
12 7 (1.58%) Private Cloud
12 7 (1.58%) Security Operations Centre
12 7 (1.58%) Social Media
13 6 (1.35%) Blog
Operating Systems
1 158 (35.59%) Windows
2 86 (19.37%) Linux
3 80 (18.02%) Windows Server
4 17 (3.83%) Unix
5 16 (3.60%) VMS
5 16 (3.60%) Windows 10
6 15 (3.38%) Windows Server 2019
7 14 (3.15%) Mac OS
8 13 (2.93%) Red Hat Enterprise Linux
9 10 (2.25%) Ubuntu
9 10 (2.25%) Windows Server 2016
10 8 (1.80%) CentOS
11 4 (0.90%) Android
11 4 (0.90%) Mac OS X
12 2 (0.45%) Apple iOS
12 2 (0.45%) Debian
12 2 (0.45%) Kali Linux
12 2 (0.45%) Solaris
13 1 (0.23%) Windows Server 2012
Processes & Methodologies
1 97 (21.85%) Cybersecurity
2 91 (20.50%) Problem-Solving
3 86 (19.37%) Incident Response
4 72 (16.22%) Infrastructure Engineering
5 70 (15.77%) SIEM
6 65 (14.64%) Infrastructure as Code
7 58 (13.06%) Disaster Recovery
8 51 (11.49%) ITIL
9 50 (11.26%) Computer Science
10 49 (11.04%) DevOps
10 49 (11.04%) Information Security
11 47 (10.59%) Migration
12 42 (9.46%) Cloud Security
13 41 (9.23%) Load Balancing
13 41 (9.23%) Network Monitoring
13 41 (9.23%) Security Operations
14 39 (8.78%) Customer Service
15 35 (7.88%) Continuous Improvement
16 34 (7.66%) Change Management
16 34 (7.66%) High Availability
Programming Languages
1 91 (20.50%) PowerShell
2 90 (20.27%) Python
3 32 (7.21%) Bash
4 23 (5.18%) SQL
5 10 (2.25%) Bicep
6 7 (1.58%) Go
7 5 (1.13%) Kusto Query Language
8 4 (0.90%) Java
8 4 (0.90%) Shell Script
9 3 (0.68%) JavaScript
10 1 (0.23%) C#
10 1 (0.23%) C++
10 1 (0.23%) Perl
10 1 (0.23%) R
10 1 (0.23%) Rust
10 1 (0.23%) VB.NET
10 1 (0.23%) VBScript
Qualifications
1 91 (20.50%) Degree
2 90 (20.27%) Cisco Certification
3 66 (14.86%) CCNP
4 45 (10.14%) CISSP
5 40 (9.01%) CCNA
6 38 (8.56%) CCIE
7 30 (6.76%) Azure Certification
8 25 (5.63%) CISM
8 25 (5.63%) Computer Science Degree
9 22 (4.95%) AWS Certification
10 21 (4.73%) Security Cleared
11 17 (3.83%) Microsoft Certification
12 15 (3.38%) Network+ Certification
12 15 (3.38%) SC Cleared
13 13 (2.93%) DBS Check
14 12 (2.70%) HND
15 11 (2.48%) CompTIA Security+
16 10 (2.25%) MCP
17 9 (2.03%) CCSE
17 9 (2.03%) CEH
Quality Assurance & Compliance
1 68 (15.32%) ISO/IEC 27001
2 50 (11.26%) NIST
3 45 (10.14%) GDPR
4 21 (4.73%) Cyber Essentials
5 11 (2.48%) PCI DSS
6 9 (2.03%) SOC 2
7 7 (1.58%) QA
8 6 (1.35%) Cyber Essentials PLUS
8 6 (1.35%) PMO
9 4 (0.90%) GRC
9 4 (0.90%) SLA
10 3 (0.68%) ITGC
11 2 (0.45%) Accessibility
11 2 (0.45%) Basel III
11 2 (0.45%) ISO/IEC 27002 (supersedes ISO/IEC 17799)
11 2 (0.45%) MiFID
11 2 (0.45%) Sarbanes-Oxley
12 1 (0.23%) HIPAA
12 1 (0.23%) NIST 800
System Software
1 129 (29.05%) Active Directory
2 67 (15.09%) VMware Infrastructure
3 27 (6.08%) Hyper-V
4 18 (4.05%) vSphere
5 15 (3.38%) Virtual Machines
6 11 (2.48%) Virtual Desktop
7 10 (2.25%) Docker
7 10 (2.25%) NFS
8 9 (2.03%) Firmware
9 8 (1.80%) VMware ESXi
10 7 (1.58%) ProxySG
11 5 (1.13%) KVM
11 5 (1.13%) XenApp
11 5 (1.13%) XenDesktop
12 4 (0.90%) EMC RecoverPoint
12 4 (0.90%) pfSense
13 3 (0.68%) Virtual Servers
13 3 (0.68%) VMware NSX
14 2 (0.45%) Squid
15 1 (0.23%) VMware Server
Systems Management
1 64 (14.41%) Terraform
2 52 (11.71%) Ansible
3 48 (10.81%) Microsoft Intune
4 36 (8.11%) Kubernetes
5 22 (4.95%) FortiGate
6 20 (4.50%) SCCM
7 16 (3.60%) Autotask
8 15 (3.38%) Grafana
9 13 (2.93%) Single Sign-On
10 11 (2.48%) Prometheus
11 8 (1.80%) CASB
11 8 (1.80%) CSIRT
11 8 (1.80%) Nessus
12 6 (1.35%) QRadar
13 5 (1.13%) Computer Emergency Response Teams
13 5 (1.13%) SCOM
14 4 (0.90%) Cilium
14 4 (0.90%) vCenter Server
14 4 (0.90%) VxRail
15 3 (0.68%) Proxmox
Vendors
1 159 (35.81%) Microsoft
2 157 (35.36%) Cisco
3 93 (20.95%) VMware
4 69 (15.54%) Palo Alto
5 49 (11.04%) CheckPoint
6 46 (10.36%) Fortinet
7 44 (9.91%) SolarWinds
8 40 (9.01%) Meraki
9 32 (7.21%) Juniper
10 28 (6.31%) F5
11 17 (3.83%) Zscaler
12 16 (3.60%) Arista
12 16 (3.60%) Splunk
13 15 (3.38%) Google
13 15 (3.38%) Red Hat
14 13 (2.93%) Citrix
15 11 (2.48%) Aruba
16 10 (2.25%) Commvault
17 9 (2.03%) Pure Storage
18 8 (1.80%) CrowdStrike