GDPR Jobs in London

General Data Protection Regulation EU 2016/679 (GDPR)
England > London

The table below provides summary statistics for permanent job vacancies advertised in London requiring GDPR skills. It includes a benchmarking guide to the annual salaries offered in vacancies that cited GDPR over the 6 months leading up to 26 July 2024, comparing them to the same period in the previous two years.

6 months to
26 Jul 2024
Same period 2023 Same period 2022
Rank 245 271 335
Rank change year-on-year +26 +64 -82
Permanent jobs citing GDPR 259 344 946
As % of all permanent jobs advertised in London 1.25% 1.27% 1.26%
As % of the Quality Assurance & Compliance category 8.54% 8.34% 7.62%
Number of salaries quoted 189 242 576
10th Percentile £33,125 £40,125 £35,625
25th Percentile £41,250 £50,957 £51,250
Median annual salary (50th Percentile) £58,500 £63,146 £62,500
Median % change year-on-year -7.36% +1.03% -3.85%
75th Percentile £81,250 £84,000 £82,500
90th Percentile £95,000 £97,500 £97,500
England median annual salary £50,000 £57,000 £57,500
% change year-on-year -12.28% -0.87% +4.55%

All Quality Assurance and Compliance Skills
London

GDPR falls under the Quality Assurance and Compliance category. For comparison with the information above, the following table provides summary statistics for all permanent job vacancies requiring quality assurance or compliance skills in London.

Permanent vacancies with a requirement for quality assurance or compliance skills 3,034 4,127 12,415
As % of all permanent jobs advertised in London 14.63% 15.22% 16.55%
Number of salaries quoted 2,028 3,111 5,563
10th Percentile £41,250 £40,000 £37,500
25th Percentile £52,500 £51,250 £50,000
Median annual salary (50th Percentile) £70,000 £67,500 £65,000
Median % change year-on-year +3.70% +3.85% -
75th Percentile £95,000 £85,000 £85,000
90th Percentile £120,000 £101,250 £100,000
England median annual salary £55,000 £58,000 £55,000
% change year-on-year -5.17% +5.45% -

GDPR
Job Vacancy Trend in London

Job postings citing GDPR as a proportion of all IT jobs advertised in London.
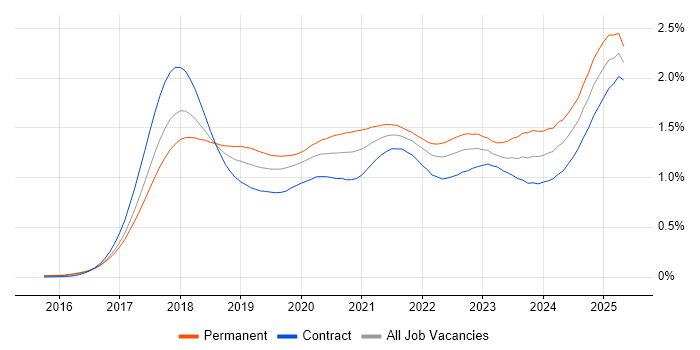
Job vacancy trend for GDPR in London

GDPR
Salary Trend in London

3-month moving average salary quoted in jobs citing GDPR in London.

Salary trend for GDPR in London

GDPR
Salary Histogram in London

Salary distribution for jobs citing GDPR in London over the 6 months to 26 July 2024.

Salary histogram for GDPR in London

GDPR
Job Locations in London

The table below looks at the demand and provides a guide to the median salaries quoted in IT jobs citing GDPR within the London region over the 6 months to 26 July 2024. The 'Rank Change' column provides an indication of the change in demand within each location based on the same 6 month period last year.

Location Rank Change
on Same Period
Last Year
Matching
Permanent
IT Job Ads
Median Salary
Past 6 Months
Median Salary
% Change
on Same Period
Last Year
Live
Jobs
West London +8 29 £46,000 -27.15% 10
Central London +19 26 £65,000 -16.13% 23
South London -11 17 £61,250 +11.36% 8
East London +22 1 £46,000 -29.88% 10
GDPR
England

GDPR
Co-occurring Skills and Capabilities in London by Category

The follow tables expand on the table above by listing co-occurrences grouped by category. The same employment type, locality and period is covered with up to 20 co-occurrences shown in each of the following categories:

Application Platforms
1 12 (4.63%) SharePoint
2 5 (1.93%) CMS
2 5 (1.93%) Confluence
3 4 (1.54%) Adobe Experience Manager
3 4 (1.54%) Apache Solr
3 4 (1.54%) Sitecore CMS
3 4 (1.54%) Umbraco
3 4 (1.54%) WordPress
4 3 (1.16%) Microsoft Exchange
4 3 (1.16%) Tomcat
5 1 (0.39%) IIS
5 1 (0.39%) SAS
Applications
1 16 (6.18%) Microsoft Office
2 13 (5.02%) Microsoft Excel
3 1 (0.39%) AutoCAD
3 1 (0.39%) Microsoft PowerPoint
3 1 (0.39%) Revit
Business Applications
1 10 (3.86%) Dynamics CRM
2 3 (1.16%) Raiser’s Edge
3 1 (0.39%) Adobe Campaign
3 1 (0.39%) Carpe Diem
3 1 (0.39%) Elite 3E
3 1 (0.39%) Exchequer
3 1 (0.39%) Sparx Enterprise Architect
Cloud Services
1 46 (17.76%) Azure
2 29 (11.20%) Power Platform
3 24 (9.27%) Microsoft 365
4 23 (8.88%) AWS
5 21 (8.11%) GCP
6 9 (3.47%) SaaS
7 7 (2.70%) Azure DevOps
8 6 (2.32%) Azure Synapse Analytics
8 6 (2.32%) Cloud Computing
8 6 (2.32%) PaaS
9 5 (1.93%) Azure Data Factory
9 5 (1.93%) Google Workspace
9 5 (1.93%) IaaS
9 5 (1.93%) WhatsApp
10 4 (1.54%) Azure Cognitive Search
10 4 (1.54%) Azure Monitor
10 4 (1.54%) Dynamics 365
11 3 (1.16%) Azure Key Vault
11 3 (1.16%) GitHub Actions
11 3 (1.16%) Microsoft Purview
Communications & Networking
1 31 (11.97%) Firewall
2 12 (4.63%) Intrusion Detection
2 12 (4.63%) Network Security
3 9 (3.47%) VPN
4 8 (3.09%) Structured Cabling
5 7 (2.70%) SD-WAN
6 6 (2.32%) Cisco ASA
6 6 (2.32%) Cisco Firepower
6 6 (2.32%) Cisco ISE
7 5 (1.93%) DNS
7 5 (1.93%) Internet
8 3 (1.16%) Wi-Fi
9 2 (0.77%) Cisco IOS
9 2 (0.77%) Intranet
9 2 (0.77%) Wireless
10 1 (0.39%) Ethernet
10 1 (0.39%) PSTN
10 1 (0.39%) TCP/IP
10 1 (0.39%) Unified Communications
10 1 (0.39%) WAN
Database & Business Intelligence
1 29 (11.20%) Power BI
2 18 (6.95%) Looker
3 16 (6.18%) SQL Server
4 15 (5.79%) BigQuery
5 12 (4.63%) Data Warehouse
6 7 (2.70%) Relational Database
6 7 (2.70%) Tableau
7 6 (2.32%) Data Lake
7 6 (2.32%) NoSQL
7 6 (2.32%) SAP HANA
8 4 (1.54%) HDInsight
8 4 (1.54%) MySQL
8 4 (1.54%) QlikView
9 3 (1.16%) MongoDB
10 2 (0.77%) RDBMS
11 1 (0.39%) Azure SQL Database
11 1 (0.39%) Big Data
11 1 (0.39%) Metadata
11 1 (0.39%) SQL Server Integration Services
11 1 (0.39%) SQL Server Reporting Services
Development Applications
1 14 (5.41%) JIRA
2 8 (3.09%) Jenkins
3 7 (2.70%) Git
4 1 (0.39%) CircleCI
4 1 (0.39%) GitLab
4 1 (0.39%) Selenium
4 1 (0.39%) Team Foundation Server
4 1 (0.39%) Visual Studio
General
1 110 (42.47%) Social Skills
2 67 (25.87%) Finance
3 57 (22.01%) Analytical Skills
4 50 (19.31%) Legal
5 20 (7.72%) Law
6 18 (6.95%) Marketing
7 16 (6.18%) Presentation Skills
8 15 (5.79%) Retail
9 14 (5.41%) Banking
10 12 (4.63%) Inclusion and Diversity
11 11 (4.25%) Organisational Skills
12 7 (2.70%) Pharmaceutical
12 7 (2.70%) Public Sector
13 6 (2.32%) Influencing Skills
14 5 (1.93%) Financial Institution
15 4 (1.54%) Advertising
15 4 (1.54%) Documentation Skills
15 4 (1.54%) Local Government
15 4 (1.54%) Telecoms
16 3 (1.16%) Billing
Job Titles
1 44 (16.99%) Senior
2 40 (15.44%) Analyst
3 24 (9.27%) Data Manager
4 21 (8.11%) IT Manager
5 18 (6.95%) Security Manager
6 16 (6.18%) Lead
7 12 (4.63%) Consultant
8 11 (4.25%) Data Engineer
8 11 (4.25%) Information Manager
8 11 (4.25%) Information Security Manager
8 11 (4.25%) Security Analyst
9 10 (3.86%) Architect
9 10 (3.86%) Azure Engineer
9 10 (3.86%) Principal Engineer
9 10 (3.86%) Senior Analyst
10 9 (3.47%) Data Analyst
10 9 (3.47%) Platform Engineer
10 9 (3.47%) Principal Data Engineer
10 9 (3.47%) Security Consultant
10 9 (3.47%) Service Manager
Libraries, Frameworks & Software Standards
1 7 (2.70%) XML
2 6 (2.32%) ARM Templates
3 5 (1.93%) React
4 4 (1.54%) Lucene
4 4 (1.54%) Web Services
4 4 (1.54%) YAML
5 3 (1.16%) Ajax
5 3 (1.16%) CSS
5 3 (1.16%) Hibernate
5 3 (1.16%) HTML
5 3 (1.16%) Java EE
5 3 (1.16%) JDBC
5 3 (1.16%) JPA
5 3 (1.16%) jQuery
5 3 (1.16%) JSP
5 3 (1.16%) Loki
5 3 (1.16%) RESTful
5 3 (1.16%) SOAP
5 3 (1.16%) Spring
5 3 (1.16%) Spring Boot
Miscellaneous
1 32 (12.36%) Management Information System
2 30 (11.58%) Self-Motivation
3 25 (9.65%) Security Posture
4 12 (4.63%) Data Protection Act
5 10 (3.86%) Product Ownership
6 8 (3.09%) Data Centre
6 8 (3.09%) Linux Command Line
7 7 (2.70%) Cyber Threat
8 6 (2.32%) Mobile App
9 5 (1.93%) Distributed Systems
9 5 (1.93%) Freedom of Information
10 4 (1.54%) Legacy Systems
10 4 (1.54%) NHS
11 3 (1.16%) Cyber Security Posture
11 3 (1.16%) Marketing Technology
11 3 (1.16%) Onboarding
12 2 (0.77%) Data Structures
12 2 (0.77%) Educational Technology
12 2 (0.77%) IoT
12 2 (0.77%) Video Conferencing
Operating Systems
1 32 (12.36%) Windows
2 12 (4.63%) Windows Server
3 11 (4.25%) Linux
4 4 (1.54%) Red Hat Enterprise Linux
5 3 (1.16%) Apple iOS
5 3 (1.16%) Windows Server 2019
6 2 (0.77%) Android
7 1 (0.39%) Mac OS
7 1 (0.39%) Mac OS X
7 1 (0.39%) Unix
7 1 (0.39%) Windows Server 2008
7 1 (0.39%) Windows Server 2012
7 1 (0.39%) Windows Server 2016
Processes & Methodologies
1 82 (31.66%) Data Protection
2 76 (29.34%) Problem-Solving
3 69 (26.64%) Information Security
4 48 (18.53%) Cybersecurity
5 45 (17.37%) Data Management
6 40 (15.44%) Risk Management
7 37 (14.29%) Agile
8 34 (13.13%) Data Privacy
9 33 (12.74%) Data Governance
10 31 (11.97%) Computer Science
11 29 (11.20%) Mentoring
11 29 (11.20%) Project Management
12 26 (10.04%) CRM
12 26 (10.04%) DevOps
12 26 (10.04%) Migration
13 25 (9.65%) Business Intelligence
14 24 (9.27%) Roadmaps
15 22 (8.49%) Analytics
16 19 (7.34%) Customer Service
17 18 (6.95%) Data Engineering
Programming Languages
1 18 (6.95%) SQL
2 14 (5.41%) Python
3 13 (5.02%) PowerShell
4 6 (2.32%) Java
5 5 (1.93%) JavaScript
6 4 (1.54%) C#
7 3 (1.16%) C++
8 2 (0.77%) Bash
8 2 (0.77%) R
9 1 (0.39%) Go
9 1 (0.39%) Scala
9 1 (0.39%) VB
9 1 (0.39%) VBScript
Qualifications
1 60 (23.17%) Degree
2 44 (16.99%) CISSP
3 32 (12.36%) CISM
4 25 (9.65%) Security Cleared
5 17 (6.56%) CISA
6 14 (5.41%) Computer Science Degree
6 14 (5.41%) SC Cleared
7 12 (4.63%) DBS Check
8 10 (3.86%) Cisco Certification
9 9 (3.47%) Azure Certification
10 8 (3.09%) GIAC
11 7 (2.70%) AWS Certification
11 7 (2.70%) GSEC
11 7 (2.70%) Master's Degree
11 7 (2.70%) Postgraduate
12 6 (2.32%) CCIE
12 6 (2.32%) CCNP
12 6 (2.32%) CCSA
12 6 (2.32%) CCSE
12 6 (2.32%) CRISC
Quality Assurance & Compliance
1 63 (24.32%) ISO/IEC 27001
2 28 (10.81%) NIST
3 20 (7.72%) Data Quality
4 19 (7.34%) California Consumer Privacy Act
4 19 (7.34%) HIPAA
5 17 (6.56%) GRC
6 16 (6.18%) Cyber Essentials
6 16 (6.18%) PCI DSS
7 10 (3.86%) SOC 2
8 9 (3.47%) COBIT
9 7 (2.70%) QA
9 7 (2.70%) SLA
10 5 (1.93%) Sarbanes-Oxley
11 4 (1.54%) Accessibility
11 4 (1.54%) NCSC
12 3 (1.16%) Cyber Essentials PLUS
13 2 (0.77%) GLBA
13 2 (0.77%) IASME
13 2 (0.77%) IEC 62304
13 2 (0.77%) ISO 13485
System Software
1 10 (3.86%) Docker
2 8 (3.09%) VMware Infrastructure
3 6 (2.32%) Active Directory
3 6 (2.32%) VMware NSX
4 5 (1.93%) Hyper-V
4 5 (1.93%) Virtual Machines
5 3 (1.16%) Embedded Firmware
5 3 (1.16%) Firmware
Systems Management
1 12 (4.63%) Kubernetes
2 9 (3.47%) Terraform
3 4 (1.54%) Ansible
3 4 (1.54%) CASB
3 4 (1.54%) Microsoft Intune
3 4 (1.54%) Progress Chef
4 3 (1.16%) Grafana
4 3 (1.16%) Jamf Pro
4 3 (1.16%) Prometheus
5 2 (0.77%) PaperCut
6 1 (0.39%) FortiGate
6 1 (0.39%) Puppet
6 1 (0.39%) RSA Archer
Vendors
1 54 (20.85%) Microsoft
2 24 (9.27%) Google
3 13 (5.02%) VMware
4 10 (3.86%) CheckPoint
4 10 (3.86%) Cisco
5 8 (3.09%) Adobe
5 8 (3.09%) SAP
6 6 (2.32%) Aruba
6 6 (2.32%) Databricks
6 6 (2.32%) F5
6 6 (2.32%) Fortinet
6 6 (2.32%) Juniper
6 6 (2.32%) Palo Alto
7 5 (1.93%) Apple
8 4 (1.54%) Marketo
8 4 (1.54%) ServiceNow
8 4 (1.54%) Sitecore
9 3 (1.16%) Citrix
9 3 (1.16%) Salesforce
10 2 (0.77%) Oracle