Security Cleared Jobs in London

Security Clearance
England > London

The table below provides summary statistics for permanent job vacancies advertised in London with a requirement for Security Cleared qualifications. It includes a benchmarking guide to the salaries offered over the 6 months leading up to 12 July 2025, comparing them to the same period in the previous two years.

6 months to
12 Jul 2025
Same period 2024 Same period 2023
Rank 86 59 50
Rank change year-on-year -27 -9 +163
Permanent jobs citing Security Cleared 520 1,053 1,536
As % of all permanent jobs advertised in London 3.93% 4.49% 5.29%
As % of the Qualifications category 12.38% 16.29% 20.27%
Number of salaries quoted 346 655 914
10th Percentile £42,500 £41,681 £45,000
25th Percentile £51,563 £52,500 £52,500
Median annual salary (50th Percentile) £65,000 £70,000 £65,000
Median % change year-on-year -7.14% +7.69% -
75th Percentile £80,188 £83,750 £82,500
90th Percentile £95,000 £95,000 £97,500
England median annual salary £62,500 £57,500 £60,000
% change year-on-year +8.70% -4.17% +9.09%

All Academic and Professional Certifications
London

Security Cleared falls under the Academic Qualifications and Professional Certifications category. For comparison with the information above, the following table provides summary statistics for all permanent job vacancies requiring academic qualifications or professional certifications in London.

Permanent vacancies requiring academic qualifications or professional certifications 4,202 6,464 7,578
As % of all permanent jobs advertised in London 31.72% 27.57% 26.09%
Number of salaries quoted 1,974 3,818 5,193
10th Percentile £40,932 £35,714 £38,750
25th Percentile £52,000 £47,500 £51,250
Median annual salary (50th Percentile) £67,500 £65,000 £67,500
Median % change year-on-year +3.85% -3.70% +3.85%
75th Percentile £90,000 £85,000 £88,750
90th Percentile £110,000 £100,000 £112,500
England median annual salary £55,000 £54,043 £60,000
% change year-on-year +1.77% -9.93% +9.09%

Security Cleared
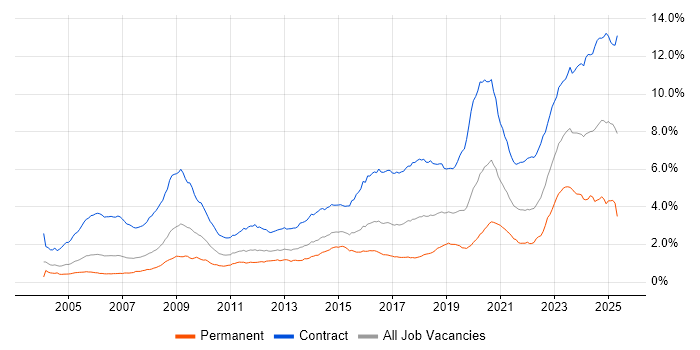
Job Vacancy Trend in London

Job postings citing Security Cleared as a proportion of all IT jobs advertised in London.

Job vacancy trend for Security Cleared in London

Security Cleared
Salary Trend in London

3-month moving average salary quoted in jobs citing Security Cleared in London.

Salary trend for Security Cleared in London

Security Cleared
Salary Histogram in London

Salary distribution for jobs citing Security Cleared in London over the 6 months to 12 July 2025.

Salary histogram for Security Cleared in London

Security Cleared
Job Locations in London

The table below looks at the demand and provides a guide to the median salaries quoted in IT jobs citing Security Cleared within the London region over the 6 months to 12 July 2025. The 'Rank Change' column provides an indication of the change in demand within each location based on the same 6 month period last year.

Location Rank Change
on Same Period
Last Year
Matching
Permanent
IT Job Ads
Median Salary
Past 6 Months
Median Salary
% Change
on Same Period
Last Year
Live
Jobs
South London +18 70 £65,000 -14.75% 18
Central London -42 68 £65,000 +4.00% 79
West London +24 10 £36,250 -3.33% 51
East London -14 3 - - 17
North London -33 2 £66,250 +20.45% 5
Security Cleared
England

Security Cleared
Co-occurring Skills and Capabilities in London by Category

The follow tables expand on the table above by listing co-occurrences grouped by category. The same employment type, locality and period is covered with up to 20 co-occurrences shown in each of the following categories:

Application Platforms
1 12 (2.31%) JBoss
1 12 (2.31%) Red Hat Fuse
2 8 (1.54%) Apache Spark
2 8 (1.54%) SharePoint
3 6 (1.15%) Microsoft Exchange
4 5 (0.96%) BizTalk Server
5 4 (0.77%) Apache
6 3 (0.58%) CMS
6 3 (0.58%) Exchange Server 2010
6 3 (0.58%) Exchange Server 2013
6 3 (0.58%) Headless CMS
7 2 (0.38%) Confluence
7 2 (0.38%) WinCC
8 1 (0.19%) Alfresco
8 1 (0.19%) Camunda
8 1 (0.19%) Drupal
8 1 (0.19%) WordPress
Applications
1 14 (2.69%) Adobe XD
2 7 (1.35%) InVision
2 7 (1.35%) Sketch
3 4 (0.77%) Microsoft Office
3 4 (0.77%) Microsoft Project
3 4 (0.77%) Mozilla Thunderbird
4 3 (0.58%) MS Visio
5 2 (0.38%) Oracle Smart View
6 1 (0.19%) Chatbot
6 1 (0.19%) Microsoft Excel
6 1 (0.19%) Microsoft PowerPoint
6 1 (0.19%) Simulink
Business Applications
1 13 (2.50%) SAP S/4HANA
2 5 (0.96%) Dynamics CRM
2 5 (0.96%) Maximo
3 4 (0.77%) SAP SCM
4 3 (0.58%) Primavera
4 3 (0.58%) SAP EWM
4 3 (0.58%) SAP PP
4 3 (0.58%) Sparx Enterprise Architect
5 2 (0.38%) Oracle ERP
5 2 (0.38%) Oracle Financials
5 2 (0.38%) SAP APO
5 2 (0.38%) SAP CO
5 2 (0.38%) SAP FI
5 2 (0.38%) SAP FI/CO
5 2 (0.38%) SAP LE
5 2 (0.38%) SAP QM
6 1 (0.19%) Dynamics AX
6 1 (0.19%) Remedy ITSM
6 1 (0.19%) SAP BPC
6 1 (0.19%) SAP GRC
Cloud Services
1 147 (28.27%) AWS
2 143 (27.50%) Azure
3 59 (11.35%) Serverless
4 44 (8.46%) Azure DevOps
5 40 (7.69%) Amazon EKS
6 39 (7.50%) Power Platform
7 33 (6.35%) Amazon ECS
7 33 (6.35%) AWS CloudFormation
8 29 (5.58%) GCP
9 26 (5.00%) Azure Data Factory
10 22 (4.23%) Dynamics 365
11 20 (3.85%) Azure Monitor
12 19 (3.65%) AWS KMS
12 19 (3.65%) Azure Synapse Analytics
13 17 (3.27%) AWS Lambda
13 17 (3.27%) Figma
13 17 (3.27%) SaaS
14 16 (3.08%) Azure App Service
14 16 (3.08%) Microsoft 365
15 13 (2.50%) Azure Functions
Communications & Networking
1 19 (3.65%) Firewall
2 14 (2.69%) Network Security
3 13 (2.50%) TCP/IP
4 9 (1.73%) Link 16
4 9 (1.73%) Tactical Data Link
5 8 (1.54%) VLAN
6 7 (1.35%) RS-232
6 7 (1.35%) RS-485
7 6 (1.15%) SSL
8 5 (0.96%) Intranet
8 5 (0.96%) VPN
9 4 (0.77%) Ethernet
9 4 (0.77%) LAN
10 3 (0.58%) DNS
10 3 (0.58%) Internet
10 3 (0.58%) Intrusion Detection
10 3 (0.58%) Modbus
10 3 (0.58%) WAN
10 3 (0.58%) Wireless
11 2 (0.38%) Profibus
Database & Business Intelligence
1 42 (8.08%) PostgreSQL
2 30 (5.77%) Relational Database
3 26 (5.00%) Power BI
4 21 (4.04%) Elasticsearch
5 12 (2.31%) RDBMS
5 12 (2.31%) SQL Server
6 11 (2.12%) MongoDB
7 8 (1.54%) Data Warehouse
7 8 (1.54%) NoSQL
8 7 (1.35%) Big Data
9 6 (1.15%) Metadata
9 6 (1.15%) MySQL
10 5 (0.96%) Delta Lake
11 4 (0.77%) Amazon RDS
11 4 (0.77%) DB2
11 4 (0.77%) GIS
12 3 (0.58%) Data Lake
12 3 (0.58%) Redis
13 2 (0.38%) SAP HANA
13 2 (0.38%) Tableau
Development Applications
1 42 (8.08%) Jenkins
2 37 (7.12%) Git
3 25 (4.81%) JUnit
4 23 (4.42%) JMeter
5 13 (2.50%) Axure RP
5 13 (2.50%) JIRA
6 11 (2.12%) Mockito
6 11 (2.12%) Selenium
7 10 (1.92%) GitLab
8 8 (1.54%) Postman
9 7 (1.35%) Balsamiq
9 7 (1.35%) Cypress.io
10 6 (1.15%) Gatling
10 6 (1.15%) Locust
11 5 (0.96%) Robot Framework
12 4 (0.77%) Bitbucket Server
12 4 (0.77%) REST Assured
13 3 (0.58%) Maven
13 3 (0.58%) Storybook
13 3 (0.58%) TestRail
General
1 151 (29.04%) Public Sector
2 136 (26.15%) Social Skills
3 80 (15.38%) Finance
4 74 (14.23%) Inclusion and Diversity
5 64 (12.31%) Analytical Skills
6 57 (10.96%) Law
7 26 (5.00%) Telecoms
8 20 (3.85%) Military
9 14 (2.69%) Manufacturing
10 12 (2.31%) Marketing
11 11 (2.12%) Electronics
12 10 (1.92%) Retail
13 8 (1.54%) Influencing Skills
13 8 (1.54%) Presentation Skills
14 7 (1.35%) Pharmaceutical
15 6 (1.15%) Aviation
16 5 (0.96%) Aerospace
17 3 (0.58%) Fire and Rescue
17 3 (0.58%) Legal
17 3 (0.58%) Police
Job Titles
1 99 (19.04%) Developer
2 70 (13.46%) Architect
3 64 (12.31%) Senior
4 62 (11.92%) Consultant
5 38 (7.31%) Lead
6 36 (6.92%) Java Developer
7 30 (5.77%) Analyst
8 29 (5.58%) Data Engineer
9 25 (4.81%) Designer
10 24 (4.62%) DevOps Engineer
10 24 (4.62%) Solutions Architect
11 20 (3.85%) Azure Engineer
11 20 (3.85%) Service Designer
12 19 (3.65%) Cloud Architect
12 19 (3.65%) Software Developer
13 16 (3.08%) Project Manager
13 16 (3.08%) Systems Engineer
14 15 (2.88%) Senior Consultant
15 13 (2.50%) Azure Data Engineer
16 12 (2.31%) Senior Developer
Libraries, Frameworks & Software Standards
1 45 (8.65%) HTML
2 37 (7.12%) REST
2 37 (7.12%) Spring
3 35 (6.73%) CSS
4 34 (6.54%) Web Services
5 32 (6.15%) Spring Boot
6 30 (5.77%) RESTful
7 29 (5.58%) React
8 23 (4.42%) .NET
8 23 (4.42%) Apache Camel
9 22 (4.23%) PySpark
10 21 (4.04%) Node.js
11 20 (3.85%) AngularJS
12 17 (3.27%) Hibernate
12 17 (3.27%) Kafka
12 17 (3.27%) SOAP
13 15 (2.88%) Elastic Stack
14 13 (2.50%) ActiveMQ
15 12 (2.31%) J2EE
15 12 (2.31%) Pandas
Miscellaneous
1 28 (5.38%) Distributed Systems
2 27 (5.19%) Management Information System
3 26 (5.00%) Cyberattack
4 25 (4.81%) Cloud Native
5 21 (4.04%) Product Ownership
6 13 (2.50%) Data Centre
7 11 (2.12%) Hybrid Cloud
8 9 (1.73%) Cyber Defence
9 8 (1.54%) Cyber Threat
10 7 (1.35%) Freedom of Information
10 7 (1.35%) SCADA
11 6 (1.15%) NHS
11 6 (1.15%) Security Posture
11 6 (1.15%) Self-Motivation
12 5 (0.96%) Driving Licence
12 5 (0.96%) Enterprise Cloud
12 5 (0.96%) Virtual Team
13 4 (0.77%) IoT
13 4 (0.77%) Mobile App
13 4 (0.77%) Public Cloud
Operating Systems
1 53 (10.19%) Linux
2 27 (5.19%) Windows
3 17 (3.27%) Android
4 15 (2.88%) Windows Server
5 11 (2.12%) Unix
6 9 (1.73%) Red Hat Enterprise Linux
7 6 (1.15%) CentOS
8 5 (0.96%) HPUX
8 5 (0.96%) Solaris
8 5 (0.96%) Ubuntu
9 4 (0.77%) Oracle Linux
10 3 (0.58%) Apple iOS
10 3 (0.58%) Windows 7
10 3 (0.58%) Windows Server 2008
10 3 (0.58%) Windows Server 2012
11 2 (0.38%) VMS
11 2 (0.38%) Windows Server 2016
12 1 (0.19%) Debian
12 1 (0.19%) Windows 10
Processes & Methodologies
1 211 (40.58%) Agile
2 138 (26.54%) DevOps
3 107 (20.58%) CI/CD
4 94 (18.08%) Problem-Solving
5 93 (17.88%) Mentoring
6 59 (11.35%) Scrum
7 55 (10.58%) Continuous Improvement
8 53 (10.19%) Software Engineering
9 52 (10.00%) Microservices
10 44 (8.46%) Analytics
11 41 (7.88%) Stakeholder Management
12 40 (7.69%) Project Delivery
13 39 (7.50%) Kanban
14 37 (7.12%) Containerisation
14 37 (7.12%) Design Patterns
15 36 (6.92%) Coaching
15 36 (6.92%) Collaborative Working
15 36 (6.92%) Project Management
16 34 (6.54%) Cybersecurity
17 33 (6.35%) Computer Science
Programming Languages
1 118 (22.69%) Python
2 99 (19.04%) Java
3 85 (16.35%) JavaScript
4 76 (14.62%) SQL
5 30 (5.77%) C#
6 25 (4.81%) TypeScript
7 23 (4.42%) Go
8 21 (4.04%) C++
9 20 (3.85%) Shell Script
10 18 (3.46%) PowerShell
10 18 (3.46%) R
11 13 (2.50%) Rust
12 12 (2.31%) Bash
12 12 (2.31%) Kusto Query Language
13 11 (2.12%) C
14 9 (1.73%) Scala
15 7 (1.35%) Ruby
16 4 (0.77%) ABAP
16 4 (0.77%) Apex Code
16 4 (0.77%) SPARQL
Qualifications
1 337 (64.81%) SC Cleared
2 98 (18.85%) DV Cleared
3 93 (17.88%) Degree
4 30 (5.77%) AWS Certification
5 29 (5.58%) Computer Science Degree
6 28 (5.38%) Azure Certification
7 27 (5.19%) Microsoft Certification
8 16 (3.08%) BPSS Clearance
9 12 (2.31%) AWS Certified Solutions Architect
10 11 (2.12%) Cisco Certification
10 11 (2.12%) TOGAF Certification
11 10 (1.92%) CCNP
12 9 (1.73%) Master's Degree
12 9 (1.73%) SAP Certification
13 8 (1.54%) CCNA
13 8 (1.54%) ISTQB
14 7 (1.35%) CompTIA Security+
14 7 (1.35%) GSEC
14 7 (1.35%) SSCP
15 6 (1.15%) APMG
Quality Assurance & Compliance
1 40 (7.69%) Accessibility
2 20 (3.85%) GDPR
2 20 (3.85%) ISO/IEC 27001
3 17 (3.27%) NIST
3 17 (3.27%) SLA
3 17 (3.27%) WCAG
4 15 (2.88%) Data Quality
5 13 (2.50%) HIPAA
6 11 (2.12%) PMBOK
6 11 (2.12%) QA
7 7 (1.35%) MIL-STD-1553
7 7 (1.35%) NCSC
8 5 (0.96%) PMO
9 3 (0.58%) GRC
9 3 (0.58%) PCI DSS
9 3 (0.58%) SOC 2
10 2 (0.38%) Cyber Essentials
10 2 (0.38%) NIST 800
10 2 (0.38%) P3O
11 1 (0.19%) JSP 440
System Software
1 98 (18.85%) Docker
2 23 (4.42%) Active Directory
3 6 (1.15%) VMware Infrastructure
4 5 (0.96%) Virtual Machines
5 4 (0.77%) Virtual Desktop
6 3 (0.58%) Hyper-V
7 2 (0.38%) VMware NSX
8 1 (0.19%) Apache ZooKeeper
8 1 (0.19%) IAG
Systems Management
1 93 (17.88%) Kubernetes
2 67 (12.88%) Terraform
3 43 (8.27%) Ansible
4 17 (3.27%) Grafana
5 15 (2.88%) Kibana
5 15 (2.88%) Prometheus
6 7 (1.35%) Nessus
7 4 (0.77%) Proxmox
8 3 (0.58%) Active Directory Federation Services
8 3 (0.58%) AWS Copilot
8 3 (0.58%) Functional Safety
8 3 (0.58%) Nagios
8 3 (0.58%) Puppet
9 2 (0.38%) Progress Chef
10 1 (0.19%) FortiGate
10 1 (0.19%) HP UCMDB
10 1 (0.19%) Istio
10 1 (0.19%) Microsoft Intune
10 1 (0.19%) Packer
10 1 (0.19%) Salt
Vendors
1 87 (16.73%) Microsoft
2 33 (6.35%) Splunk
3 29 (5.58%) Oracle
3 29 (5.58%) SAP
4 24 (4.62%) Google
5 17 (3.27%) VMware
6 16 (3.08%) Databricks
7 14 (2.69%) Adobe
8 13 (2.50%) Dynatrace
9 10 (1.92%) Salesforce
9 10 (1.92%) ServiceNow
10 9 (1.73%) Palantir
11 8 (1.54%) Juniper
12 6 (1.15%) Cisco
12 6 (1.15%) Siemens
13 5 (0.96%) MuleSoft
14 4 (0.77%) IBM
14 4 (0.77%) Red Hat
15 3 (0.58%) Citrix
15 3 (0.58%) Intel