Retail Jobs in London

Retailing
England > London

The table below looks at the prevalence of the term Retail in permanent job vacancies in London. Included is a benchmarking guide to the salaries offered in vacancies that cited Retail over the 6 months leading up to 23 October 2024, comparing them to the same period in the previous two years.

6 months to
23 Oct 2024
Same period 2023 Same period 2022
Rank 74 53 42
Rank change year-on-year -21 -11 +20
Permanent jobs citing Retail 750 1,023 4,154
As % of all permanent jobs advertised in London 3.99% 4.99% 7.28%
As % of the General category 5.71% 7.29% 10.20%
Number of salaries quoted 306 775 1,730
10th Percentile £36,875 £41,250 £40,000
25th Percentile £50,000 £52,500 £52,500
Median annual salary (50th Percentile) £65,000 £70,000 £70,000
Median % change year-on-year -7.14% - +3.70%
75th Percentile £88,438 £87,500 £88,750
90th Percentile £100,625 £97,500 £101,250
England median annual salary £50,000 £57,500 £60,000
% change year-on-year -13.04% -4.17% +4.35%

All General Skills
London

Retail falls under the General Skills category. For comparison with the information above, the following table provides summary statistics for all permanent job vacancies requiring common skills in London.

Permanent vacancies with a requirement for common skills 13,126 14,026 40,740
As % of all permanent jobs advertised in London 69.86% 68.36% 71.44%
Number of salaries quoted 7,135 10,860 23,007
10th Percentile £41,250 £40,000 £41,250
25th Percentile £55,000 £55,000 £53,125
Median annual salary (50th Percentile) £75,000 £75,000 £72,500
Median % change year-on-year - +3.45% +3.57%
75th Percentile £97,500 £95,000 £93,750
90th Percentile £122,500 £120,000 £115,000
England median annual salary £60,000 £60,000 £60,000
% change year-on-year - - +2.56%

Retail
Job Vacancy Trend in London

Job postings citing Retail as a proportion of all IT jobs advertised in London.
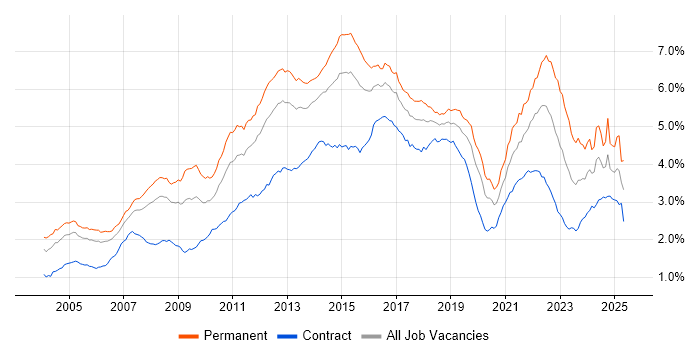
Job vacancy trend for Retail in London

Retail
Salary Trend in London

3-month moving average salary quoted in jobs citing Retail in London.

Salary trend for Retail in London

Retail
Salary Histogram in London

Salary distribution for jobs citing Retail in London over the 6 months to 23 October 2024.

Salary histogram for Retail in London

Retail
Job Locations in London

The table below looks at the demand and provides a guide to the median salaries quoted in IT jobs citing Retail within the London region over the 6 months to 23 October 2024. The 'Rank Change' column provides an indication of the change in demand within each location based on the same 6 month period last year.

Location Rank Change
on Same Period
Last Year
Matching
Permanent
IT Job Ads
Median Salary
Past 6 Months
Median Salary
% Change
on Same Period
Last Year
Live
Jobs
Central London +3 118 £63,750 -12.52% 61
South London +18 66 £50,000 -9.09% 11
West London -37 11 £75,000 +7.14% 31
North London -1 2 £37,500 -34.30% 4
East London +21 1 £87,500 +27.27% 12
Retail
England

Retail
Co-occurring Skills and Capabilities in London by Category

The follow tables expand on the table above by listing co-occurrences grouped by category. The same employment type, locality and period is covered with up to 20 co-occurrences shown in each of the following categories:

Application Platforms
1 21 (2.80%) Apache Spark
2 14 (1.87%) CMS
3 7 (0.93%) Confluence
4 5 (0.67%) SharePoint
5 4 (0.53%) Apache Airflow
6 3 (0.40%) Microsoft Exchange
6 3 (0.40%) WordPress
7 2 (0.27%) Drupal
7 2 (0.27%) Oracle Collaboration Suite
7 2 (0.27%) SAS
8 1 (0.13%) Adobe Experience Manager
8 1 (0.13%) OpenEdge
Applications
1 44 (5.87%) Microsoft Excel
2 33 (4.40%) Microsoft Office
3 12 (1.60%) Microsoft PowerPoint
4 3 (0.40%) CINEMA 4D
5 2 (0.27%) Adobe Premiere
5 2 (0.27%) Chatbot
6 1 (0.13%) Adobe After Effects
6 1 (0.13%) Adobe XD
6 1 (0.13%) CapCut
6 1 (0.13%) CPLEX
6 1 (0.13%) InVision
6 1 (0.13%) Photoshop
6 1 (0.13%) Sketch
Business Applications
1 18 (2.40%) Shopify
2 16 (2.13%) SAP S/4HANA
3 11 (1.47%) Endur
4 5 (0.67%) Magento
5 4 (0.53%) Oracle Retail
5 4 (0.53%) SAP PP
6 3 (0.40%) NetSuite
6 3 (0.40%) SAP Hybris
6 3 (0.40%) SAP SD
7 2 (0.27%) Dynamics CRM
7 2 (0.27%) Payment Gateway
7 2 (0.27%) SAP ERP
7 2 (0.27%) SAP Retail
8 1 (0.13%) Adobe Campaign
8 1 (0.13%) Dynamics NAV
8 1 (0.13%) SAP IBP
8 1 (0.13%) SAP Oil and Gas
8 1 (0.13%) SAP PLM
8 1 (0.13%) Workfront
Cloud Services
1 138 (18.40%) AWS
2 83 (11.07%) Azure
3 52 (6.93%) GCP
4 40 (5.33%) Power Platform
4 40 (5.33%) SaaS
5 25 (3.33%) Microsoft 365
6 18 (2.40%) Snowflake
7 15 (2.00%) Dynamics 365
8 13 (1.73%) Salesforce Commerce Cloud
9 12 (1.60%) Power Automate
9 12 (1.60%) PowerApps
10 10 (1.33%) Azure DevOps
11 9 (1.20%) BigCommerce
11 9 (1.20%) GitHub
12 8 (1.07%) Google Workspace
13 7 (0.93%) Azure Logic Apps
13 7 (0.93%) dbt
13 7 (0.93%) Figma
13 7 (0.93%) PaaS
13 7 (0.93%) Serverless
Communications & Networking
1 21 (2.80%) HTTP
2 16 (2.13%) Firewall
3 14 (1.87%) LAN
3 14 (1.87%) VPN
3 14 (1.87%) WAN
4 9 (1.20%) BGP
4 9 (1.20%) Network Security
5 8 (1.07%) Internet
6 7 (0.93%) DHCP
6 7 (0.93%) DNS
7 6 (0.80%) IPsec
7 6 (0.80%) Wireless
8 5 (0.67%) TCP/IP
8 5 (0.67%) Wi-Fi
9 3 (0.40%) MPLS
9 3 (0.40%) OSPF
9 3 (0.40%) SD-WAN
9 3 (0.40%) VLAN
10 2 (0.27%) WLAN
11 1 (0.13%) NGN
Database & Business Intelligence
1 74 (9.87%) Tableau
2 45 (6.00%) Data Warehouse
3 35 (4.67%) Power BI
4 11 (1.47%) SQL Server
5 8 (1.07%) Snowflake Schema
6 7 (0.93%) Big Data
7 6 (0.80%) BigQuery
7 6 (0.80%) Elasticsearch
7 6 (0.80%) Looker
8 5 (0.67%) MongoDB
9 4 (0.53%) Data Vault
9 4 (0.53%) GIS
9 4 (0.53%) SQL Server Integration Services
10 3 (0.40%) Azure SQL Database
10 3 (0.40%) Geospatial Data
10 3 (0.40%) Metadata
10 3 (0.40%) MySQL
10 3 (0.40%) NoSQL
10 3 (0.40%) QlikView
11 2 (0.27%) Hadoop
Development Applications
1 64 (8.53%) Git
2 10 (1.33%) JIRA
3 7 (0.93%) TeamCity
4 5 (0.67%) PowerBuilder
5 4 (0.53%) Terragrunt
6 3 (0.40%) Team Foundation Server
7 1 (0.13%) Axure RP
7 1 (0.13%) GitLab
7 1 (0.13%) Grunt
7 1 (0.13%) gulp
7 1 (0.13%) Jenkins
7 1 (0.13%) Octopus Deploy
7 1 (0.13%) Sonatype Nexus
7 1 (0.13%) Spinnaker
7 1 (0.13%) Visual Studio
7 1 (0.13%) Visual Studio Code
7 1 (0.13%) Visual Website Optimizer
7 1 (0.13%) webpack
General
1 309 (41.20%) Social Skills
2 236 (31.47%) Finance
3 158 (21.07%) Analytical Skills
4 144 (19.20%) Presentation Skills
5 109 (14.53%) Inclusion and Diversity
6 78 (10.40%) Marketing
7 76 (10.13%) Manufacturing
8 61 (8.13%) Banking
9 53 (7.07%) Organisational Skills
10 39 (5.20%) Advertising
11 30 (4.00%) Law
12 29 (3.87%) Games
13 22 (2.93%) Legal
14 21 (2.80%) Billing
15 19 (2.53%) Automotive
16 18 (2.40%) Publishing
17 15 (2.00%) Telecoms
18 13 (1.73%) Local Government
19 12 (1.60%) Public Sector
20 11 (1.47%) Influencing Skills
Job Titles
1 281 (37.47%) Senior
2 139 (18.53%) Analyst
3 108 (14.40%) Architect
4 83 (11.07%) Senior Manager
5 82 (10.93%) Senior Analyst
6 69 (9.20%) Data Analyst
7 67 (8.93%) Senior Data Analyst
8 60 (8.00%) Solutions Architect
9 46 (6.13%) Software Engineer
10 37 (4.93%) Consultant
11 35 (4.67%) Project Manager
11 35 (4.67%) Senior Architect
12 31 (4.13%) Technical Manager
13 30 (4.00%) Coordinator
13 30 (4.00%) Developer
13 30 (4.00%) Senior Software Engineer
14 29 (3.87%) Audit Manager
14 29 (3.87%) Development Manager
15 26 (3.47%) Business Manager
16 25 (3.33%) Delivery Manager
Libraries, Frameworks & Software Standards
1 23 (3.07%) Kafka
2 22 (2.93%) .NET
3 17 (2.27%) React
4 14 (1.87%) CSS
5 13 (1.73%) HTML
6 11 (1.47%) Node.js
7 8 (1.07%) MACH
7 8 (1.07%) Next.js
8 7 (0.93%) .NET Framework
8 7 (0.93%) RESTful
9 6 (0.80%) .NET Core
10 4 (0.53%) Entity Framework
10 4 (0.53%) PyTorch
10 4 (0.53%) TensorFlow
11 3 (0.40%) AngularJS
11 3 (0.40%) Pandas
11 3 (0.40%) REST
12 2 (0.27%) FastAPI
12 2 (0.27%) GraphQL
12 2 (0.27%) Keras
Miscellaneous
1 55 (7.33%) Driving Licence
2 32 (4.27%) FMCG
3 24 (3.20%) Distributed Systems
4 23 (3.07%) Blog
5 22 (2.93%) Cloud Native
6 21 (2.80%) Data Structures
6 21 (2.80%) Product Ownership
7 20 (2.67%) Virtual Team
8 19 (2.53%) Self-Motivation
9 16 (2.13%) Onboarding
10 15 (2.00%) Management Information System
11 14 (1.87%) Public Cloud
12 13 (1.73%) Data Centre
13 12 (1.60%) iPad
13 12 (1.60%) Social Media
14 8 (1.07%) Digital Media
15 7 (0.93%) Credit Risk
15 7 (0.93%) Renewable Energy
16 5 (0.67%) Cyber Threat
16 5 (0.67%) Legacy Systems
Operating Systems
1 22 (2.93%) Windows
2 16 (2.13%) Linux
3 9 (1.20%) Mac OS
4 7 (0.93%) Ubuntu
4 7 (0.93%) VMS
5 4 (0.53%) Windows Server
6 3 (0.40%) Red Hat Enterprise Linux
7 2 (0.27%) Android
7 2 (0.27%) Unix
8 1 (0.13%) Apple iOS
Processes & Methodologies
1 254 (33.87%) Problem-Solving
2 171 (22.80%) Agile
3 143 (19.07%) Analytics
4 93 (12.40%) Project Management
5 90 (12.00%) E-Commerce
5 90 (12.00%) Visualisation
6 89 (11.87%) Customer Experience
7 86 (11.47%) Business Strategy
7 86 (11.47%) Data Analysis
7 86 (11.47%) Stakeholder Engagement
8 82 (10.93%) Mathematics
9 78 (10.40%) Data Pipeline
10 76 (10.13%) Roadmaps
11 75 (10.00%) Actionable Insight
12 73 (9.73%) Project Delivery
12 73 (9.73%) Storytelling
13 72 (9.60%) Statistics
14 67 (8.93%) Computer Science
14 67 (8.93%) Stakeholder Management
15 66 (8.80%) CRM
Programming Languages
1 150 (20.00%) Python
2 138 (18.40%) SQL
3 33 (4.40%) Java
4 25 (3.33%) C#
5 18 (2.40%) Scala
6 17 (2.27%) JavaScript
7 12 (1.60%) R
8 11 (1.47%) Go
9 8 (1.07%) T-SQL
9 8 (1.07%) TypeScript
10 5 (0.67%) X++
11 4 (0.53%) Bash
12 3 (0.40%) Bicep
12 3 (0.40%) C++
12 3 (0.40%) PHP
12 3 (0.40%) PowerShell
13 2 (0.27%) PL/SQL
14 1 (0.13%) C
14 1 (0.13%) MATLAB
14 1 (0.13%) VB
Qualifications
1 233 (31.07%) Degree
2 81 (10.80%) DBS Check
3 34 (4.53%) Computer Science Degree
4 31 (4.13%) NVQ Level 3
5 22 (2.93%) ACCA
6 17 (2.27%) Security Cleared
7 13 (1.73%) Microsoft Certification
8 10 (1.33%) PMI Certification
8 10 (1.33%) PMP
9 9 (1.20%) SC Cleared
10 7 (0.93%) CISM
10 7 (0.93%) CISSP
10 7 (0.93%) DV Cleared
11 6 (0.80%) Azure Certification
11 6 (0.80%) CCNP
11 6 (0.80%) Cisco Certification
12 5 (0.67%) PRINCE2 Certification
13 4 (0.53%) CISA
13 4 (0.53%) Numerate Degree
13 4 (0.53%) Tableau Certification
Quality Assurance & Compliance
1 46 (6.13%) QA
2 26 (3.47%) GAAP
2 26 (3.47%) IFRS
3 18 (2.40%) GMP
4 17 (2.27%) Data Quality
5 13 (1.73%) GDPR
6 10 (1.33%) ISO/IEC 27001
7 9 (1.20%) SLA
8 8 (1.07%) PCI DSS
9 5 (0.67%) Accessibility
10 3 (0.40%) SOC 2
11 2 (0.27%) PMO
12 1 (0.13%) Actionable Recommendations
12 1 (0.13%) ISO 9001
12 1 (0.13%) NCSC
12 1 (0.13%) WCAG
System Software
1 16 (2.13%) Active Directory
2 12 (1.60%) Docker
3 4 (0.53%) VMware Infrastructure
4 2 (0.27%) Firmware
5 1 (0.13%) Hyper-V
5 1 (0.13%) Microsoft App-V
Systems Management
1 38 (5.07%) Terraform
2 23 (3.07%) Kubernetes
3 8 (1.07%) Ansible
4 7 (0.93%) Consul
4 7 (0.93%) Grafana
5 4 (0.53%) Single Sign-On
6 3 (0.40%) CSIRT
6 3 (0.40%) Jamf Pro
7 1 (0.13%) AirWatch
7 1 (0.13%) Argo
7 1 (0.13%) Prometheus
7 1 (0.13%) SCCM
7 1 (0.13%) WSUS
7 1 (0.13%) XenMobile
Vendors
1 143 (19.07%) Microsoft
2 77 (10.27%) Databricks
3 61 (8.13%) Google
4 55 (7.33%) Salesforce
5 41 (5.47%) SAP
6 30 (4.00%) Apple
7 17 (2.27%) Adobe
8 11 (1.47%) Cisco
9 9 (1.20%) Oracle
10 8 (1.07%) Dynatrace
11 6 (0.80%) Capita
11 6 (0.80%) VMware
12 5 (0.67%) BT
12 5 (0.67%) F5
12 5 (0.67%) Fortinet
13 4 (0.53%) IBM
13 4 (0.53%) MicroStrategy
13 4 (0.53%) ServiceNow
14 3 (0.40%) Facebook
14 3 (0.40%) Meraki