Presentation Skills Jobs in London

Presentation Skills
England > London

The table below looks at the prevalence of the term Presentation Skills in permanent job vacancies advertised in London. Included is a benchmarking guide to the salaries offered in vacancies that have cited Presentation Skills over the 6 months to 27 April 2024 with a comparison to the same period over the previous 2 years.

6 months to
27 Apr 2024
Same period 2023 Same period 2022
Rank 123 123 175
Rank change year-on-year 0 +52 +20
Permanent jobs citing Presentation Skills 590 1,037 1,619
As % of all permanent jobs advertised in London 2.51% 2.90% 2.48%
As % of the General category 3.73% 4.19% 3.67%
Number of salaries quoted 338 500 846
10th Percentile £37,500 £47,500 £41,250
25th Percentile £47,500 £60,000 £51,250
Median annual salary (50th Percentile) £61,500 £75,000 £70,000
Median % change year-on-year -18.00% +7.14% -3.45%
75th Percentile £76,250 £95,000 £87,500
90th Percentile £97,500 £120,000 £110,000
England median annual salary £52,500 £65,666 £60,000
% change year-on-year -20.05% +9.44% -1.64%

All General Skills
London

Presentation Skills is in the General Skills category. The following table is for comparison with the above and provides summary statistics for all permanent job vacancies advertised in London with a requirement for common skills.

Permanent vacancies with a requirement for common skills 15,828 24,723 44,132
As % of all permanent jobs advertised in London 67.42% 69.03% 67.53%
Number of salaries quoted 11,305 16,984 22,561
10th Percentile £36,250 £42,500 £41,250
25th Percentile £50,625 £55,000 £52,500
Median annual salary (50th Percentile) £70,000 £74,500 £70,000
Median % change year-on-year -6.04% +6.43% -
75th Percentile £93,750 £95,000 £92,500
90th Percentile £117,500 £120,000 £112,500
England median annual salary £52,500 £60,249 £60,000
% change year-on-year -12.86% +0.42% +4.35%

Presentation Skills
Job Vacancy Trend in London

Job postings citing Presentation Skills as a proportion of all IT jobs advertised in London.
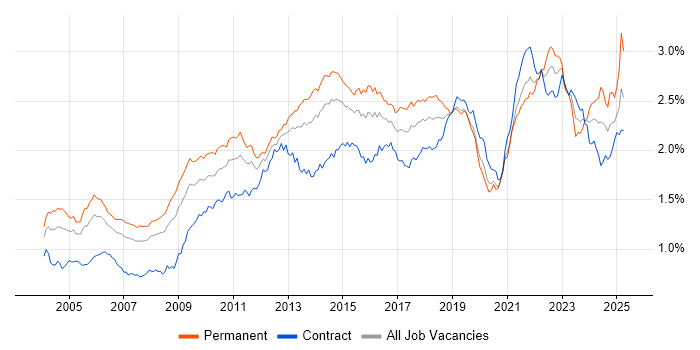
Job vacancy trend for Presentation Skills in London

Presentation Skills
Salary Trend in London

3-month moving average salary quoted in jobs citing Presentation Skills in London.

Salary trend for Presentation Skills in London

Presentation Skills
Salary Histogram in London

Salary distribution for jobs citing Presentation Skills in London over the 6 months to 27 April 2024.

Salary histogram for Presentation Skills in London

Presentation Skills
Job Locations in London

The table below looks at the demand and provides a guide to the median salaries quoted in IT jobs citing Presentation Skills within the London region over the 6 months to 27 April 2024. The 'Rank Change' column provides an indication of the change in demand within each location based on the same 6 month period last year.

Location Rank Change
on Same Period
Last Year
Matching
Permanent
IT Job Ads
Median Salary
Past 6 Months
Median Salary
% Change
on Same Period
Last Year
Live
Jobs
Central London -1 97 £67,000 -12.99% 35
South London -7 11 £50,625 +1.25% 9
West London -12 6 £55,000 -18.52% 26
East London +12 5 - - 11
North London -9 1 £82,500 +62.60% 5
Presentation Skills
England

Presentation Skills
Co-occurring Skills and Capabilities in London by Category

The follow tables expand on the table above by listing co-occurrences grouped by category. The same employment type, locality and period is covered with up to 20 co-occurrences shown in each of the following categories:

Application Platforms
1 17 (2.88%) SharePoint
2 16 (2.71%) Confluence
3 9 (1.53%) Apache Spark
4 8 (1.36%) Microsoft Exchange
5 6 (1.02%) CMS
6 5 (0.85%) Appian
7 4 (0.68%) OpenStack
8 3 (0.51%) Adobe Experience Manager
8 3 (0.51%) Apache Solr
8 3 (0.51%) IIS
8 3 (0.51%) Sitecore CMS
8 3 (0.51%) Umbraco
8 3 (0.51%) WordPress
9 2 (0.34%) SAS
10 1 (0.17%) Drupal
10 1 (0.17%) Jupyter
Applications
1 73 (12.37%) Microsoft Excel
2 29 (4.92%) Microsoft Office
3 21 (3.56%) Microsoft PowerPoint
4 13 (2.20%) Adobe XD
5 9 (1.53%) MS Visio
6 1 (0.17%) Adobe Creative Suite
6 1 (0.17%) Adobe Illustrator
6 1 (0.17%) Adobe Premiere
6 1 (0.17%) Camtasia
6 1 (0.17%) Microsoft Project
6 1 (0.17%) Photoshop
6 1 (0.17%) Sketch
6 1 (0.17%) SPSS
Business Applications
1 11 (1.86%) SAP HR
2 9 (1.53%) Dynamics CRM
3 3 (0.51%) Endur
3 3 (0.51%) Shopify
4 2 (0.34%) SAP S/4HANA
5 1 (0.17%) SAP Retail
5 1 (0.17%) Sparx Enterprise Architect
Cloud Services
1 144 (24.41%) AWS
2 95 (16.10%) Azure
3 77 (13.05%) Power Platform
4 40 (6.78%) SaaS
5 37 (6.27%) Microsoft 365
6 33 (5.59%) GCP
7 17 (2.88%) Asana
8 16 (2.71%) Dynamics 365
9 13 (2.20%) Cloud Computing
10 11 (1.86%) Entra ID
10 11 (1.86%) SuccessFactors
11 10 (1.69%) Serverless
11 10 (1.69%) Snowflake
12 9 (1.53%) Azure API Management
12 9 (1.53%) Boomi
12 9 (1.53%) GitHub
13 8 (1.36%) IaaS
13 8 (1.36%) PaaS
13 8 (1.36%) Power Automate
14 6 (1.02%) Azure Key Vault
Communications & Networking
1 35 (5.93%) Firewall
2 16 (2.71%) Network Security
3 12 (2.03%) Wireless
4 10 (1.69%) Wi-Fi
5 9 (1.53%) DNS
5 9 (1.53%) TCP/IP
6 8 (1.36%) 5G
7 7 (1.19%) WAN
8 6 (1.02%) SD-WAN
9 4 (0.68%) Intrusion Detection
10 3 (0.51%) VPN
11 2 (0.34%) HTTPS
11 2 (0.34%) LAN
11 2 (0.34%) Remote Desktop
11 2 (0.34%) SSL
12 1 (0.17%) Cisco Firepower
12 1 (0.17%) Cisco ISE
12 1 (0.17%) Multicast
12 1 (0.17%) Radio Access Network
12 1 (0.17%) VoIP
Database & Business Intelligence
1 106 (17.97%) Tableau
2 74 (12.54%) Power BI
3 21 (3.56%) Data Warehouse
4 13 (2.20%) PostgreSQL
5 12 (2.03%) SQL Server
6 11 (1.86%) Metadata
7 9 (1.53%) Hadoop
7 9 (1.53%) Spotfire
8 8 (1.36%) Amazon Athena
8 8 (1.36%) Data Lake
9 6 (1.02%) Amazon QuickSight
9 6 (1.02%) Metadata Repository
9 6 (1.02%) Relational Database
9 6 (1.02%) SQL Server Analysis Services
9 6 (1.02%) SQL Server Integration Services
9 6 (1.02%) SQL Server Reporting Services
10 5 (0.85%) Azure SQL Data Warehouse
10 5 (0.85%) MS Access
10 5 (0.85%) NoSQL
11 4 (0.68%) Big Data
Development Applications
1 79 (13.39%) Git
2 27 (4.58%) JIRA
3 13 (2.20%) Axure RP
3 13 (2.20%) Balsamiq
4 9 (1.53%) Jenkins
5 7 (1.19%) RStudio
6 5 (0.85%) GitLab
6 5 (0.85%) Katalon Studio
7 2 (0.34%) JMeter
7 2 (0.34%) Maven
7 2 (0.34%) Selenium
8 1 (0.17%) Cucumber
8 1 (0.17%) Cypress.io
8 1 (0.17%) ERwin
8 1 (0.17%) JProfiler
8 1 (0.17%) JUnit
8 1 (0.17%) LoadRunner
8 1 (0.17%) Mocha
8 1 (0.17%) Subversion
8 1 (0.17%) Toad
General
1 419 (71.02%) Social Skills
2 214 (36.27%) Analytical Skills
3 152 (25.76%) Finance
4 119 (20.17%) Marketing
5 99 (16.78%) Retail
6 95 (16.10%) Inclusion and Diversity
7 53 (8.98%) Public Sector
8 31 (5.25%) Law
9 24 (4.07%) Advertising
9 24 (4.07%) Banking
10 21 (3.56%) Billing
10 21 (3.56%) German Language
11 20 (3.39%) Legal
12 16 (2.71%) Documentation Skills
13 15 (2.54%) Influencing Skills
14 14 (2.37%) Local Government
15 10 (1.69%) Spanish Language
16 8 (1.36%) Manufacturing
16 8 (1.36%) Organisational Skills
17 7 (1.19%) Publishing
Job Titles
1 132 (22.37%) Analyst
2 126 (21.36%) Senior
3 90 (15.25%) Data Analyst
4 64 (10.85%) Architect
5 61 (10.34%) Consultant
5 61 (10.34%) Senior Analyst
6 46 (7.80%) Lead
7 43 (7.29%) Senior Data Analyst
8 33 (5.59%) Project Manager
9 31 (5.25%) Audit Manager
10 27 (4.58%) Lead Data Analyst
11 26 (4.41%) Business Analyst
12 23 (3.90%) Development Manager
12 23 (3.90%) Solutions Architect
13 19 (3.22%) Business Manager
13 19 (3.22%) Developer
13 19 (3.22%) Senior Manager
14 17 (2.88%) Business Development Manager
15 16 (2.71%) Senior Architect
16 15 (2.54%) Data Architect
Libraries, Frameworks & Software Standards
1 29 (4.92%) HTML
2 26 (4.41%) CSS
3 11 (1.86%) REST
4 9 (1.53%) AngularJS
5 8 (1.36%) .NET
5 8 (1.36%) Web Services
6 7 (1.19%) Elastic Stack
6 7 (1.19%) Node.js
7 6 (1.02%) GraphQL
7 6 (1.02%) React
8 5 (0.85%) Spring
8 5 (0.85%) Spring Boot
8 5 (0.85%) YAML
9 4 (0.68%) Apache Camel
9 4 (0.68%) JSON
9 4 (0.68%) PySpark
9 4 (0.68%) XML
10 3 (0.51%) Express.js
10 3 (0.51%) HTML5 Canvas
10 3 (0.51%) Pandas
Miscellaneous
1 40 (6.78%) Self-Motivation
2 29 (4.92%) Onboarding
2 29 (4.92%) Reinsurance
3 27 (4.58%) Management Information System
4 21 (3.56%) Product Ownership
5 17 (2.88%) Virtual Team
6 16 (2.71%) Data Structures
7 13 (2.20%) Public Cloud
8 12 (2.03%) Analytical Mindset
9 11 (1.86%) Social Media
10 10 (1.69%) IoT
11 9 (1.53%) Security Posture
12 8 (1.36%) Algorithms
13 7 (1.19%) Cloud Native
13 7 (1.19%) Enterprise Software
13 7 (1.19%) PKI
13 7 (1.19%) Robotics
14 6 (1.02%) Data Centre
14 6 (1.02%) Distributed Denial-of-Service
14 6 (1.02%) Distributed Systems
Operating Systems
1 18 (3.05%) Windows
2 9 (1.53%) Android
2 9 (1.53%) Apple iOS
2 9 (1.53%) Linux
2 9 (1.53%) Windows Server
3 2 (0.34%) CentOS
3 2 (0.34%) Windows 10
4 1 (0.17%) Mac OS
4 1 (0.17%) Windows Server 2012
Processes & Methodologies
1 250 (42.37%) Problem-Solving
2 160 (27.12%) Agile
3 145 (24.58%) Analytics
4 117 (19.83%) Project Management
5 115 (19.49%) Visualisation
6 113 (19.15%) Data Analysis
7 111 (18.81%) Actionable Insight
8 94 (15.93%) Mathematics
9 93 (15.76%) Business Strategy
10 89 (15.08%) Statistics
11 87 (14.75%) Stakeholder Engagement
12 81 (13.73%) Root Cause Analysis
13 80 (13.56%) Project Delivery
14 78 (13.22%) Storytelling
15 77 (13.05%) Data Pipeline
16 73 (12.37%) Business Intelligence
17 71 (12.03%) Decision-Making
18 68 (11.53%) Customer Intelligence
19 58 (9.83%) Coaching
20 57 (9.66%) Stakeholder Management
Programming Languages
1 141 (23.90%) SQL
2 128 (21.69%) Python
3 28 (4.75%) JavaScript
4 23 (3.90%) R
5 15 (2.54%) Java
6 14 (2.37%) PowerShell
7 7 (1.19%) C#
7 7 (1.19%) T-SQL
8 6 (1.02%) VBA
9 3 (0.51%) Shell Script
10 2 (0.34%) Bash
10 2 (0.34%) Data Analysis Expressions
11 1 (0.17%) ABAP
11 1 (0.17%) Perl
11 1 (0.17%) VB
Qualifications
1 220 (37.29%) Degree
2 69 (11.69%) DBS Check
3 42 (7.12%) Security Cleared
4 40 (6.78%) Microsoft Certification
5 30 (5.08%) ACCA
6 29 (4.92%) Master's Degree
7 28 (4.75%) SC Cleared
8 23 (3.90%) Computer Science Degree
9 17 (2.88%) Azure Certification
10 14 (2.37%) CISSP
11 13 (2.20%) PMI Certification
12 12 (2.03%) CISA
13 11 (1.86%) AWS Certification
13 11 (1.86%) PMP
14 10 (1.69%) GIAC
14 10 (1.69%) MBA
15 9 (1.53%) CRISC
16 8 (1.36%) Cisco Certification
16 8 (1.36%) CISM
16 8 (1.36%) DV Cleared
Quality Assurance & Compliance
1 25 (4.24%) PMO
2 23 (3.90%) Data Quality
3 21 (3.56%) Accessibility
4 20 (3.39%) GAAP
4 20 (3.39%) IFRS
5 16 (2.71%) NIST
6 15 (2.54%) PCI DSS
7 13 (2.20%) ISO/IEC 27001
7 13 (2.20%) WCAG
8 12 (2.03%) GDPR
9 7 (1.19%) Actionable Recommendations
9 7 (1.19%) GRC
10 5 (0.85%) QA
11 4 (0.68%) SLA
12 3 (0.51%) P3O
13 2 (0.34%) COBIT
13 2 (0.34%) HMG Security Policy Framework
13 2 (0.34%) ISO 9001
13 2 (0.34%) NIST 800
13 2 (0.34%) Sarbanes-Oxley
System Software
1 15 (2.54%) Active Directory
2 8 (1.36%) Docker
3 6 (1.02%) Firmware
4 2 (0.34%) Hyper-V
5 1 (0.17%) VMware Infrastructure
Systems Management
1 17 (2.88%) Kubernetes
2 12 (2.03%) Terraform
3 8 (1.36%) Ansible
4 3 (0.51%) Active Directory Federation Services
4 3 (0.51%) Microsoft Intune
5 2 (0.34%) Grafana
5 2 (0.34%) Graphite
5 2 (0.34%) Nagios
5 2 (0.34%) Progress Chef
5 2 (0.34%) ZABBIX
6 1 (0.17%) CASB
6 1 (0.17%) Control-M
6 1 (0.17%) Kibana
6 1 (0.17%) Packer
6 1 (0.17%) Prometheus
6 1 (0.17%) Puppet
6 1 (0.17%) Salt
6 1 (0.17%) SCCM
Vendors
1 144 (24.41%) Microsoft
2 77 (13.05%) Databricks
3 24 (4.07%) Alteryx
4 23 (3.90%) CA
4 23 (3.90%) Google
5 21 (3.56%) SAP
6 19 (3.22%) Salesforce
7 17 (2.88%) Adobe
8 11 (1.86%) Dell
9 8 (1.36%) Juniper
9 8 (1.36%) Splunk
10 6 (1.02%) Cisco
10 6 (1.02%) Oracle
11 5 (0.85%) Duck Creek
11 5 (0.85%) Guidewire
11 5 (0.85%) Pega
12 4 (0.68%) ServiceNow
12 4 (0.68%) Sitecore
12 4 (0.68%) WSO2
13 3 (0.51%) Marketo