Grafana Jobs in London

Grafana
England > London

The table below provides summary statistics for permanent job vacancies advertised in London requiring Grafana skills. It includes a benchmarking guide to the annual salaries offered in vacancies that cited Grafana over the 6 months leading up to 26 July 2024, comparing them to the same period in the previous two years.

6 months to
26 Jul 2024
Same period 2023 Same period 2022
Rank 374 323 390
Rank change year-on-year -51 +67 -82
Permanent jobs citing Grafana 103 254 767
As % of all permanent jobs advertised in London 0.50% 0.94% 1.02%
As % of the Systems Management category 3.75% 5.69% 4.83%
Number of salaries quoted 68 222 217
10th Percentile £53,625 £57,750 £58,250
25th Percentile £72,188 £66,250 £66,250
Median annual salary (50th Percentile) £87,500 £80,000 £80,000
Median % change year-on-year +9.38% - -
75th Percentile £104,063 £92,500 £96,250
90th Percentile £115,000 £107,500 £110,000
England median annual salary £77,500 £75,000 £80,000
% change year-on-year +3.33% -6.25% +6.67%

All Systems Management Skills
London

Grafana falls under the Systems Management category. For comparison with the information above, the following table provides summary statistics for all permanent job vacancies requiring systems management skills in London.

Permanent vacancies with a requirement for systems management skills 2,746 4,466 15,864
As % of all permanent jobs advertised in London 13.24% 16.47% 21.15%
Number of salaries quoted 2,020 3,631 6,181
10th Percentile £42,500 £41,250 £45,000
25th Percentile £61,250 £56,250 £57,500
Median annual salary (50th Percentile) £80,000 £75,000 £77,500
Median % change year-on-year +6.67% -3.23% +3.33%
75th Percentile £100,000 £96,250 £95,000
90th Percentile £117,500 £115,000 £112,500
England median annual salary £62,783 £67,500 £70,000
% change year-on-year -6.99% -3.57% +7.69%

Grafana
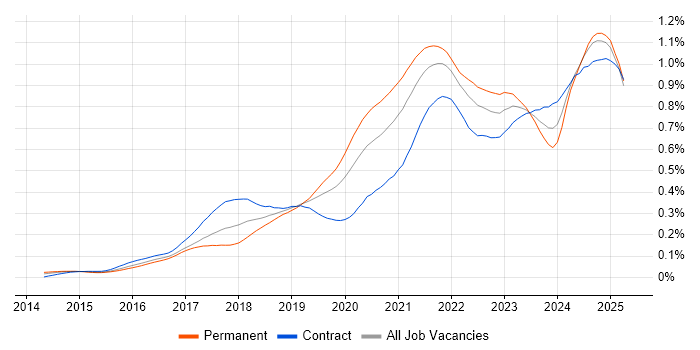
Job Vacancy Trend in London

Job postings citing Grafana as a proportion of all IT jobs advertised in London.

Job vacancy trend for Grafana in London

Grafana
Salary Trend in London

3-month moving average salary quoted in jobs citing Grafana in London.

Salary trend for Grafana in London

Grafana
Salary Histogram in London

Salary distribution for jobs citing Grafana in London over the 6 months to 26 July 2024.

Salary histogram for Grafana in London

Grafana
Job Locations in London

The table below looks at the demand and provides a guide to the median salaries quoted in IT jobs citing Grafana within the London region over the 6 months to 26 July 2024. The 'Rank Change' column provides an indication of the change in demand within each location based on the same 6 month period last year.

Location Rank Change
on Same Period
Last Year
Matching
Permanent
IT Job Ads
Median Salary
Past 6 Months
Median Salary
% Change
on Same Period
Last Year
Live
Jobs
West London -5 5 £45,000 -25.00% 6
Central London -24 3 £90,000 +2.86% 7
East London - 3 £57,500 -
South London -14 2 - -
Grafana
England

Grafana
Co-occurring Skills and Capabilities in London by Category

The follow tables expand on the table above by listing co-occurrences grouped by category. The same employment type, locality and period is covered with up to 20 co-occurrences shown in each of the following categories:

Application Platforms
1 7 (6.80%) nginx
2 4 (3.88%) Confluence
2 4 (3.88%) SharePoint
3 3 (2.91%) Apache
4 2 (1.94%) Oracle SOA Suite
4 2 (1.94%) Red Hat Fuse
5 1 (0.97%) DataSynapse
5 1 (0.97%) OpenStack
Applications
1 1 (0.97%) Microsoft Excel
1 1 (0.97%) Microsoft Project
1 1 (0.97%) Spreadsheet
Business Applications
1 2 (1.94%) Endur
2 1 (0.97%) Oracle EBS
Cloud Services
1 64 (62.14%) AWS
2 39 (37.86%) Azure
3 30 (29.13%) GCP
4 23 (22.33%) Amazon EKS
5 17 (16.50%) Serverless
6 11 (10.68%) AWS CloudFormation
7 9 (8.74%) Datadog
7 9 (8.74%) GitHub
8 8 (7.77%) AWS Lambda
9 7 (6.80%) Amazon CloudWatch
10 6 (5.83%) Azure AKS
10 6 (5.83%) Azure Pipelines
10 6 (5.83%) npm
10 6 (5.83%) Yarn
11 5 (4.85%) Entra ID
11 5 (4.85%) Pulumi
12 4 (3.88%) Amazon EC2
12 4 (3.88%) Microsoft 365
12 4 (3.88%) OCI
12 4 (3.88%) OneDrive
Communications & Networking
1 11 (10.68%) TCP/IP
2 8 (7.77%) DNS
3 6 (5.83%) AMQP
4 5 (4.85%) Firewall
5 4 (3.88%) tcpdump
6 3 (2.91%) DHCP
6 3 (2.91%) Internet
6 3 (2.91%) VPN
6 3 (2.91%) Wireshark
7 2 (1.94%) HTTP
7 2 (1.94%) SNMP
8 1 (0.97%) Intranet
8 1 (0.97%) LAN
8 1 (0.97%) SD-WAN
8 1 (0.97%) WAN
Database & Business Intelligence
1 16 (15.53%) MongoDB
2 14 (13.59%) NoSQL
3 9 (8.74%) PostgreSQL
4 8 (7.77%) SQL Server
5 7 (6.80%) Amazon RDS
6 6 (5.83%) InfluxDB
6 6 (5.83%) Relational Database
7 5 (4.85%) Elasticsearch
8 4 (3.88%) Amazon Aurora
8 4 (3.88%) Big Data
9 3 (2.91%) Redis
10 2 (1.94%) Dremio
10 2 (1.94%) MariaDB
10 2 (1.94%) MySQL
11 1 (0.97%) Apache Cassandra
11 1 (0.97%) BigQuery
11 1 (0.97%) DynamoDB
Development Applications
1 22 (21.36%) Jenkins
1 22 (21.36%) TeamCity
2 20 (19.42%) Git
3 7 (6.80%) GitLab
3 7 (6.80%) Mocha
4 6 (5.83%) Cypress.io
5 4 (3.88%) JIRA
5 4 (3.88%) Maven
6 3 (2.91%) IntelliJ
6 3 (2.91%) ScalaTest
7 2 (1.94%) GoCD
8 1 (0.97%) CircleCI
8 1 (0.97%) Cucumber
8 1 (0.97%) GDB
8 1 (0.97%) Gradle
8 1 (0.97%) JUnit
8 1 (0.97%) Selenium
8 1 (0.97%) Sinon.JS
8 1 (0.97%) Valgrind
General
1 26 (25.24%) Social Skills
2 23 (22.33%) Banking
3 18 (17.48%) Finance
3 18 (17.48%) Inclusion and Diversity
3 18 (17.48%) Retail
4 17 (16.50%) Law
5 7 (6.80%) Analytical Skills
6 5 (4.85%) Marketing
7 4 (3.88%) Influencing Skills
7 4 (3.88%) Investment Banking
7 4 (3.88%) Presentation Skills
7 4 (3.88%) Public Sector
8 3 (2.91%) Games
9 2 (1.94%) Telecoms
10 1 (0.97%) Automotive
10 1 (0.97%) iGaming
10 1 (0.97%) Pharmaceutical
10 1 (0.97%) Publishing
Job Titles
1 28 (27.18%) Senior
2 24 (23.30%) Developer
3 17 (16.50%) DevOps Engineer
3 17 (16.50%) Software Engineer
4 15 (14.56%) Platform Engineer
5 9 (8.74%) AWS Engineer
5 9 (8.74%) Java Engineer
6 8 (7.77%) Java Software Engineer
6 8 (7.77%) Senior Developer
7 7 (6.80%) AWS DevOps
7 7 (6.80%) AWS DevOps Engineer
7 7 (6.80%) Backend Developer
7 7 (6.80%) Full Stack Developer
7 7 (6.80%) Kubernetes Engineer
7 7 (6.80%) Senior Platform Engineer
8 6 (5.83%) .NET Developer
8 6 (5.83%) .NET Developer - Fintech
8 6 (5.83%) Azure Engineer
8 6 (5.83%) C# .NET Developer
8 6 (5.83%) C# Developer
Libraries, Frameworks & Software Standards
1 17 (16.50%) Kafka
2 15 (14.56%) React
3 13 (12.62%) .NET
4 12 (11.65%) RabbitMQ
5 9 (8.74%) Node.js
5 9 (8.74%) REST
6 8 (7.77%) Elastic Stack
6 8 (7.77%) WebSockets
7 7 (6.80%) Express.js
7 7 (6.80%) Loki
8 6 (5.83%) AngularJS
8 6 (5.83%) GraphQL
8 6 (5.83%) gRPC
8 6 (5.83%) Jest
8 6 (5.83%) JWT
8 6 (5.83%) MEAN Stack
8 6 (5.83%) Mongoose
8 6 (5.83%) NestJS
8 6 (5.83%) OAuth
8 6 (5.83%) OAuth2
Miscellaneous
1 25 (24.27%) Cloud Native
2 16 (15.53%) Blog
3 9 (8.74%) Greenfield Project
4 8 (7.77%) Clustering
5 7 (6.80%) Product Ownership
6 6 (5.83%) Client/Server
6 6 (5.83%) Distributed Systems
6 6 (5.83%) Replication
7 5 (4.85%) IoT
7 5 (4.85%) Onboarding
8 4 (3.88%) Market Risk
9 3 (2.91%) Team-Oriented Environment
10 2 (1.94%) Legacy Applications
10 2 (1.94%) Mobile Games
10 2 (1.94%) Online Games
10 2 (1.94%) Self-Motivation
11 1 (0.97%) Data Protection Act
11 1 (0.97%) Management Information System
11 1 (0.97%) Video Conferencing
11 1 (0.97%) Video\Live Streaming
Operating Systems
1 26 (25.24%) Linux
2 11 (10.68%) Windows
3 6 (5.83%) Oracle Linux
3 6 (5.83%) Red Hat Enterprise Linux
4 5 (4.85%) Solaris
5 4 (3.88%) CentOS
5 4 (3.88%) Unix
6 3 (2.91%) Ubuntu
6 3 (2.91%) Windows Server
Processes & Methodologies
1 57 (55.34%) CI/CD
2 39 (37.86%) Agile
3 37 (35.92%) Microservices
4 36 (34.95%) DevOps
5 31 (30.10%) Infrastructure as Code
5 31 (30.10%) Problem-Solving
6 28 (27.18%) Containerisation
6 28 (27.18%) Fintech
7 26 (25.24%) Software Engineering
8 25 (24.27%) Continuous Improvement
9 23 (22.33%) Deployment Automation
10 21 (20.39%) Test Automation
11 20 (19.42%) Clean Code
11 20 (19.42%) High Availability
12 18 (17.48%) Continuous Deployment
12 18 (17.48%) Performance Tuning
13 17 (16.50%) Platform Engineering
14 16 (15.53%) Disruptive Innovation
15 15 (14.56%) Configuration Management
16 14 (13.59%) Continuous Integration
Programming Languages
1 39 (37.86%) Python
2 38 (36.89%) Java
3 22 (21.36%) Bash
4 20 (19.42%) PowerShell
5 17 (16.50%) JavaScript
6 15 (14.56%) C#
7 12 (11.65%) SQL
8 8 (7.77%) TypeScript
9 7 (6.80%) Go
9 7 (6.80%) Kotlin
9 7 (6.80%) Shell Script
10 6 (5.83%) Perl
11 5 (4.85%) C++
12 3 (2.91%) Scala
13 2 (1.94%) C
13 2 (1.94%) Groovy
14 1 (0.97%) PL/SQL
14 1 (0.97%) Ruby
14 1 (0.97%) Rust
Qualifications
1 12 (11.65%) Degree
2 8 (7.77%) Computer Science Degree
3 7 (6.80%) AWS Certification
4 4 (3.88%) SC Cleared
4 4 (3.88%) Security Cleared
5 3 (2.91%) AWS Certified Solutions Architect
5 3 (2.91%) Azure Certification
5 3 (2.91%) Linux+ Certification
5 3 (2.91%) Master's Degree
5 3 (2.91%) RHCE
6 2 (1.94%) AWS Certified DevOps Engineer
7 1 (0.97%) DV Cleared
7 1 (0.97%) MBA
7 1 (0.97%) PMI Certification
7 1 (0.97%) PMP
Quality Assurance & Compliance
1 5 (4.85%) Cyber Essentials
1 5 (4.85%) ISO/IEC 27001
2 3 (2.91%) GDPR
3 1 (0.97%) Accessibility
3 1 (0.97%) PMO
3 1 (0.97%) QA
System Software
1 40 (38.83%) Docker
2 5 (4.85%) Active Directory
3 4 (3.88%) Virtual Machines
3 4 (3.88%) VMware Infrastructure
4 3 (2.91%) KVM
5 2 (1.94%) Ceph
6 1 (0.97%) Slurm Workload Manager
6 1 (0.97%) VMware ESXi
Systems Management
1 66 (64.08%) Kubernetes
2 61 (59.22%) Prometheus
3 52 (50.49%) Terraform
4 28 (27.18%) Ansible
5 14 (13.59%) Kibana
6 11 (10.68%) Progress Chef
6 11 (10.68%) Puppet
7 4 (3.88%) Istio
7 4 (3.88%) Microsoft Intune
8 3 (2.91%) Packer
9 2 (1.94%) Nagios
10 1 (0.97%) Argo
10 1 (0.97%) Failover Clustering
10 1 (0.97%) Graphite
10 1 (0.97%) HAProxy
10 1 (0.97%) Karpenter
10 1 (0.97%) logstash
10 1 (0.97%) Rancher
10 1 (0.97%) vCenter Server
10 1 (0.97%) ZABBIX
Vendors
1 20 (19.42%) Splunk
2 13 (12.62%) Oracle
3 9 (8.74%) Microsoft
4 6 (5.83%) Google
4 6 (5.83%) Serena
4 6 (5.83%) VMware
5 5 (4.85%) Red Hat
6 4 (3.88%) ServiceNow
7 3 (2.91%) SaltStack
8 2 (1.94%) Cisco
8 2 (1.94%) ION Trading
8 2 (1.94%) Palo Alto
8 2 (1.94%) Talend
9 1 (0.97%) Amdocs
9 1 (0.97%) Aruba
9 1 (0.97%) HP
9 1 (0.97%) Juniper
9 1 (0.97%) NetApp
9 1 (0.97%) SolarWinds
9 1 (0.97%) Veeam