Project Delivery Jobs in the North of England

Project Delivery
England > North of England

The table below provides summary statistics for permanent job vacancies advertised in the North of England requiring Project Delivery skills. It includes a benchmarking guide to the annual salaries offered in vacancies that cited Project Delivery over the 6 months leading up to 31 May 2025, comparing them to the same period in the previous two years.

6 months to
31 May 2025
Same period 2024 Same period 2023
Rank 76 61 83
Rank change year-on-year -15 +22 -22
Permanent jobs citing Project Delivery 475 624 655
As % of all permanent jobs advertised in the North of England 4.04% 3.38% 4.00%
As % of the Processes & Methodologies category 4.29% 4.14% 4.14%
Number of salaries quoted 297 462 420
10th Percentile £38,250 £35,750 £40,000
25th Percentile £40,750 £41,976 £47,750
Median annual salary (50th Percentile) £56,000 £50,000 £60,400
Median % change year-on-year +12.00% -17.22% +20.80%
75th Percentile £63,900 £63,617 £72,500
90th Percentile £77,500 £80,000 £77,715
England median annual salary £60,000 £55,000 £62,086
% change year-on-year +9.09% -11.41% +3.48%

All Process and Methodology Skills
North of England

Project Delivery falls under the Processes and Methodologies category. For comparison with the information above, the following table provides summary statistics for all permanent job vacancies requiring process or methodology skills in the North of England.

Permanent vacancies with a requirement for process or methodology skills 11,078 15,074 15,835
As % of all permanent jobs advertised in the North of England 94.14% 81.62% 96.71%
Number of salaries quoted 5,542 11,471 7,791
10th Percentile £25,087 £27,500 £31,250
25th Percentile £36,250 £36,750 £40,000
Median annual salary (50th Percentile) £50,055 £50,000 £55,000
Median % change year-on-year +0.11% -9.09% +10.00%
75th Percentile £61,967 £65,000 £70,000
90th Percentile £77,500 £79,250 £81,250
England median annual salary £57,500 £55,000 £62,500
% change year-on-year +4.55% -12.00% +4.17%

Project Delivery
Job Vacancy Trend in the North of England

Job postings citing Project Delivery as a proportion of all IT jobs advertised in the North of England.
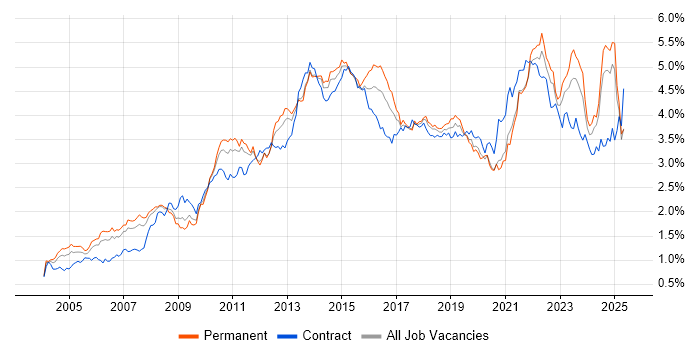
Job vacancy trend for Project Delivery in the North of England

Project Delivery
Salary Trend in the North of England

3-month moving average salary quoted in jobs citing Project Delivery in the North of England.

Salary trend for Project Delivery in the North of England

Project Delivery
Salary Histogram in the North of England

Salary distribution for jobs citing Project Delivery in the North of England over the 6 months to 31 May 2025.

Salary histogram for Project Delivery in the North of England

Project Delivery
Job Locations in the North of England

The table below looks at the demand and provides a guide to the median salaries quoted in IT jobs citing Project Delivery within the North of England region over the 6 months to 31 May 2025. The 'Rank Change' column provides an indication of the change in demand within each location based on the same 6 month period last year.

Location Rank Change
on Same Period
Last Year
Matching
Permanent
IT Job Ads
Median Salary
Past 6 Months
Median Salary
% Change
on Same Period
Last Year
Live
Jobs
North West -1 392 £56,000 +12.00% 177
Yorkshire -27 70 £48,250 -8.10% 93
North East -16 13 £55,000 +4.76% 27
Project Delivery
England

Project Delivery
Co-occurring Skills and Capabilities in the North of England by Category

The follow tables expand on the table above by listing co-occurrences grouped by category. The same employment type, locality and period is covered with up to 20 co-occurrences shown in each of the following categories:

Application Platforms
1 18 (3.79%) Confluence
2 8 (1.68%) Microsoft Exchange
2 8 (1.68%) SharePoint
3 1 (0.21%) IIS
3 1 (0.21%) SharePoint Server
Applications
1 71 (14.95%) Microsoft Project
2 64 (13.47%) Microsoft Office
3 51 (10.74%) Microsoft Excel
4 45 (9.47%) Microsoft PowerPoint
5 23 (4.84%) Trello
6 9 (1.89%) MS Visio
7 8 (1.68%) AutoCAD
8 2 (0.42%) Revit
9 1 (0.21%) Spreadsheet
Business Applications
1 4 (0.84%) Dynamics CRM
2 2 (0.42%) Primavera
3 1 (0.21%) Magento
3 1 (0.21%) Oracle Cash Management
3 1 (0.21%) Oracle ERP
3 1 (0.21%) Oracle General Ledger
3 1 (0.21%) Oracle Payables
3 1 (0.21%) Oracle Receivables
3 1 (0.21%) Shopify
3 1 (0.21%) Sparx Enterprise Architect
Cloud Services
1 57 (12.00%) Power Platform
2 37 (7.79%) Azure
3 28 (5.89%) Microsoft 365
4 20 (4.21%) AWS
5 11 (2.32%) GCP
6 8 (1.68%) Dynamics 365
7 4 (0.84%) Amazon EKS
7 4 (0.84%) Entra ID
8 3 (0.63%) Microsoft Copilot
8 3 (0.63%) SaaS
8 3 (0.63%) Snowflake
9 2 (0.42%) GitHub
10 1 (0.21%) Amazon EventBridge
10 1 (0.21%) Amazon SQS
10 1 (0.21%) Azure API Management
10 1 (0.21%) BigCommerce
10 1 (0.21%) Copilot Studio
10 1 (0.21%) Firebase
10 1 (0.21%) Miro
10 1 (0.21%) OCI
Communications & Networking
1 13 (2.74%) WAN
2 8 (1.68%) Firewall
2 8 (1.68%) SD-WAN
3 5 (1.05%) BGP
3 5 (1.05%) MPLS
3 5 (1.05%) OSPF
3 5 (1.05%) TCP/IP
3 5 (1.05%) Wireless
4 4 (0.84%) DNS
5 3 (0.63%) Cisco ISE
5 3 (0.63%) DHCP
5 3 (0.63%) Junos
5 3 (0.63%) LAN
5 3 (0.63%) VoIP
5 3 (0.63%) VPN
5 3 (0.63%) Wi-Fi
6 2 (0.42%) Modbus
6 2 (0.42%) Network Security
6 2 (0.42%) Reverse Proxy
6 2 (0.42%) SAN
Database & Business Intelligence
1 50 (10.53%) Power BI
2 6 (1.26%) MySQL
3 2 (0.42%) Data Warehouse
4 1 (0.21%) Data Lake
4 1 (0.21%) DB2
4 1 (0.21%) GIS
4 1 (0.21%) MongoDB
4 1 (0.21%) NoSQL
4 1 (0.21%) PostgreSQL
4 1 (0.21%) SQL Server
Development Applications
1 47 (9.89%) JIRA
2 5 (1.05%) Git
3 1 (0.21%) Babel
3 1 (0.21%) GitLab
3 1 (0.21%) webpack
General
1 161 (33.89%) Social Skills
2 102 (21.47%) Finance
3 62 (13.05%) Analytical Skills
4 56 (11.79%) Inclusion and Diversity
5 53 (11.16%) Manufacturing
5 53 (11.16%) Organisational Skills
6 23 (4.84%) Public Sector
7 21 (4.42%) Presentation Skills
8 14 (2.95%) Law
9 12 (2.53%) Legal
10 8 (1.68%) Pharmaceutical
11 6 (1.26%) Marketing
12 5 (1.05%) Documentation Skills
12 5 (1.05%) Games
12 5 (1.05%) Local Government
13 4 (0.84%) Banking
13 4 (0.84%) Military
14 3 (0.63%) Financial Institution
14 3 (0.63%) Influencing Skills
15 2 (0.42%) Electronics
Job Titles
1 204 (42.95%) Project Manager
2 133 (28.00%) Delivery Project Manager
3 60 (12.63%) Analyst
4 45 (9.47%) Digital Analyst
5 42 (8.84%) Assistant Project Manager
6 40 (8.42%) Lead
7 28 (5.89%) Senior
8 26 (5.47%) Delivery Manager
9 21 (4.42%) PLC Engineer
10 20 (4.21%) Graduate
10 20 (4.21%) Graduate Analyst
11 15 (3.16%) Capability Manager
11 15 (3.16%) Head of Delivery
11 15 (3.16%) Head of IT
12 12 (2.53%) Infrastructure Engineer
13 11 (2.32%) Developer
13 11 (2.32%) IT Manager
14 9 (1.89%) Civil Engineer
14 9 (1.89%) IT Project Manager
15 8 (1.68%) Infrastructure Manager
Libraries, Frameworks & Software Standards
1 7 (1.47%) CSS
1 7 (1.47%) HTML
2 6 (1.26%) .NET
2 6 (1.26%) React
3 5 (1.05%) AngularJS
3 5 (1.05%) jQuery
3 5 (1.05%) Kafka
3 5 (1.05%) LAMP
3 5 (1.05%) Vue
4 3 (0.63%) PyTorch
4 3 (0.63%) scikit-learn
4 3 (0.63%) TensorFlow
5 2 (0.42%) Hibernate
5 2 (0.42%) Spring
5 2 (0.42%) Spring Boot
6 1 (0.21%) ADO
6 1 (0.21%) ASP.NET
6 1 (0.21%) COM+
6 1 (0.21%) DOM
6 1 (0.21%) JSON
Miscellaneous
1 24 (5.05%) Management Information System
1 24 (5.05%) Renewable Energy
2 22 (4.63%) Cyberattack
2 22 (4.63%) Social Media
3 11 (2.32%) Onboarding
4 10 (2.11%) Product Ownership
5 8 (1.68%) Data Centre
5 8 (1.68%) NHS
6 6 (1.26%) Public Cloud
7 5 (1.05%) Self-Motivation
8 4 (0.84%) Digital Media
9 3 (0.63%) IoT
9 3 (0.63%) SCADA
10 2 (0.42%) Driving Licence
10 2 (0.42%) Housing Association
10 2 (0.42%) Life Science
10 2 (0.42%) Linux Command Line
10 2 (0.42%) Smart City
10 2 (0.42%) Smart Meter
10 2 (0.42%) Virtual Team
Operating Systems
1 18 (3.79%) Windows
2 7 (1.47%) Windows Server
3 6 (1.26%) Windows Vista
4 3 (0.63%) Linux
4 3 (0.63%) Windows 10
5 2 (0.42%) Android
5 2 (0.42%) Apple iOS
5 2 (0.42%) Red Hat Enterprise Linux
5 2 (0.42%) Windows Server 2012
5 2 (0.42%) Windows Server 2016
5 2 (0.42%) Windows Server 2019
6 1 (0.21%) Mac OS
Processes & Methodologies
1 208 (43.79%) Project Management
2 147 (30.95%) Stakeholder Management
3 118 (24.84%) Agile
4 93 (19.58%) Continuous Improvement
5 78 (16.42%) Problem-Solving
5 78 (16.42%) Risk Management
6 56 (11.79%) Artificial Intelligence
7 53 (11.16%) Business Case
8 52 (10.95%) Analytics
9 51 (10.74%) Time Management
10 50 (10.53%) Business Intelligence
10 50 (10.53%) Mentoring
11 47 (9.89%) Data Analytics
12 45 (9.47%) Technology Transformation
13 44 (9.26%) Digital Strategy
13 44 (9.26%) PRINCE2
14 42 (8.84%) Cybersecurity
15 41 (8.63%) Service Delivery
16 37 (7.79%) Change Management
16 37 (7.79%) Process Improvement
Programming Languages
1 12 (2.53%) PowerShell
1 12 (2.53%) SQL
2 9 (1.89%) JavaScript
2 9 (1.89%) Python
3 8 (1.68%) Java
4 6 (1.26%) PHP
5 4 (0.84%) C#
6 1 (0.21%) Kotlin
6 1 (0.21%) Swift
6 1 (0.21%) T-SQL
6 1 (0.21%) VB
6 1 (0.21%) VBScript
Qualifications
1 194 (40.84%) BPSS Clearance
2 144 (30.32%) Degree
3 37 (7.79%) HND
4 26 (5.47%) DBS Check
5 25 (5.26%) HNC
6 24 (5.05%) Six Sigma Black Belt
6 24 (5.05%) Six Sigma Green Belt
7 23 (4.84%) PMI Certification
8 22 (4.63%) PMP
9 17 (3.58%) Security Cleared
10 16 (3.37%) APMP
11 10 (2.11%) SC Cleared
12 7 (1.47%) RIBA
13 6 (1.26%) Computer Science Degree
14 5 (1.05%) Azure Certification
15 4 (0.84%) Chartered Engineer
15 4 (0.84%) Microsoft Certification
16 3 (0.63%) CCNP
16 3 (0.63%) Cisco Certification
16 3 (0.63%) ITIL Certification
Quality Assurance & Compliance
1 15 (3.16%) QA
2 10 (2.11%) Data Quality
3 9 (1.89%) GDPR
4 7 (1.47%) PMO
5 5 (1.05%) Accessibility
6 3 (0.63%) Actionable Recommendations
6 3 (0.63%) IEC 61508
6 3 (0.63%) ISO/IEC 27001
7 2 (0.42%) Def Stans
7 2 (0.42%) ISO 9001
8 1 (0.21%) HIPAA
8 1 (0.21%) NCSC
8 1 (0.21%) PMBOK
8 1 (0.21%) SLA
System Software
1 16 (3.37%) Active Directory
2 7 (1.47%) Docker
2 7 (1.47%) Hyper-V
3 2 (0.42%) VMware Infrastructure
4 1 (0.21%) BitLocker
4 1 (0.21%) Microsoft App-V
4 1 (0.21%) Virtual Desktop
4 1 (0.21%) vSphere
Systems Management
1 12 (2.53%) Microsoft Intune
2 11 (2.32%) Kubernetes
3 5 (1.05%) FortiGate
3 5 (1.05%) WSUS
4 4 (0.84%) Functional Safety
5 2 (0.42%) SCCM
5 2 (0.42%) Terraform
6 1 (0.21%) Active Directory Federation Services
6 1 (0.21%) Failover Clustering
6 1 (0.21%) Jamf Pro
Vendors
1 53 (11.16%) Microsoft
2 44 (9.26%) Alteryx
3 20 (4.21%) Atlassian
4 18 (3.79%) SAP
5 11 (2.32%) VMware
6 8 (1.68%) Cisco
6 8 (1.68%) NEC
7 7 (1.47%) Veeam
8 5 (1.05%) Draytek
8 5 (1.05%) Salesforce
8 5 (1.05%) Ubiquiti
9 3 (0.63%) Juniper
9 3 (0.63%) Twitter
10 2 (0.42%) Facebook
10 2 (0.42%) Meraki
10 2 (0.42%) Sophos
10 2 (0.42%) Synology
10 2 (0.42%) YouTube
11 1 (0.21%) Intapp
11 1 (0.21%) Sparx