Oracle Contracts in the City of London

Oracle
Central London > City of London

The table below provides summary statistics for contract job vacancies advertised in the City of London requiring knowledge or experience of Oracle products and/or services. It includes a benchmarking guide to contractor rates offered in vacancies that cited Oracle over the 6 months leading up to 20 May 2025, comparing them to the same period in the previous two years.

The figures below represent the IT contractor job market in general and are not representative of contractor rates within the Oracle Corporation.

6 months to
20 May 2025
Same period 2024 Same period 2023
Rank 38 35 35
Rank change year-on-year -3 0 +15
Contract jobs citing Oracle 91 110 195
As % of all contract jobs advertised in the City of London 5.24% 5.08% 5.51%
As % of the Vendors category 11.68% 11.68% 14.01%
Number of daily rates quoted 56 72 107
10th Percentile £400 £363 £450
25th Percentile £423 £511 £520
Median daily rate (50th Percentile) £554 £581 £645
Median % change year-on-year -4.74% -9.88% +7.50%
75th Percentile £693 £675 £750
90th Percentile £775 £763 £825
Central London median daily rate £525 £575 £634
% change year-on-year -8.70% -9.31% +5.67%
Number of hourly rates quoted 0 0 1
10th Percentile - - -
25th Percentile - - £51.25
Median hourly rate - - £52.50
75th Percentile - - £53.75
90th Percentile - - -
Central London median hourly rate - - £52.50

All Vendors
City of London

Oracle falls under the Vendor Products and Services category. For comparison with the information above, the following table provides summary statistics for all contract job vacancies requiring knowledge or experience of all vendor products and services in the City of London.

Contract vacancies with a requirement for knowledge or experience of vendor products and services 779 942 1,392
As % of all contract IT jobs advertised in the City of London 44.87% 43.49% 39.30%
Number of daily rates quoted 476 694 917
10th Percentile £313 £314 £262
25th Percentile £450 £444 £450
Median daily rate (50th Percentile) £550 £561 £575
Median % change year-on-year -2.00% -2.39% +4.55%
75th Percentile £675 £688 £700
90th Percentile £763 £800 £800
Central London median daily rate £550 £550 £550
Number of hourly rates quoted 9 6 7
10th Percentile £23.40 £12.75 £14.87
25th Percentile £27.39 £13.56 £18.42
Median hourly rate £34.65 £19.75 £21.00
Median % change year-on-year +75.44% -5.95% -20.27%
75th Percentile £63.75 £23.75 £36.97
90th Percentile £117.50 £25.38 £53.15
Central London median hourly rate £30.04 £19.75 £21.00
% change year-on-year +52.08% -5.95% -20.51%

Oracle
Job Vacancy Trend in the City of London

Job postings citing Oracle as a proportion of all IT jobs advertised in the City of London.
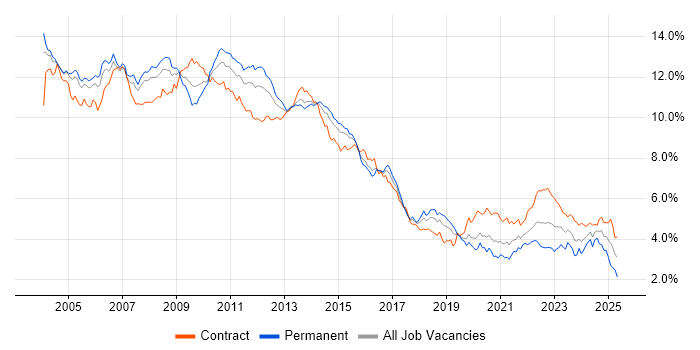
Job vacancy trend for Oracle in the City of London

Oracle
Contractor Daily Rate Trend in the City of London

3-month moving average daily rate quoted in jobs citing Oracle in the City of London.

Daily rate trend for Oracle in the City of London

Oracle
Daily Rate Histogram in the City of London

Daily rate distribution for jobs citing Oracle in the City of London over the 6 months to 20 May 2025.

Daily rate histogram for Oracle in the City of London

Oracle
Contractor Hourly Rate Trend in the City of London

3-month moving average hourly rates quoted in jobs citing Oracle in the City of London.

Hourly rate trend for Oracle in the City of London

Oracle
Co-occurring Skills and Capabilities in the City of London by Category

The follow tables expand on the table above by listing co-occurrences grouped by category. The same employment type, locality and period is covered with up to 20 co-occurrences shown in each of the following categories:

Application Platforms
1 5 (5.49%) Oracle Workflow
2 4 (4.40%) SharePoint
3 3 (3.30%) Apache
3 3 (3.30%) Apache Spark
3 3 (3.30%) Confluence
4 1 (1.10%) BizTalk Server
4 1 (1.10%) Microsoft Exchange
4 1 (1.10%) Oracle SOA Suite
Applications
1 6 (6.59%) Microsoft Excel
2 1 (1.10%) Microsoft Office
2 1 (1.10%) Oracle Smart View
Business Applications
1 15 (16.48%) Oracle EBS
2 6 (6.59%) Oracle Assets
3 5 (5.49%) Oracle EBS R12
3 5 (5.49%) Oracle Payables
4 4 (4.40%) Oracle General Ledger
4 4 (4.40%) Oracle Procure-to-Pay
5 3 (3.30%) Endur
5 3 (3.30%) Oracle E-Business Tax
5 3 (3.30%) Oracle Financials
6 2 (2.20%) Actimize
6 2 (2.20%) Oracle ERP
6 2 (2.20%) Oracle Internet Expenses
6 2 (2.20%) Oracle iProcurement
6 2 (2.20%) Oracle Receivables
6 2 (2.20%) SAP S/4HANA
6 2 (2.20%) Unit4 Business World
7 1 (1.10%) OpenText MBPM
7 1 (1.10%) Oracle Applications
7 1 (1.10%) Oracle BPM
7 1 (1.10%) Oracle Cash Management
Cloud Services
1 14 (15.38%) AWS
1 14 (15.38%) Azure
2 10 (10.99%) OCI
3 7 (7.69%) SaaS
4 4 (4.40%) Entra ID
4 4 (4.40%) Power Platform
5 3 (3.30%) Cloud Computing
5 3 (3.30%) GCP
5 3 (3.30%) GitHub
5 3 (3.30%) Snowflake
6 2 (2.20%) IaaS
6 2 (2.20%) Microsoft 365
6 2 (2.20%) Nutanix
6 2 (2.20%) OpenShift
6 2 (2.20%) PaaS
7 1 (1.10%) AWS CodeCommit
7 1 (1.10%) Azure Monitor
7 1 (1.10%) dbt
7 1 (1.10%) Rubrik
7 1 (1.10%) Textract
Communications & Networking
1 4 (4.40%) Firewall
2 2 (2.20%) Kerberos
2 2 (2.20%) Network Security
3 1 (1.10%) DNS
3 1 (1.10%) IPsec
3 1 (1.10%) TCP/IP
3 1 (1.10%) VPN
Database & Business Intelligence
1 28 (30.77%) SQL Server
2 11 (12.09%) PostgreSQL
3 9 (9.89%) Oracle Database
3 9 (9.89%) Oracle Reports
4 7 (7.69%) Relational Database
5 5 (5.49%) Big Data
5 5 (5.49%) MongoDB
5 5 (5.49%) MySQL
6 3 (3.30%) Amazon RDS
6 3 (3.30%) CockroachDB
6 3 (3.30%) Crystal Reports
6 3 (3.30%) Data Warehouse
6 3 (3.30%) DB2
6 3 (3.30%) Hadoop
6 3 (3.30%) Oracle BI Publisher
7 2 (2.20%) DataStage
7 2 (2.20%) Oracle Database 12c
7 2 (2.20%) Power BI
7 2 (2.20%) SQL Server Integration Services
7 2 (2.20%) Tableau
Development Applications
1 5 (5.49%) JIRA
2 3 (3.30%) Oracle Forms
2 3 (3.30%) TeamCity
3 2 (2.20%) Git
3 2 (2.20%) GitLab
3 2 (2.20%) Jenkins
3 2 (2.20%) Subversion
4 1 (1.10%) Maven
4 1 (1.10%) Serena SBM
4 1 (1.10%) Sonatype Nexus
General
1 42 (46.15%) Finance
2 27 (29.67%) Social Skills
3 19 (20.88%) Banking
4 12 (13.19%) Analytical Skills
4 12 (13.19%) Public Sector
5 7 (7.69%) Back Office
6 5 (5.49%) Corporate Banking
6 5 (5.49%) Investment Banking
7 4 (4.40%) General Ledger
8 3 (3.30%) Front Office
8 3 (3.30%) Manufacturing
8 3 (3.30%) Retail
8 3 (3.30%) Retail Banking
9 2 (2.20%) Military
10 1 (1.10%) Inclusion and Diversity
10 1 (1.10%) Influencing Skills
10 1 (1.10%) International Banking
10 1 (1.10%) Law
10 1 (1.10%) Legal
Job Titles
1 21 (23.08%) Developer
2 15 (16.48%) Consultant
3 14 (15.38%) Architect
4 13 (14.29%) Analyst
5 8 (8.79%) Oracle Consultant
6 6 (6.59%) Data Analyst
6 6 (6.59%) Technical Architect
7 5 (5.49%) Full-Stack Developer
7 5 (5.49%) Java Developer
7 5 (5.49%) Lead
7 5 (5.49%) Senior
8 4 (4.40%) Business Analyst
8 4 (4.40%) Functional Consultant
8 4 (4.40%) Oracle Financials Consultant
8 4 (4.40%) Oracle Functional Consultant
8 4 (4.40%) Python Developer
8 4 (4.40%) Security Architect
9 3 (3.30%) Database Engineer
9 3 (3.30%) DBA
9 3 (3.30%) Solutions Architect
Libraries, Frameworks & Software Standards
1 8 (8.79%) .NET
1 8 (8.79%) Web Services
2 7 (7.69%) React
3 6 (6.59%) JSON
3 6 (6.59%) REST
4 5 (5.49%) Kafka
4 5 (5.49%) Oracle Fusion
4 5 (5.49%) Spring
5 4 (4.40%) AngularJS
5 4 (4.40%) OAuth
5 4 (4.40%) XML
6 3 (3.30%) FastAPI
6 3 (3.30%) Flask
6 3 (3.30%) HTML
6 3 (3.30%) LDAP
6 3 (3.30%) OpenID
6 3 (3.30%) RESTful
6 3 (3.30%) SAML
6 3 (3.30%) SQLAlchemy
7 2 (2.20%) Node.js
Miscellaneous
1 6 (6.59%) Management Information System
2 5 (5.49%) Foreign Exchange (FX)
2 5 (5.49%) Legacy Systems
2 5 (5.49%) Product Ownership
3 4 (4.40%) Data Structures
4 3 (3.30%) Replication
5 2 (2.20%) Clustering
5 2 (2.20%) Data Fabric
5 2 (2.20%) Private Cloud
5 2 (2.20%) Public Cloud
5 2 (2.20%) Security Posture
6 1 (1.10%) Algorithms
6 1 (1.10%) Analytical Mindset
6 1 (1.10%) Enterprise Software
6 1 (1.10%) Fixed Income
6 1 (1.10%) IVR
6 1 (1.10%) Manufacturing Execution System
6 1 (1.10%) Onboarding
6 1 (1.10%) State Machine
6 1 (1.10%) Virtual Team
Operating Systems
1 11 (12.09%) Linux
2 9 (9.89%) Unix
3 7 (7.69%) Windows
4 3 (3.30%) Windows Server
5 2 (2.20%) Red Hat Enterprise Linux
5 2 (2.20%) Solaris
Processes & Methodologies
1 24 (26.37%) Problem-Solving
2 21 (23.08%) Agile
3 14 (15.38%) Data Modelling
3 14 (15.38%) Migration
4 11 (12.09%) DevOps
5 10 (10.99%) SDLC
6 9 (9.89%) Data Analysis
6 9 (9.89%) ERP
6 9 (9.89%) Software Engineering
6 9 (9.89%) Stakeholder Management
7 8 (8.79%) Change Management
7 8 (8.79%) CI/CD
7 8 (8.79%) Data Management
7 8 (8.79%) High Availability
8 7 (7.69%) Disaster Recovery
8 7 (7.69%) ETL
8 7 (7.69%) Risk Management
8 7 (7.69%) User Acceptance Testing
9 6 (6.59%) Computer Science
9 6 (6.59%) Workflow
Programming Languages
1 41 (45.05%) SQL
2 27 (29.67%) Python
3 22 (24.18%) Java
4 10 (10.99%) JavaScript
4 10 (10.99%) PL/SQL
5 9 (9.89%) C#
6 6 (6.59%) Shell Script
7 5 (5.49%) Perl
8 3 (3.30%) Ruby
8 3 (3.30%) Scala
8 3 (3.30%) TypeScript
9 2 (2.20%) Bash
9 2 (2.20%) PowerShell
9 2 (2.20%) R
9 2 (2.20%) T-SQL
10 1 (1.10%) Bicep
10 1 (1.10%) C++
Qualifications
1 12 (13.19%) Degree
2 9 (9.89%) SC Cleared
2 9 (9.89%) Security Cleared
3 6 (6.59%) Computer Science Degree
4 5 (5.49%) Azure Certification
5 3 (3.30%) OCP
5 3 (3.30%) Oracle Certification
6 2 (2.20%) BPSS Clearance
7 1 (1.10%) AWS Certification
7 1 (1.10%) AWS Certified Solutions Architect
Quality Assurance & Compliance
1 4 (4.40%) QA
1 4 (4.40%) Sarbanes-Oxley
2 3 (3.30%) Data Quality
2 3 (3.30%) GDPR
2 3 (3.30%) ISO/IEC 27001
2 3 (3.30%) ISO/IEC 27002 (supersedes ISO/IEC 17799)
2 3 (3.30%) NIST
3 2 (2.20%) Actionable Recommendations
4 1 (1.10%) GAAP
4 1 (1.10%) IFRS
System Software
1 4 (4.40%) Active Directory
2 3 (3.30%) VMware Infrastructure
3 2 (2.20%) VMware ESXi
4 1 (1.10%) NFS
4 1 (1.10%) Oracle RAC
4 1 (1.10%) Veritas File System
4 1 (1.10%) Veritas Volume Manager
4 1 (1.10%) Virtual Machines
Systems Management
1 8 (8.79%) Ansible
2 3 (3.30%) Oracle Enterprise Manager
2 3 (3.30%) Terraform
3 2 (2.20%) Control-M
3 2 (2.20%) Kubernetes
3 2 (2.20%) QRadar
3 2 (2.20%) Tivoli
4 1 (1.10%) CEMLI
4 1 (1.10%) Data Guard
4 1 (1.10%) EMC NetWorker
4 1 (1.10%) Enterprise Manager Cloud Control
4 1 (1.10%) Netcool
4 1 (1.10%) Oracle RMAN
4 1 (1.10%) Red Hat Satellite
4 1 (1.10%) Tivoli Storage Manager
4 1 (1.10%) VxRail
Vendors
1 13 (14.29%) Microsoft
2 8 (8.79%) SAP
3 6 (6.59%) Sybase
4 5 (5.49%) Red Hat
4 5 (5.49%) VMware
5 3 (3.30%) Informatica
5 3 (3.30%) OpenLink
6 2 (2.20%) BMC
6 2 (2.20%) CyberArk
6 2 (2.20%) Databricks
6 2 (2.20%) EMC
6 2 (2.20%) IBM
6 2 (2.20%) Qualys
6 2 (2.20%) Salesforce
6 2 (2.20%) ServiceNow
6 2 (2.20%) Splunk
6 2 (2.20%) Workday
7 1 (1.10%) ION Trading
7 1 (1.10%) SaltStack
7 1 (1.10%) Solace