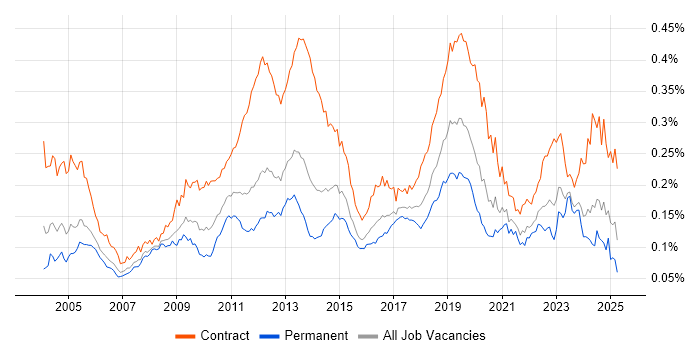
Application Packaging Contract Job Trends in England

Application Packaging
UK > England

The table below provides summary statistics and contractor rates for jobs advertised in England requiring Application Packaging skills. It covers vacancies from the 6 months leading up to 16 September 2025, with comparisons to the same periods in the previous two years.

6 months to
16 Sep 2025
Same period 2024 Same period 2023
Rank 437 425 503
Rank change year-on-year -12 +78 +155
Contract jobs citing Application Packaging 77 103 90
As % of all contract jobs advertised in England 0.28% 0.32% 0.21%
As % of the Processes & Methodologies category 0.31% 0.37% 0.24%
Number of daily rates quoted 54 54 66
10th Percentile £300 £263 £372
25th Percentile £329 £325 £411
Median daily rate (50th Percentile) £450 £380 £500
Median % change year-on-year +18.42% -24.00% +20.48%
75th Percentile £599 £518 £572
90th Percentile £657 £575 £619
UK median daily rate £447 £390 £485
% change year-on-year +14.62% -19.59% +16.87%
Number of hourly rates quoted 2 3 4
10th Percentile £59.10 - £41.98
25th Percentile £59.25 - £53.56
Median hourly rate £59.50 £23.80 £60.00
Median % change year-on-year +150.00% -60.33% -
75th Percentile £59.75 - £61.13
90th Percentile £59.90 - £63.15
UK median hourly rate £59.50 £23.80 £60.00
% change year-on-year +150.00% -60.33% -

All Process and Methodology Skills
England

Application Packaging falls under the Processes and Methodologies category. For comparison with the information above, the following table provides summary statistics for all contract job vacancies requiring process or methodology skills in England.

Contract vacancies with a requirement for process or methodology skills 25,024 27,970 37,992
As % of all contract IT jobs advertised in England 90.88% 86.03% 89.19%
Number of daily rates quoted 15,893 17,419 26,295
10th Percentile £300 £313 £319
25th Percentile £405 £425 £431
Median daily rate (50th Percentile) £508 £525 £550
Median % change year-on-year -3.33% -4.55% -
75th Percentile £625 £645 £656
90th Percentile £738 £750 £750
UK median daily rate £500 £525 £540
% change year-on-year -4.76% -2.78% -1.82%
Number of hourly rates quoted 1,490 1,309 1,438
10th Percentile £14.37 £14.96 £14.25
25th Percentile £17.87 £20.00 £19.06
Median hourly rate £25.15 £43.00 £43.54
Median % change year-on-year -41.51% -1.24% +50.14%
75th Percentile £49.31 £66.50 £65.00
90th Percentile £68.00 £75.00 £77.50
UK median hourly rate £25.15 £43.00 £42.50
% change year-on-year -41.51% +1.18% +46.55%

Application Packaging
Job Vacancy Trend in England

Job postings citing Application Packaging as a proportion of all IT jobs advertised in England.

Job vacancy trend for Application Packaging in England

Application Packaging
Daily Rate Trend in England

Contractor daily rate distribution trend for jobs in England citing Application Packaging.

Contractor daily rate distribution trend for jobs in England citing Application Packaging

Application Packaging
Daily Rate Histogram in England

Daily rate distribution for jobs citing Application Packaging in England over the 6 months to 16 September 2025.

Daily rate histogram for Application Packaging in England

Application Packaging
Hourly Rate Trend in England

Contractor hourly rate distribution trend for jobs in England citing Application Packaging.

Contractor hourly rate distribution trend for jobs in England citing Application Packaging

Application Packaging
Contract Job Locations in England

The table below looks at the demand and provides a guide to the median contractor rates quoted in IT jobs citing Application Packaging within the England region over the 6 months to 16 September 2025. The 'Rank Change' column provides an indication of the change in demand within each location based on the same 6 month period last year.

Location Rank Change
on Same Period
Last Year
Matching
Contract
IT Job Ads
Median
Daily Rate
Past 6 Months
Median Daily Rate
% Change
on Same Period
Last Year
Live
Jobs
South West +30 21 £345 -9.21% 7
South East 0 19 £519 +36.45% 3
London 0 15 £500 +21.21% 4
Midlands +1 12 £600 +100.00% 1
West Midlands -2 9 £600 +100.00%
North of England -9 5 £288 -
East of England - 4 £400 -
Yorkshire - 3 £275 -
East Midlands - 3 £568 - 1
North West -11 1 £288 -
North East - 1 £475 -
Application Packaging
UK

Application Packaging
Co-occurring Skills and Capabilities in England by Category

The follow tables expand on the table above by listing co-occurrences grouped by category. The same employment type, locality and period is covered with up to 20 co-occurrences shown in each of the following categories:

Application Platforms
1 2 (2.60%) Microsoft Exchange
2 1 (1.30%) SharePoint
Business Applications
1 1 (1.30%) Remedy ITSM
Cloud Services
1 19 (24.68%) Azure
2 12 (15.58%) AWS
2 12 (15.58%) Entra ID
2 12 (15.58%) GCP
2 12 (15.58%) Microsoft 365
3 4 (5.19%) Google Kubernetes Engine
3 4 (5.19%) Slack
4 3 (3.90%) OneDrive
5 2 (2.60%) Azure DevOps
6 1 (1.30%) Amazon ECR
6 1 (1.30%) Amazon EKS
6 1 (1.30%) GitHub
6 1 (1.30%) GitHub Actions
Communications & Networking
1 4 (5.19%) LAN
1 4 (5.19%) WAN
2 2 (2.60%) Internet
3 1 (1.30%) DHCP
3 1 (1.30%) DNS
3 1 (1.30%) Remote Desktop
Database & Business Intelligence
1 1 (1.30%) SQL Server Reporting Services
Development Applications
1 21 (27.27%) MSI
2 15 (19.48%) AdminStudio
3 9 (11.69%) InstallShield
4 4 (5.19%) GitLab
4 4 (5.19%) Gradle
4 4 (5.19%) Maven
4 4 (5.19%) Selenium
4 4 (5.19%) SonarQube
5 3 (3.90%) JIRA
6 2 (2.60%) WiX
General
1 16 (20.78%) Social Skills
2 14 (18.18%) Documentation Skills
3 9 (11.69%) Finance
4 6 (7.79%) Analytical Skills
5 5 (6.49%) Retail
6 3 (3.90%) Inclusion and Diversity
6 3 (3.90%) Public Sector
7 2 (2.60%) Legal
Job Titles
1 13 (16.88%) Applications Engineer
2 11 (14.29%) Applications Packager
3 9 (11.69%) Deployment Engineer
4 8 (10.39%) Architect
4 8 (10.39%) Windows Engineer
5 7 (9.09%) Build Engineer
6 5 (6.49%) Analyst
6 5 (6.49%) SC Cleared Deployment Engineer
7 4 (5.19%) GCP Engineer
7 4 (5.19%) Technical Architect
7 4 (5.19%) Windows Build Engineer
8 3 (3.90%) Application Integration Engineer
8 3 (3.90%) Applications Specialist
8 3 (3.90%) Integration Engineer
9 2 (2.60%) AWS Engineer
9 2 (2.60%) Cloud Architect
9 2 (2.60%) Cloud Engineer
9 2 (2.60%) IT Support
9 2 (2.60%) Migration Specialist
9 2 (2.60%) Windows Deployment Engineer
Libraries, Frameworks & Software Standards
1 4 (5.19%) Middleware
1 4 (5.19%) Software Packaging
Miscellaneous
1 8 (10.39%) Cloud Native
2 6 (7.79%) Data Centre
2 6 (7.79%) Legacy Applications
3 4 (5.19%) Public Cloud
4 3 (3.90%) Client/Server
4 3 (3.90%) Onboarding
5 2 (2.60%) Analytical Mindset
5 2 (2.60%) Management Information System
6 1 (1.30%) Blackberry
6 1 (1.30%) Data Protection Act
6 1 (1.30%) Driving Licence
Operating Systems
1 59 (76.62%) Windows
2 28 (36.36%) Windows 10
3 8 (10.39%) Linux
3 8 (10.39%) Mac OS
4 4 (5.19%) Red Hat Enterprise Linux
4 4 (5.19%) Windows Server
5 2 (2.60%) Android
5 2 (2.60%) Apple iOS
6 1 (1.30%) CentOS
6 1 (1.30%) Ubuntu
Processes & Methodologies
1 26 (33.77%) Migration
2 13 (16.88%) DevOps
2 13 (16.88%) ITIL
3 11 (14.29%) Stakeholder Management
4 10 (12.99%) Deployment Automation
5 9 (11.69%) Business Strategy
5 9 (11.69%) Decision-Making
5 9 (11.69%) IT Strategy
5 9 (11.69%) Problem-Solving
5 9 (11.69%) Requirements Gathering
6 7 (9.09%) Agile
6 7 (9.09%) Enterprise Architecture
7 6 (7.79%) CI/CD
7 6 (7.79%) Continuous Improvement
7 6 (7.79%) Data Protection
7 6 (7.79%) Incident Management
7 6 (7.79%) Stakeholder Engagement
7 6 (7.79%) User Acceptance Testing
7 6 (7.79%) User Experience
8 5 (6.49%) Containerisation
Programming Languages
1 32 (41.56%) PowerShell
2 15 (19.48%) VBScript
3 5 (6.49%) Bash
4 4 (5.19%) Java
4 4 (5.19%) Python
5 1 (1.30%) SQL
Qualifications
1 19 (24.68%) Security Cleared
2 15 (19.48%) SC Cleared
3 11 (14.29%) Microsoft Certification
4 5 (6.49%) MCSA
5 3 (3.90%) CBAP
5 3 (3.90%) Citrix Certification
5 3 (3.90%) Computer Science Degree
5 3 (3.90%) Degree
5 3 (3.90%) DV Cleared
5 3 (3.90%) Master's Degree
5 3 (3.90%) MCSE
6 2 (2.60%) A+ Certification
6 2 (2.60%) ITIL Foundation Certificate
6 2 (2.60%) MCITP
6 2 (2.60%) MCP
6 2 (2.60%) MCTS
6 2 (2.60%) Microsoft Certified Master
7 1 (1.30%) AWS Certification
7 1 (1.30%) BPSS Clearance
7 1 (1.30%) DBS Check
Quality Assurance & Compliance
1 6 (7.79%) ISO/IEC 27001
2 5 (6.49%) GDPR
2 5 (6.49%) QA
3 1 (1.30%) NIST
3 1 (1.30%) PCI DSS
3 1 (1.30%) SLA
System Software
1 24 (31.17%) Active Directory
2 18 (23.38%) Microsoft App-V
3 5 (6.49%) VMware Infrastructure
4 4 (5.19%) Docker
5 1 (1.30%) Virtual Desktop
Systems Management
1 37 (48.05%) SCCM
2 22 (28.57%) Microsoft Intune
3 5 (6.49%) Argo
3 5 (6.49%) Kubernetes
3 5 (6.49%) Terraform
4 2 (2.60%) Active Directory Federation Services
4 2 (2.60%) Single Sign-On
4 2 (2.60%) ThinApp
5 1 (1.30%) Ansible
5 1 (1.30%) Nessus
Vendors
1 31 (40.26%) Microsoft
2 9 (11.69%) Citrix
3 8 (10.39%) VMware
4 6 (7.79%) ServiceNow
5 4 (5.19%) Google
5 4 (5.19%) MuleSoft
6 3 (3.90%) Tanium
7 2 (2.60%) ArcSight
7 2 (2.60%) Ivanti
8 1 (1.30%) Apple
8 1 (1.30%) Qualys
8 1 (1.30%) Rapid7
8 1 (1.30%) Remedy
8 1 (1.30%) Samsung
8 1 (1.30%) Tenable