Data Security Contracts with Work from Home Options

Data Security
UK > Work from Home

The table below provides summary statistics for contract job vacancies with an option to work from home (WFH) and a requirement for Data Security skills. Included is a benchmarking guide to the contractor rates offered in vacancies that have cited Data Security over the 6 months to 30 April 2024 with a comparison to the same period in the previous 2 years.

6 months to
30 Apr 2024
Same period 2023 Same period 2022
Rank 188 346 399
Rank change year-on-year +158 +53 -8
Contract jobs citing Data Security 163 132 244
As % of all contract jobs with a WFH option 1.06% 0.51% 0.55%
As % of the Processes & Methodologies category 1.21% 0.57% 0.60%
Number of daily rates quoted 117 89 172
10th Percentile £325 £410 £332
25th Percentile £425 £475 £446
Median daily rate (50th Percentile) £500 £550 £552
Median % change year-on-year -9.09% -0.36% +10.40%
75th Percentile £675 £658 £688
90th Percentile £700 £725 £750
UK median daily rate £525 £550 £550
% change year-on-year -4.55% - +10.00%
Number of hourly rates quoted 8 4 2
10th Percentile £23.75 £16.09 £17.99
25th Percentile £35.94 £17.72 £18.72
Median hourly rate £44.25 £19.25 £22.12
Median % change year-on-year +129.87% -12.97% -65.30%
75th Percentile £72.50 £19.88 £25.21
90th Percentile - - £25.75
UK median hourly rate £40.00 £19.25 £22.12
% change year-on-year +107.79% -12.97% -20.94%

All Process and Methodology Skills
Work from Home

Data Security is in the Processes and Methodologies category. The following table is for comparison with the above and provides summary statistics for all contract job vacancies with a WFH option and a requirement for process or methodology skills.

Contract vacancies with a requirement for process or methodology skills 13,483 23,229 40,650
As % of all contract jobs with a WFH option 87.87% 89.84% 91.14%
Number of daily rates quoted 8,996 16,418 29,502
10th Percentile £325 £363 £360
25th Percentile £425 £450 £431
Median daily rate (50th Percentile) £525 £540 £525
Median % change year-on-year -2.78% +2.86% +8.81%
75th Percentile £638 £650 £625
90th Percentile £750 £750 £719
UK median daily rate £525 £550 £525
% change year-on-year -4.55% +4.76% +7.69%
Number of hourly rates quoted 579 532 548
10th Percentile £15.17 £19.00 £13.50
25th Percentile £25.25 £30.54 £19.98
Median hourly rate £43.00 £55.00 £35.00
Median % change year-on-year -21.82% +57.14% +34.62%
75th Percentile £60.00 £68.75 £55.00
90th Percentile £75.25 £80.23 £67.50
UK median hourly rate £35.65 £37.30 £25.00
% change year-on-year -4.42% +49.20% -

Data Security
Trend for Jobs with a WFH Option

Job vacancies with a work from home option citing Data Security as a proportion of all IT jobs advertised.
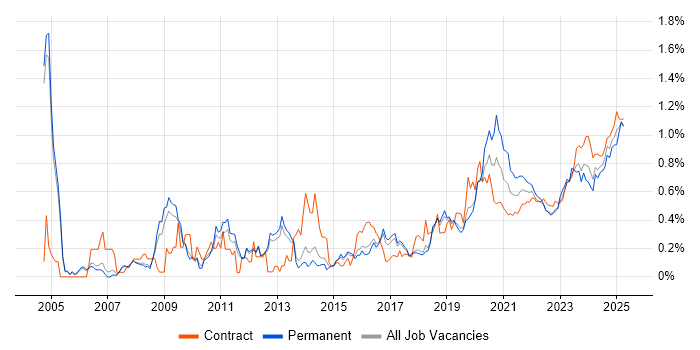
Data Security trend for jobs with a WFH option

Data Security
Daily Rate Trend for Jobs with a WFH Option

3-month moving average daily rate quoted in job vacancies with a work from home option citing Data Security.

Data Security daily rate for jobs with a WFH option

Data Security
Daily Rate Histogram for Jobs with a WFH Option

Daily rate distribution for jobs with a work from home option citing Data Security over the 6 months to 30 April 2024.

Data Security daily rate histogram for jobs with a WFH option

Data Security
Hourly Rate Trend for Jobs with a WFH Option

3-month moving average hourly rate quoted in job vacancies with a work from home option citing Data Security.

Data Security hourly rate for jobs with a WFH option

Data Security
Hourly Rate Histogram for Jobs with a WFH Option

Hourly rate distribution for jobs with a work from home option citing Data Security over the 6 months to 30 April 2024.

Data Security hourly rate histogram for jobs with a WFH option

Data Security
Co-occurring Skills and Capabilities with WFH Options by Category

The follow tables expand on the table above by listing co-occurrences grouped by category. The same employment type, locality and period is covered with up to 20 co-occurrences shown in each of the following categories:

Application Platforms
1 27 (16.56%) SharePoint
2 7 (4.29%) Confluence
3 6 (3.68%) SAS
4 3 (1.84%) Oracle Workflow
5 2 (1.23%) CICS
6 1 (0.61%) Apache Spark
Applications
1 3 (1.84%) Microsoft Excel
2 2 (1.23%) Microsoft PowerPoint
Business Applications
1 3 (1.84%) Oracle Assets
1 3 (1.84%) Oracle EBS
1 3 (1.84%) Oracle EBS R12
1 3 (1.84%) Oracle FAH
1 3 (1.84%) Oracle Financials
1 3 (1.84%) Oracle General Ledger
1 3 (1.84%) Oracle Payables
1 3 (1.84%) Oracle Receivables
2 1 (0.61%) Distributed Ledger
2 1 (0.61%) Dynamics CRM
Cloud Services
1 52 (31.90%) Azure
2 24 (14.72%) Microsoft 365
3 23 (14.11%) AWS
4 14 (8.59%) GCP
5 11 (6.75%) Power Platform
6 10 (6.13%) SaaS
7 9 (5.52%) Cloud Computing
8 8 (4.91%) Entra ID
9 7 (4.29%) IaaS
9 7 (4.29%) Nutanix
9 7 (4.29%) PaaS
9 7 (4.29%) Power Automate
9 7 (4.29%) Rubrik
10 5 (3.07%) CloudFront
10 5 (3.07%) Virtual Private Cloud
11 4 (2.45%) Azure Data Factory
11 4 (2.45%) Dynamics 365
11 4 (2.45%) PowerApps
11 4 (2.45%) Snowflake
12 3 (1.84%) Azure Synapse Analytics
Communications & Networking
1 12 (7.36%) DNS
1 12 (7.36%) Firewall
2 10 (6.13%) NAS
2 10 (6.13%) SAN
3 7 (4.29%) DHCP
3 7 (4.29%) Kerberos
3 7 (4.29%) Network Security
3 7 (4.29%) TCP/IP
3 7 (4.29%) VLAN
4 5 (3.07%) VPN
5 3 (1.84%) PuTTY
6 2 (1.23%) Intrusion Detection
7 1 (0.61%) VoIP
Database & Business Intelligence
1 18 (11.04%) Data Warehouse
2 8 (4.91%) Metadata
2 8 (4.91%) Power BI
3 6 (3.68%) Crystal Reports
4 5 (3.07%) Data Lake
4 5 (3.07%) MySQL
5 4 (2.45%) BigQuery
5 4 (2.45%) Couchbase
5 4 (2.45%) NoSQL
5 4 (2.45%) OLTP
6 3 (1.84%) SQL Server
7 2 (1.23%) DB2
7 2 (1.23%) EDMS
7 2 (1.23%) Enterprise Data Warehouse
7 2 (1.23%) OLAP
7 2 (1.23%) Relational Database
7 2 (1.23%) SQL Server Integration Services
7 2 (1.23%) Tableau
8 1 (0.61%) Amazon Redshift
8 1 (0.61%) Elasticsearch
Development Applications
1 10 (6.13%) Git
2 9 (5.52%) JIRA
3 8 (4.91%) Jenkins
4 7 (4.29%) TeamCity
5 3 (1.84%) Toad
6 2 (1.23%) Android Studio
7 1 (0.61%) Bitbucket
7 1 (0.61%) JMeter
7 1 (0.61%) kappa
7 1 (0.61%) NeoLoad
7 1 (0.61%) Selenium
7 1 (0.61%) SoapUI
General
1 38 (23.31%) Finance
1 38 (23.31%) Social Skills
2 31 (19.02%) Analytical Skills
3 21 (12.88%) Public Sector
4 7 (4.29%) Legal
5 6 (3.68%) Banking
5 6 (3.68%) Inclusion and Diversity
5 6 (3.68%) Retail
5 6 (3.68%) Telecoms
6 4 (2.45%) Organisational Skills
6 4 (2.45%) Pharmaceutical
7 3 (1.84%) Manufacturing
8 1 (0.61%) Aerospace
8 1 (0.61%) Billing
8 1 (0.61%) Financial Institution
8 1 (0.61%) Marketing
8 1 (0.61%) Presentation Skills
Job Titles
1 33 (20.25%) Architect
2 32 (19.63%) Analyst
3 17 (10.43%) Data Engineer
3 17 (10.43%) Technical Architect
4 15 (9.20%) Developer
5 14 (8.59%) SharePoint Architect
6 11 (6.75%) Project Manager
7 10 (6.13%) Data Analyst
8 9 (5.52%) Business Analyst
8 9 (5.52%) Data Architect
8 9 (5.52%) Security Specialist
9 8 (4.91%) IT Security Specialist
9 8 (4.91%) Security Operations Specialist
9 8 (4.91%) SOC Analyst
10 7 (4.29%) Consultant
10 7 (4.29%) Lead
11 6 (3.68%) Cloud Engineer
11 6 (3.68%) IFS Developer
11 6 (3.68%) Security Engineer
12 5 (3.07%) Applications Engineer
Libraries, Frameworks & Software Standards
1 7 (4.29%) LDAP
2 5 (3.07%) Node.js
2 5 (3.07%) OAuth
2 5 (3.07%) OAuth2
2 5 (3.07%) SAML
3 4 (2.45%) Web Services
4 2 (1.23%) Android SDK
4 2 (1.23%) AngularJS
4 2 (1.23%) PySpark
4 2 (1.23%) React
4 2 (1.23%) RESTful
4 2 (1.23%) Swagger
5 1 (0.61%) Elastic Stack
5 1 (0.61%) Kafka
5 1 (0.61%) REST
5 1 (0.61%) Sass
5 1 (0.61%) Shiny
5 1 (0.61%) Smart Contracts
5 1 (0.61%) Spring Batch
5 1 (0.61%) XML
Miscellaneous
1 25 (15.34%) Management Information System
2 22 (13.50%) Cloud Native
3 19 (11.66%) Data Structures
4 7 (4.29%) Clustering
4 7 (4.29%) Replication
5 6 (3.68%) Analytical Mindset
6 4 (2.45%) Onboarding
7 3 (1.84%) Mobile App
7 3 (1.84%) Online Banking
8 2 (1.23%) Algorithms
8 2 (1.23%) Mainframe
8 2 (1.23%) Mobile Banking
8 2 (1.23%) Product Ownership
8 2 (1.23%) Taxonomies
9 1 (0.61%) Cloud Security Posture
9 1 (0.61%) Data Protection Act
9 1 (0.61%) Distributed Applications
9 1 (0.61%) Operational Technology
9 1 (0.61%) SCADA
9 1 (0.61%) Security Posture
Operating Systems
1 16 (9.82%) Windows
2 8 (4.91%) Linux
3 7 (4.29%) Oracle Linux
3 7 (4.29%) Red Hat Enterprise Linux
3 7 (4.29%) Solaris
3 7 (4.29%) Windows Server
4 4 (2.45%) Unix
5 3 (1.84%) Windows Server 2016
6 2 (1.23%) Android
6 2 (1.23%) zOS
Processes & Methodologies
1 35 (21.47%) Data Governance
2 34 (20.86%) Migration
3 33 (20.25%) Problem-Solving
4 31 (19.02%) Analytics
5 30 (18.40%) Data Management
5 30 (18.40%) Project Management
6 29 (17.79%) Data Migration
7 28 (17.18%) Incident Response
8 26 (15.95%) Vulnerability Management
9 25 (15.34%) Data Modelling
10 23 (14.11%) Change Management
11 22 (13.50%) Stakeholder Management
12 20 (12.27%) Agile
12 20 (12.27%) Continuous Improvement
12 20 (12.27%) Data Loss Prevention
13 19 (11.66%) Computer Science
13 19 (11.66%) SIEM
14 18 (11.04%) Data Integration
14 18 (11.04%) Performance Tuning
14 18 (11.04%) Security Operations
Programming Languages
1 27 (16.56%) Python
1 27 (16.56%) SQL
2 11 (6.75%) Java
3 8 (4.91%) Bash
4 7 (4.29%) PowerShell
5 5 (3.07%) JavaScript
6 4 (2.45%) TypeScript
7 3 (1.84%) PHP
7 3 (1.84%) PL/SQL
8 2 (1.23%) COBOL
8 2 (1.23%) Kotlin
8 2 (1.23%) REXX
8 2 (1.23%) T-SQL
9 1 (0.61%) C#
9 1 (0.61%) C++
9 1 (0.61%) Data Analysis Expressions
9 1 (0.61%) R
Qualifications
1 29 (17.79%) Degree
2 27 (16.56%) Security Cleared
3 26 (15.95%) SC Cleared
4 13 (7.98%) Computer Science Degree
5 5 (3.07%) AWS Certification
6 4 (2.45%) CISSP
6 4 (2.45%) PMP
7 2 (1.23%) CISM
7 2 (1.23%) DV Cleared
7 2 (1.23%) PMI Certification
8 1 (0.61%) CISA
8 1 (0.61%) DBS Check
8 1 (0.61%) ISEB
8 1 (0.61%) Master's Degree
8 1 (0.61%) Numerate Degree
Quality Assurance & Compliance
1 24 (14.72%) Data Quality
2 19 (11.66%) GDPR
3 8 (4.91%) QA
4 7 (4.29%) Sarbanes-Oxley
5 6 (3.68%) California Consumer Privacy Act
6 3 (1.84%) ISO/IEC 27001
6 3 (1.84%) NIST
7 2 (1.23%) Actionable Recommendations
7 2 (1.23%) GRC
8 1 (0.61%) Accessibility
8 1 (0.61%) GPG13
8 1 (0.61%) NCSC
8 1 (0.61%) PCI DSS
8 1 (0.61%) SLA
System Software
1 16 (9.82%) Active Directory
2 14 (8.59%) Docker
3 7 (4.29%) VMware Infrastructure
Systems Management
1 8 (4.91%) Kubernetes
1 8 (4.91%) Terraform
2 7 (4.29%) Ansible
2 7 (4.29%) EMC NetWorker
2 7 (4.29%) Netcool
2 7 (4.29%) Tivoli
2 7 (4.29%) Tivoli Storage Manager
3 1 (0.61%) CA Service Virtualization
3 1 (0.61%) CASB
3 1 (0.61%) Kibana
3 1 (0.61%) logstash
3 1 (0.61%) Microsoft Intune
3 1 (0.61%) Single Sign-On
Vendors
1 59 (36.20%) Microsoft
2 23 (14.11%) Qualys
3 17 (10.43%) NetApp
4 16 (9.82%) Forcepoint
4 16 (9.82%) LogRhythm
4 16 (9.82%) Varonis
5 12 (7.36%) Oracle
6 11 (6.75%) CyberArk
6 11 (6.75%) Splunk
7 10 (6.13%) Cisco
7 10 (6.13%) HP
8 7 (4.29%) Dell
8 7 (4.29%) EMC
8 7 (4.29%) IBM
8 7 (4.29%) Isilon
8 7 (4.29%) Serena
8 7 (4.29%) ServiceNow
8 7 (4.29%) VMware
9 6 (3.68%) Databricks
9 6 (3.68%) IFS