Performance Optimisation Contracts with Hybrid/Remote/WFH Options

Performance Optimisation
UK > Work from Home

The table below provides summary statistics for remote or hybrid contract work requiring Performance Optimisation skills. It includes a benchmarking guide to the contractor rates offered in vacancies that cited Performance Optimisation over the 6 months leading up to 18 June 2025, comparing them to the same period in the previous two years.

6 months to
18 Jun 2025
Same period 2024 Same period 2023
Rank 186 273 380
Rank change year-on-year +87 +107 +158
Contract jobs citing Performance Optimisation 119 68 73
As % of all contract jobs with a WFH option 1.22% 0.46% 0.31%
As % of the Processes & Methodologies category 1.33% 0.53% 0.34%
Number of daily rates quoted 79 52 52
10th Percentile £349 £413 £450
25th Percentile £400 £491 £458
Median daily rate (50th Percentile) £475 £600 £465
Median % change year-on-year -20.83% +29.03% -19.13%
75th Percentile £581 £700 £675
90th Percentile £637 £761 £765
UK median daily rate £475 £588 £500
% change year-on-year -19.15% +17.50% -16.67%
Number of hourly rates quoted 0 0 1
Median hourly rate - - £38.00
UK median hourly rate - £30.00 £52.13
% change year-on-year - -42.45% -5.22%

All Process and Methodology Skills
Work from Home

Performance Optimisation falls under the Processes and Methodologies category. For comparison with the information above, the following table provides summary statistics for all contract job vacancies with remote or hybrid options requiring process or methodology skills.

Contract vacancies with a requirement for process or methodology skills 8,931 12,874 21,332
As % of all contract jobs with a WFH option 91.52% 87.15% 89.64%
Number of daily rates quoted 6,062 8,656 15,143
10th Percentile £325 £325 £363
25th Percentile £413 £425 £450
Median daily rate (50th Percentile) £513 £525 £540
Median % change year-on-year -2.38% -2.78% +2.86%
75th Percentile £635 £638 £650
90th Percentile £763 £750 £750
UK median daily rate £505 £525 £550
% change year-on-year -3.76% -4.55% +1.85%
Number of hourly rates quoted 232 576 495
10th Percentile £13.53 £15.08 £18.49
25th Percentile £18.53 £24.00 £25.75
Median hourly rate £35.95 £43.00 £52.13
Median % change year-on-year -16.41% -17.51% +24.12%
75th Percentile £65.25 £60.00 £67.50
90th Percentile £75.00 £74.75 £79.01
UK median hourly rate £25.50 £37.18 £35.00
% change year-on-year -31.41% +6.23% +34.62%

Performance Optimisation
Trend for Jobs with a WFH Option

Job vacancies with remote working options citing Performance Optimisation as a proportion of all IT jobs advertised.
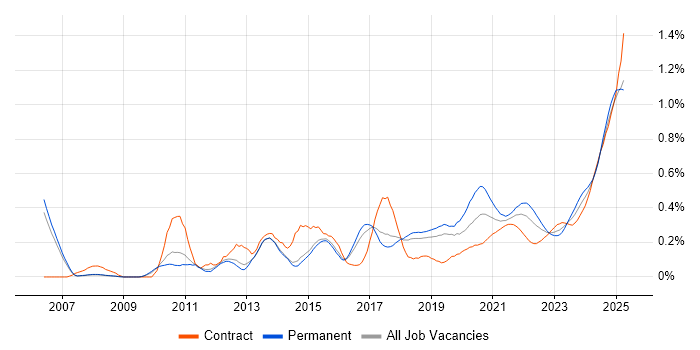
Performance Optimisation trend for jobs with Hybrid/Remote/WFH options

Performance Optimisation
Daily Rate Trend for Jobs with a WFH Option

3-month moving average daily rate quoted in job vacancies with remote working options citing Performance Optimisation.

Performance Optimisation daily rate for jobs with a WFH option

Performance Optimisation
Daily Rate Histogram for Jobs with a WFH Option

Daily rate distribution for jobs with remote working options citing Performance Optimisation over the 6 months to 18 June 2025.

Performance Optimisation daily rate histogram for jobs with a WFH option

Performance Optimisation
Hourly Rate Trend for Jobs with a WFH Option

3-month moving average hourly rate quoted in job vacancies with remote working options citing Performance Optimisation.

Performance Optimisation hourly rate for jobs with a WFH option

Performance Optimisation
Co-occurring Skills and Capabilities with WFH Options by Category

The follow tables expand on the table above by listing co-occurrences grouped by category. The same employment type, locality and period is covered with up to 20 co-occurrences shown in each of the following categories:

Application Platforms
1 5 (4.20%) Moodle
2 4 (3.36%) Apache Airflow
3 3 (2.52%) Apache
3 3 (2.52%) Apache Spark
4 2 (1.68%) Confluence
5 1 (0.84%) Anypoint
5 1 (0.84%) Camunda
5 1 (0.84%) Mule
5 1 (0.84%) nginx
5 1 (0.84%) SAS
5 1 (0.84%) SharePoint
5 1 (0.84%) WebSphere
5 1 (0.84%) WebSphere Application Server
Business Applications
1 1 (0.84%) Aladdin
1 1 (0.84%) NetSuite
1 1 (0.84%) Oracle EBS
1 1 (0.84%) Oracle EBS R12
Cloud Services
1 30 (25.21%) AWS
2 26 (21.85%) Azure
3 11 (9.24%) GCP
4 7 (5.88%) Serverless
5 6 (5.04%) Amazon S3
5 6 (5.04%) AWS Lambda
6 5 (4.20%) GitHub
6 5 (4.20%) Snowflake
7 4 (3.36%) Azure DevOps
7 4 (3.36%) dbt
7 4 (3.36%) GitHub Actions
8 3 (2.52%) AWS CloudFormation
8 3 (2.52%) Firebase
8 3 (2.52%) Google Play
8 3 (2.52%) Power Platform
9 2 (1.68%) OpenShift
10 1 (0.84%) CloudFront
10 1 (0.84%) Datadog
10 1 (0.84%) Google Compute Engine
10 1 (0.84%) Microsoft 365
Communications & Networking
1 6 (5.04%) HTTPS
2 2 (1.68%) Firewall
2 2 (1.68%) Multicast
3 1 (0.84%) Bluetooth
3 1 (0.84%) DNS
3 1 (0.84%) Kerberos
3 1 (0.84%) Network Security
3 1 (0.84%) SSH
3 1 (0.84%) SSL
3 1 (0.84%) TCP/IP
3 1 (0.84%) VPN
Database & Business Intelligence
1 9 (7.56%) SQL Server
2 7 (5.88%) Oracle Database
2 7 (5.88%) PostgreSQL
3 6 (5.04%) Data Warehouse
3 6 (5.04%) NoSQL
4 4 (3.36%) Big Data
4 4 (3.36%) Hadoop
4 4 (3.36%) Oracle Reports
4 4 (3.36%) Relational Database
5 3 (2.52%) Amazon Redshift
5 3 (2.52%) Data Lake
5 3 (2.52%) MongoDB
5 3 (2.52%) MySQL
5 3 (2.52%) Power BI
5 3 (2.52%) SQL Server Integration Services
6 2 (1.68%) Amazon Aurora
6 2 (1.68%) Azure SQL Database
6 2 (1.68%) RDBMS
6 2 (1.68%) Redis
6 2 (1.68%) Tableau
Development Applications
1 22 (18.49%) Git
2 7 (5.88%) Jenkins
3 6 (5.04%) Postman
4 5 (4.20%) PHPUnit
5 4 (3.36%) Cypress.io
5 4 (3.36%) GitLab
6 2 (1.68%) Bitbucket
6 2 (1.68%) JIRA
6 2 (1.68%) SQL Server Management Studio (SSMS)
6 2 (1.68%) Storybook
6 2 (1.68%) webpack
7 1 (0.84%) Artifactory
7 1 (0.84%) Cucumber
7 1 (0.84%) Gerrit
7 1 (0.84%) JUnit
7 1 (0.84%) Log4j
7 1 (0.84%) Mocha
7 1 (0.84%) SoapUI
7 1 (0.84%) Team Foundation Server
7 1 (0.84%) Vite
General
1 29 (24.37%) Social Skills
2 25 (21.01%) Finance
3 8 (6.72%) Analytical Skills
4 7 (5.88%) Public Sector
5 5 (4.20%) Banking
6 4 (3.36%) Games
7 3 (2.52%) Front Office
7 3 (2.52%) Investment Banking
7 3 (2.52%) Marketing
8 2 (1.68%) Documentation Skills
8 2 (1.68%) Manufacturing
9 1 (0.84%) Automotive
9 1 (0.84%) Billing
9 1 (0.84%) Electronics
9 1 (0.84%) French Language
9 1 (0.84%) Inclusion and Diversity
9 1 (0.84%) Law
9 1 (0.84%) Organisational Skills
9 1 (0.84%) Telecoms
Job Titles
1 36 (30.25%) Developer
2 28 (23.53%) Senior
3 14 (11.76%) Senior Developer
4 11 (9.24%) Architect
4 11 (9.24%) Data Engineer
5 9 (7.56%) Lead
6 8 (6.72%) DevOps Engineer
6 8 (6.72%) Software Engineer
7 6 (5.04%) AWS Engineer
7 6 (5.04%) Consultant
8 5 (4.20%) Android Developer
8 5 (4.20%) Full-Stack Developer
8 5 (4.20%) Moodle Developer
8 5 (4.20%) Python Developer
9 4 (3.36%) Administrator
9 4 (3.36%) C# Developer
9 4 (3.36%) C++ Software Engineer
9 4 (3.36%) Database Engineer
9 4 (3.36%) Games Engineer
9 4 (3.36%) Oracle Database Engineer
Libraries, Frameworks & Software Standards
1 17 (14.29%) RESTful
2 14 (11.76%) React
3 13 (10.92%) .NET
4 12 (10.08%) CSS
5 11 (9.24%) HTML
6 10 (8.40%) XML
7 8 (6.72%) Node.js
7 8 (6.72%) OAuth
8 7 (5.88%) .NET Core
8 7 (5.88%) Android SDK
8 7 (5.88%) AngularJS
8 7 (5.88%) GraphQL
8 7 (5.88%) Jest
8 7 (5.88%) Redux
8 7 (5.88%) SOAP
9 6 (5.04%) JSON
10 5 (4.20%) Behat
10 5 (4.20%) CSS3
10 5 (4.20%) HTML5
10 5 (4.20%) JDBC
Miscellaneous
1 9 (7.56%) Algorithms
1 9 (7.56%) Data Structures
1 9 (7.56%) Mobile App
2 7 (5.88%) Distributed Systems
3 5 (4.20%) Cloud Native
3 5 (4.20%) e-Learning
3 5 (4.20%) Legacy Systems
3 5 (4.20%) VLE
4 4 (3.36%) Hedge funds
4 4 (3.36%) PKI
4 4 (3.36%) Taxonomies
5 3 (2.52%) Data Centre
5 3 (2.52%) Enterprise Software
5 3 (2.52%) Onboarding
5 3 (2.52%) Virtual Team
6 2 (1.68%) Data Protection Act
6 2 (1.68%) Distributed Applications
6 2 (1.68%) Distributed Architecture
6 2 (1.68%) Fixed Income
6 2 (1.68%) IoT
Operating Systems
1 15 (12.61%) Linux
2 10 (8.40%) Android
3 3 (2.52%) Apple iOS
3 3 (2.52%) Unix
3 3 (2.52%) Windows
4 1 (0.84%) AIX
4 1 (0.84%) Embedded Linux
4 1 (0.84%) Red Hat Enterprise Linux
4 1 (0.84%) Solaris
4 1 (0.84%) Windows Server 2019
Processes & Methodologies
1 42 (35.29%) CI/CD
2 30 (25.21%) Agile
3 28 (23.53%) Problem-Solving
4 24 (20.17%) DevOps
5 21 (17.65%) Mentoring
6 18 (15.13%) Technical Leadership
7 16 (13.45%) Containerisation
7 16 (13.45%) Infrastructure as Code
7 16 (13.45%) Performance Tuning
7 16 (13.45%) User Experience
8 15 (12.61%) Front End Development
9 14 (11.76%) Analytics
9 14 (11.76%) Migration
10 13 (10.92%) Code Quality
10 13 (10.92%) High Availability
10 13 (10.92%) Microservices
10 13 (10.92%) Software Engineering
11 12 (10.08%) Data Pipeline
11 12 (10.08%) Scrum
12 11 (9.24%) Full-Stack Development
Programming Languages
1 28 (23.53%) Python
2 25 (21.01%) SQL
3 22 (18.49%) JavaScript
4 14 (11.76%) Java
5 11 (9.24%) Bash
5 11 (9.24%) PowerShell
6 8 (6.72%) C#
6 8 (6.72%) TypeScript
7 7 (5.88%) Kotlin
8 6 (5.04%) C++
8 6 (5.04%) PHP
9 4 (3.36%) C
10 3 (2.52%) Go
10 3 (2.52%) Perl
10 3 (2.52%) Ruby
11 2 (1.68%) ActionScript
11 2 (1.68%) ActionScript 2.0
11 2 (1.68%) Assembly Language
11 2 (1.68%) PL/SQL
11 2 (1.68%) T-SQL
Qualifications
1 21 (17.65%) Security Cleared
2 14 (11.76%) SC Cleared
3 10 (8.40%) Degree
4 8 (6.72%) Computer Science Degree
5 4 (3.36%) BPSS Clearance
5 4 (3.36%) Master's Degree
6 3 (2.52%) AWS Certification
6 3 (2.52%) Azure Certification
7 2 (1.68%) AWS Certified Solutions Architect
7 2 (1.68%) VCAP
8 1 (0.84%) CISSP
8 1 (0.84%) CompTIA Security+
8 1 (0.84%) DV Cleared
8 1 (0.84%) IBM Certification
8 1 (0.84%) Linux+ Certification
8 1 (0.84%) RHCE
Quality Assurance & Compliance
1 12 (10.08%) Accessibility
2 5 (4.20%) Data Quality
3 3 (2.52%) GDPR
4 2 (1.68%) QA
5 1 (0.84%) California Consumer Privacy Act
5 1 (0.84%) Disclosure Scotland
5 1 (0.84%) HIPAA
5 1 (0.84%) HL7
5 1 (0.84%) PCI DSS
5 1 (0.84%) WCAG
System Software
1 22 (18.49%) Docker
2 3 (2.52%) Active Directory
2 3 (2.52%) VMware Infrastructure
3 2 (1.68%) Virtual Desktop
4 1 (0.84%) Embedded Firmware
4 1 (0.84%) Firmware
4 1 (0.84%) KVM
4 1 (0.84%) NFS
4 1 (0.84%) QEMU
4 1 (0.84%) Samba
4 1 (0.84%) Xen
Systems Management
1 22 (18.49%) Kubernetes
2 19 (15.97%) Terraform
3 8 (6.72%) Ansible
4 5 (4.20%) Single Sign-On
5 4 (3.36%) Data Guard
5 4 (3.36%) Oracle Enterprise Manager
5 4 (3.36%) Prometheus
6 3 (2.52%) Grafana
7 2 (1.68%) BMC PATROL
7 2 (1.68%) Kibana
7 2 (1.68%) Nagios
8 1 (0.84%) Consul
8 1 (0.84%) Istio
8 1 (0.84%) linkerd
8 1 (0.84%) Oracle RMAN
8 1 (0.84%) Progress Chef
8 1 (0.84%) Puppet
8 1 (0.84%) SELinux
8 1 (0.84%) yum
8 1 (0.84%) ZABBIX
Vendors
1 10 (8.40%) Microsoft
1 10 (8.40%) Oracle
2 7 (5.88%) Google
3 6 (5.04%) IBM
4 5 (4.20%) Red Hat
5 4 (3.36%) Databricks
5 4 (3.36%) ForgeRock
5 4 (3.36%) Ping Identity
5 4 (3.36%) VMware
6 3 (2.52%) Splunk
7 2 (1.68%) Arista
7 2 (1.68%) BMC
7 2 (1.68%) Citrix
7 2 (1.68%) Commvault
7 2 (1.68%) Fujitsu
7 2 (1.68%) IBM Sterling
7 2 (1.68%) Salesforce
7 2 (1.68%) SAP
7 2 (1.68%) Software AG
8 1 (0.84%) Informatica