ZABBIX Jobs in England

ZABBIX
UK > England

The table below provides summary statistics for permanent job vacancies advertised in England requiring ZABBIX skills. It includes a benchmarking guide to the annual salaries offered in vacancies that cited ZABBIX over the 6 months leading up to 26 July 2024, comparing them to the same period in the previous two years.

6 months to
26 Jul 2024
Same period 2023 Same period 2022
Rank 723 775 1017
Rank change year-on-year +52 +242 -167
Permanent jobs citing ZABBIX 76 59 173
As % of all permanent jobs advertised in England 0.097% 0.083% 0.12%
As % of the Systems Management category 1.05% 0.58% 0.66%
Number of salaries quoted 54 40 107
10th Percentile £42,945 £31,250 £34,000
25th Percentile £49,000 £51,750 £42,220
Median annual salary (50th Percentile) £63,750 £62,500 £60,000
Median % change year-on-year +2.00% +4.17% -14.29%
75th Percentile £70,125 £72,500 £77,500
90th Percentile £76,250 £87,500 £94,250
UK median annual salary £57,500 £62,500 £60,000
% change year-on-year -8.00% +4.17% -11.11%

All Systems Management Skills
England

ZABBIX falls under the Systems Management category. For comparison with the information above, the following table provides summary statistics for all permanent job vacancies requiring systems management skills in England.

Permanent vacancies with a requirement for systems management skills 7,223 10,168 26,120
As % of all permanent jobs advertised in England 9.22% 14.30% 17.77%
Number of salaries quoted 5,245 7,528 12,568
10th Percentile £35,000 £35,400 £37,500
25th Percentile £46,000 £47,500 £47,500
Median annual salary (50th Percentile) £62,783 £67,500 £70,000
Median % change year-on-year -6.99% -3.57% +7.69%
75th Percentile £85,000 £87,500 £87,500
90th Percentile £101,250 £105,000 £102,500
UK median annual salary £62,500 £67,500 £67,500
% change year-on-year -7.41% - +3.85%

ZABBIX
Job Vacancy Trend in England

Job postings citing ZABBIX as a proportion of all IT jobs advertised in England.
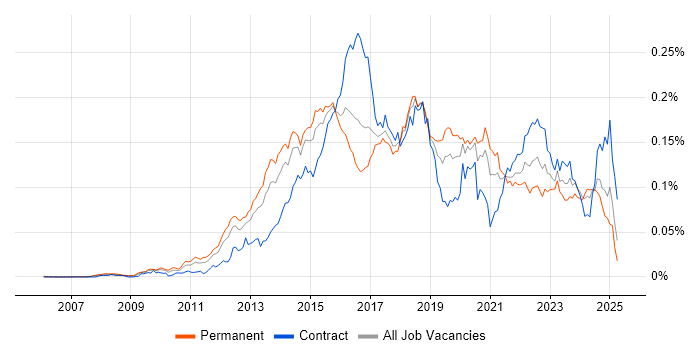
Job vacancy trend for ZABBIX in England

ZABBIX
Salary Trend in England

3-month moving average salary quoted in jobs citing ZABBIX in England.

Salary trend for ZABBIX in England

ZABBIX
Salary Histogram in England

Salary distribution for jobs citing ZABBIX in England over the 6 months to 26 July 2024.

Salary histogram for ZABBIX in England

ZABBIX
Job Locations in England

The table below looks at the demand and provides a guide to the median salaries quoted in IT jobs citing ZABBIX within the England region over the 6 months to 26 July 2024. The 'Rank Change' column provides an indication of the change in demand within each location based on the same 6 month period last year.

Location Rank Change
on Same Period
Last Year
Matching
Permanent
IT Job Ads
Median Salary
Past 6 Months
Median Salary
% Change
on Same Period
Last Year
Live
Jobs
South East +25 31 £65,000 - 1
East of England +4 13 £46,250 -16.67% 2
North of England +15 12 £71,250 +42.50%
North West -1 11 £72,500 +152.17%
South West +4 10 £51,000 +2.00% 1
London +70 8 £82,500 +24.53% 1
West Midlands -4 2 £48,800 +35.56%
Midlands -21 2 £48,800 +35.56%
Yorkshire +57 1 £49,000 -34.67%
ZABBIX
UK

ZABBIX
Co-occurring Skills and Capabilities in England by Category

The follow tables expand on the table above by listing co-occurrences grouped by category. The same employment type, locality and period is covered with up to 20 co-occurrences shown in each of the following categories:

Application Platforms
1 15 (19.74%) OpenStack
2 7 (9.21%) IIS
3 3 (3.95%) CloudStack
4 2 (2.63%) Microsoft Exchange
4 2 (2.63%) SharePoint
Applications
1 1 (1.32%) Microsoft Excel
Cloud Services
1 27 (35.53%) Azure
2 22 (28.95%) AWS
3 14 (18.42%) GCP
4 10 (13.16%) Microsoft 365
5 9 (11.84%) GitHub
6 5 (6.58%) Entra ID
7 4 (5.26%) Cloud Computing
8 3 (3.95%) Datadog
8 3 (3.95%) OCI
8 3 (3.95%) PaaS
8 3 (3.95%) SaaS
8 3 (3.95%) Stackdriver
9 1 (1.32%) AWS CodeDeploy
9 1 (1.32%) Azure DevOps
9 1 (1.32%) Azure Monitor
9 1 (1.32%) Cloudflare
9 1 (1.32%) OpenShift
Communications & Networking
1 32 (42.11%) Firewall
2 28 (36.84%) VPN
3 20 (26.32%) DNS
4 19 (25.00%) DHCP
5 17 (22.37%) iSCSI
6 15 (19.74%) 5G
7 8 (10.53%) VLAN
8 7 (9.21%) Fibre Channel
8 7 (9.21%) SAN
9 6 (7.89%) IPv4
9 6 (7.89%) SD-WAN
9 6 (7.89%) TCP/IP
9 6 (7.89%) WAN
10 5 (6.58%) Software-Defined Networking
11 4 (5.26%) Network Security
12 3 (3.95%) Cisco ASA
12 3 (3.95%) MPLS
12 3 (3.95%) NetScaler
12 3 (3.95%) SSL
13 1 (1.32%) OSPF
Database & Business Intelligence
1 2 (2.63%) MySQL
1 2 (2.63%) PostgreSQL
1 2 (2.63%) SQL Server
2 1 (1.32%) Elasticsearch
2 1 (1.32%) RDBMS
2 1 (1.32%) Relational Database
Development Applications
1 16 (21.05%) Git
2 14 (18.42%) Jenkins
3 9 (11.84%) JIRA
3 9 (11.84%) Trac
4 1 (1.32%) Bitbucket
4 1 (1.32%) CircleCI
4 1 (1.32%) GitLab
4 1 (1.32%) JUnit
4 1 (1.32%) Selenium
4 1 (1.32%) Subversion
4 1 (1.32%) TestNG
4 1 (1.32%) Travis CI
General
1 18 (23.68%) Social Skills
1 18 (23.68%) Telecoms
2 16 (21.05%) Finance
3 9 (11.84%) Public Sector
4 3 (3.95%) Analytical Skills
4 3 (3.95%) Banking
4 3 (3.95%) Law
4 3 (3.95%) Presentation Skills
5 2 (2.63%) Investment Banking
5 2 (2.63%) Manufacturing
6 1 (1.32%) Games
6 1 (1.32%) Inclusion and Diversity
Job Titles
1 16 (21.05%) Infrastructure Engineer
2 15 (19.74%) Network Engineer
3 13 (17.11%) Lead
3 13 (17.11%) Team Leader
4 10 (13.16%) Systems Engineer
5 7 (9.21%) Backup Engineer
5 7 (9.21%) Backup Infrastructure Engineer
5 7 (9.21%) Cloud Engineer
5 7 (9.21%) Storage and Backup Engineer
5 7 (9.21%) Storage Engineer
6 6 (7.89%) Architect
6 6 (7.89%) Infrastructure Manager
7 5 (6.58%) Network Systems Engineer
8 4 (5.26%) IT Engineer
9 3 (3.95%) Solutions Architect
10 2 (2.63%) Linux Engineer
10 2 (2.63%) Senior
10 2 (2.63%) Site Engineer
10 2 (2.63%) Site Reliability Engineer
11 1 (1.32%) ServiceNow Architect
Libraries, Frameworks & Software Standards
1 4 (5.26%) Elastic Stack
2 3 (3.95%) Flash
3 2 (2.63%) LDAP
4 1 (1.32%) RabbitMQ
Miscellaneous
1 16 (21.05%) Data Centre
2 8 (10.53%) Replication
3 7 (9.21%) EMC VNX
4 6 (7.89%) PMI
5 5 (6.58%) Management Information System
6 4 (5.26%) Public Cloud
7 3 (3.95%) IBM Storwize
8 2 (2.63%) Enterprise Storage
9 1 (1.32%) AS400
9 1 (1.32%) Distributed Denial-of-Service
9 1 (1.32%) Hybrid Cloud
9 1 (1.32%) PKI
Operating Systems
1 63 (82.89%) Linux
2 38 (50.00%) Windows
3 14 (18.42%) Windows Server
4 7 (9.21%) Debian
5 5 (6.58%) CentOS
5 5 (6.58%) Red Hat Enterprise Linux
5 5 (6.58%) Ubuntu
6 3 (3.95%) SUSE
6 3 (3.95%) SUSE Linux Enterprise Server
6 3 (3.95%) Unix
6 3 (3.95%) VMS
7 1 (1.32%) Windows Server 2016
7 1 (1.32%) Windows Server 2019
Processes & Methodologies
1 34 (44.74%) DevOps
2 26 (34.21%) Configuration Management
3 25 (32.89%) Agile
4 24 (31.58%) Mentoring
5 22 (28.95%) Infrastructure Engineering
5 22 (28.95%) ITIL
6 20 (26.32%) Project Management
7 16 (21.05%) CI/CD
8 15 (19.74%) Actionable Insight
8 15 (19.74%) Validation
9 14 (18.42%) Agile Project Management
9 14 (18.42%) Problem-Solving
10 13 (17.11%) Computer Science
11 12 (15.79%) Roadmaps
12 10 (13.16%) Disaster Recovery
12 10 (13.16%) Hardware Maintenance
13 8 (10.53%) Network Monitoring
14 7 (9.21%) Infrastructure Management
14 7 (9.21%) Server Management
15 6 (7.89%) Line Management
Programming Languages
1 20 (26.32%) Python
2 16 (21.05%) PowerShell
3 8 (10.53%) Bash
4 5 (6.58%) Perl
4 5 (6.58%) Shell Script
5 4 (5.26%) SQL
6 3 (3.95%) Go
Qualifications
1 22 (28.95%) SC Cleared
1 22 (28.95%) Security Cleared
2 13 (17.11%) Degree
3 10 (13.16%) Computer Science Degree
3 10 (13.16%) ITIL Foundation Certificate
4 6 (7.89%) PMI Certification
5 3 (3.95%) Azure Certification
6 2 (2.63%) ITIL Certification
7 1 (1.32%) VMware Certified Professional (VCP)
Quality Assurance & Compliance
1 3 (3.95%) HIPAA
2 2 (2.63%) ISO/IEC 27001
3 1 (1.32%) GDPR
3 1 (1.32%) NIST
3 1 (1.32%) PCI DSS
System Software
1 26 (34.21%) Active Directory
2 24 (31.58%) VMware Infrastructure
3 23 (30.26%) Docker
4 22 (28.95%) Virtual Machines
5 16 (21.05%) Hyper-V
6 15 (19.74%) pfSense
7 9 (11.84%) NFS
8 7 (9.21%) VMware ESXi
9 3 (3.95%) Ceph
9 3 (3.95%) Gluster
9 3 (3.95%) KVM
9 3 (3.95%) oVirt
10 1 (1.32%) vCloud
10 1 (1.32%) VirtualBox
10 1 (1.32%) VMware Workstation
10 1 (1.32%) vSphere
Systems Management
1 30 (39.47%) Ansible
2 20 (26.32%) Grafana
2 20 (26.32%) Puppet
3 15 (19.74%) Kubernetes
4 12 (15.79%) Nagios
5 9 (11.84%) Microsoft Data Protection Manager
5 9 (11.84%) SCDPM
6 7 (9.21%) EMC NetWorker
6 7 (9.21%) vCenter Server
7 6 (7.89%) Active Directory Federation Services
7 6 (7.89%) Opsgenie
7 6 (7.89%) VxRail
8 5 (6.58%) Jamf Pro
9 4 (5.26%) WSUS
10 3 (3.95%) Graphite
10 3 (3.95%) Graylog
10 3 (3.95%) Observium
10 3 (3.95%) Prometheus
11 2 (2.63%) FortiGate
11 2 (2.63%) Terraform
Vendors
1 41 (53.95%) VMware
2 26 (34.21%) Microsoft
3 25 (32.89%) Fortinet
4 19 (25.00%) Juniper
5 17 (22.37%) SolarWinds
5 17 (22.37%) Veeam
6 14 (18.42%) NetApp
7 12 (15.79%) Cisco
8 9 (11.84%) EMC
8 9 (11.84%) McAfee
9 8 (10.53%) Red Hat
10 7 (9.21%) Brocade
11 6 (7.89%) Dell
12 5 (6.58%) New Relic
12 5 (6.58%) ServiceNow
12 5 (6.58%) Splunk
12 5 (6.58%) Tanium
13 4 (5.26%) Citrix
13 4 (5.26%) IBM
14 3 (3.95%) Oracle