Public Sector Jobs in England

Public Sector
UK > England

The table below looks at the prevalence of the term Public Sector in permanent job vacancies in England. Included is a benchmarking guide to the salaries offered in vacancies that cited Public Sector over the 6 months leading up to 31 May 2025, comparing them to the same period in the previous two years.

6 months to
31 May 2025
Same period 2024 Same period 2023
Rank 118 54 91
Rank change year-on-year -64 +37 +1
Permanent jobs citing Public Sector 1,327 3,550 2,983
As % of all permanent jobs advertised in England 2.69% 3.95% 3.50%
As % of the General category 3.85% 6.81% 5.16%
Number of salaries quoted 668 2,568 1,881
10th Percentile £33,000 £29,750 £32,500
25th Percentile £46,125 £40,988 £41,250
Median annual salary (50th Percentile) £60,000 £55,000 £55,000
Median % change year-on-year +9.09% - -
75th Percentile £73,750 £71,991 £73,751
90th Percentile £92,500 £84,964 £87,500
UK median annual salary £60,000 £55,000 £55,334
% change year-on-year +9.09% -0.60% +0.61%

All General Skills
England

Public Sector falls under the General Skills category. For comparison with the information above, the following table provides summary statistics for all permanent job vacancies requiring common skills in England.

Permanent vacancies with a requirement for common skills 34,488 52,134 57,770
As % of all permanent jobs advertised in England 69.93% 58.04% 67.83%
Number of salaries quoted 16,095 36,062 32,007
10th Percentile £27,500 £27,500 £32,500
25th Percentile £40,000 £36,250 £43,750
Median annual salary (50th Percentile) £55,565 £52,500 £60,000
Median % change year-on-year +5.84% -12.50% -
75th Percentile £76,250 £72,500 £82,500
90th Percentile £100,000 £95,000 £105,000
UK median annual salary £55,000 £52,500 £60,000
% change year-on-year +4.76% -12.50% -

Public Sector
Job Vacancy Trend in England

Job postings citing Public Sector as a proportion of all IT jobs advertised in England.
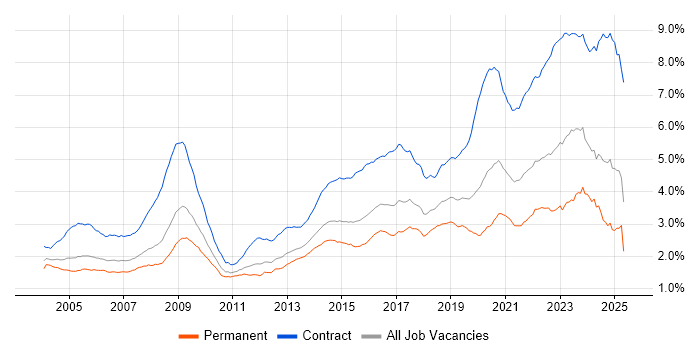
Job vacancy trend for Public Sector in England

Public Sector
Salary Trend in England

3-month moving average salary quoted in jobs citing Public Sector in England.

Salary trend for Public Sector in England

Public Sector
Salary Histogram in England

Salary distribution for jobs citing Public Sector in England over the 6 months to 31 May 2025.

Salary histogram for Public Sector in England

Public Sector
Job Locations in England

The table below looks at the demand and provides a guide to the median salaries quoted in IT jobs citing Public Sector within the England region over the 6 months to 31 May 2025. The 'Rank Change' column provides an indication of the change in demand within each location based on the same 6 month period last year.

Location Rank Change
on Same Period
Last Year
Matching
Permanent
IT Job Ads
Median Salary
Past 6 Months
Median Salary
% Change
on Same Period
Last Year
Live
Jobs
London -19 436 £65,000 +8.33% 776
South East -30 286 £55,000 +5.37% 210
Midlands -51 177 £54,000 +8.00% 220
North of England -173 161 £52,500 -9.43% 343
East of England +52 133 £64,000 +34.74% 51
West Midlands -22 120 £57,500 +4.55% 127
South West +2 111 £62,500 +22.55% 180
Yorkshire -51 85 £49,500 -14.60% 92
North West -200 64 £67,319 +16.14% 197
East Midlands -35 53 £39,919 -15.96% 89
North East -42 11 £55,000 +8.91% 56
Public Sector
UK

Public Sector
Co-occurring Skills and Capabilities in England by Category

The follow tables expand on the table above by listing co-occurrences grouped by category. The same employment type, locality and period is covered with up to 20 co-occurrences shown in each of the following categories:

Application Platforms
1 30 (2.26%) Confluence
2 23 (1.73%) SharePoint
3 14 (1.06%) JBoss
3 14 (1.06%) Microsoft Exchange
3 14 (1.06%) Red Hat Fuse
4 8 (0.60%) Apache Spark
5 5 (0.38%) Apache
5 5 (0.38%) IIS
5 5 (0.38%) nginx
6 3 (0.23%) CMS
6 3 (0.23%) Tomcat
6 3 (0.23%) WordPress
7 2 (0.15%) Apache Airflow
7 2 (0.15%) Oracle Workflow
7 2 (0.15%) Skype for Business
8 1 (0.075%) SAS
Applications
1 36 (2.71%) Microsoft Office
2 33 (2.49%) Microsoft Excel
3 19 (1.43%) Microsoft PowerPoint
4 13 (0.98%) Adobe XD
5 9 (0.68%) Spreadsheet
6 7 (0.53%) AutoCAD
6 7 (0.53%) Microsoft Project
7 6 (0.45%) InVision
7 6 (0.45%) Sketch
8 5 (0.38%) Stata
9 4 (0.30%) Notion
9 4 (0.30%) Oracle Smart View
10 2 (0.15%) Mozilla Thunderbird
10 2 (0.15%) MS Visio
10 2 (0.15%) Trello
11 1 (0.075%) Adobe Illustrator
11 1 (0.075%) InDesign
11 1 (0.075%) Photoshop
11 1 (0.075%) SOLIDWORKS
11 1 (0.075%) SPSS
Business Applications
1 11 (0.83%) Salesforce CRM
2 10 (0.75%) Dynamics CRM
3 8 (0.60%) Oracle ERP
4 4 (0.30%) NetSuite
4 4 (0.30%) Oracle Financials
5 3 (0.23%) Oracle Cash Management
5 3 (0.23%) Oracle EBS
5 3 (0.23%) Oracle General Ledger
5 3 (0.23%) Oracle Payables
5 3 (0.23%) Oracle Receivables
5 3 (0.23%) Shopify
6 2 (0.15%) Infor M3
6 2 (0.15%) Oracle Assets
6 2 (0.15%) SAP ERP
6 2 (0.15%) SAP S/4HANA
6 2 (0.15%) Sparx Enterprise Architect
7 1 (0.075%) Distributed Ledger
7 1 (0.075%) Lorenzo
7 1 (0.075%) SAP HCM
7 1 (0.075%) SystmOne
Cloud Services
1 204 (15.37%) AWS
2 194 (14.62%) Azure
3 73 (5.50%) Serverless
4 71 (5.35%) Power Platform
5 60 (4.52%) SaaS
6 56 (4.22%) GCP
7 46 (3.47%) Amazon EC2
8 43 (3.24%) Azure DevOps
9 41 (3.09%) Microsoft 365
10 35 (2.64%) Amazon CloudWatch
11 34 (2.56%) AWS Lambda
12 32 (2.41%) Amazon SQS
13 31 (2.34%) Amazon ECS
13 31 (2.34%) Amazon S3
14 29 (2.19%) Amazon EKS
14 29 (2.19%) Dynamics 365
14 29 (2.19%) GitHub
15 24 (1.81%) AWS KMS
16 22 (1.66%) Entra ID
16 22 (1.66%) PowerApps
Communications & Networking
1 40 (3.01%) Firewall
2 25 (1.88%) LAN
3 22 (1.66%) WAN
4 21 (1.58%) DNS
5 13 (0.98%) Network Security
6 11 (0.83%) TCP/IP
7 7 (0.53%) VPN
8 6 (0.45%) DHCP
8 6 (0.45%) HTTP
8 6 (0.45%) Unified Communications
8 6 (0.45%) VoIP
8 6 (0.45%) Wireless
9 5 (0.38%) FTP
9 5 (0.38%) MPLS
9 5 (0.38%) SMTP
9 5 (0.38%) SSH
9 5 (0.38%) Wi-Fi
10 4 (0.30%) Ethernet
10 4 (0.30%) Internet
10 4 (0.30%) Intrusion Detection
Database & Business Intelligence
1 90 (6.78%) PostgreSQL
2 58 (4.37%) Relational Database
3 50 (3.77%) Power BI
4 36 (2.71%) NoSQL
5 35 (2.64%) MongoDB
6 33 (2.49%) Amazon RDS
6 33 (2.49%) SQL Server
7 25 (1.88%) Big Data
8 23 (1.73%) RDBMS
9 21 (1.58%) Data Warehouse
9 21 (1.58%) MySQL
10 19 (1.43%) DynamoDB
11 17 (1.28%) Amazon Aurora
11 17 (1.28%) Tableau
12 15 (1.13%) DB2
13 10 (0.75%) Data Lake
14 8 (0.60%) BigQuery
14 8 (0.60%) Metadata
15 7 (0.53%) Amazon Redshift
16 6 (0.45%) GIS
Development Applications
1 68 (5.12%) Jenkins
2 66 (4.97%) Git
3 48 (3.62%) JIRA
4 46 (3.47%) JUnit
5 31 (2.34%) Mockito
6 24 (1.81%) SonarQube
7 18 (1.36%) JMeter
8 16 (1.21%) Maven
9 13 (0.98%) Axure RP
10 11 (0.83%) DbUnit
10 11 (0.83%) GitLab
10 11 (0.83%) jMock
10 11 (0.83%) Vagrant
11 10 (0.75%) Bitbucket Server
12 9 (0.68%) Postman
13 8 (0.60%) Selenium
14 7 (0.53%) Balsamiq
14 7 (0.53%) Bitbucket
14 7 (0.53%) CircleCI
15 6 (0.45%) TeamCity
General
1 606 (45.67%) Social Skills
2 515 (38.81%) Finance
3 392 (29.54%) Marketing
4 180 (13.56%) Inclusion and Diversity
5 126 (9.50%) Analytical Skills
6 104 (7.84%) Telecoms
7 102 (7.69%) Manufacturing
8 88 (6.63%) Electronics
9 72 (5.43%) Local Government
10 51 (3.84%) Law
11 37 (2.79%) Organisational Skills
12 34 (2.56%) Influencing Skills
13 32 (2.41%) Legal
14 28 (2.11%) Presentation Skills
14 28 (2.11%) Retail
15 14 (1.06%) Police
16 11 (0.83%) Aerospace
17 8 (0.60%) Advertising
17 8 (0.60%) Back Office
17 8 (0.60%) Banking
Job Titles
1 278 (20.95%) Business Manager
2 277 (20.87%) Development Manager
3 273 (20.57%) Business Development Manager
4 180 (13.56%) Senior
5 132 (9.95%) Developer
6 94 (7.08%) Lead
7 73 (5.50%) Architect
8 70 (5.28%) Consultant
9 62 (4.67%) Analyst
10 54 (4.07%) DevOps Engineer
11 52 (3.92%) Project Manager
12 47 (3.54%) Java Engineer
13 44 (3.32%) Java Developer
14 40 (3.01%) Infrastructure Engineer
15 36 (2.71%) Senior Java Engineer
16 35 (2.64%) Data Engineer
17 31 (2.34%) Senior Developer
18 28 (2.11%) Solutions Architect
18 28 (2.11%) Support Engineer
19 26 (1.96%) IT Support
Libraries, Frameworks & Software Standards
1 70 (5.28%) RESTful
2 63 (4.75%) REST
3 60 (4.52%) Spring
3 60 (4.52%) Spring Boot
4 50 (3.77%) HTML
5 47 (3.54%) Web Services
6 45 (3.39%) AngularJS
6 45 (3.39%) React
7 41 (3.09%) CSS
8 34 (2.56%) SOAP
9 28 (2.11%) Hibernate
10 27 (2.03%) Apache Camel
10 27 (2.03%) OAuth
11 26 (1.96%) ActiveMQ
11 26 (1.96%) jQuery
12 24 (1.81%) .NET
12 24 (1.81%) Bootstrap
13 22 (1.66%) Kafka
14 20 (1.51%) JWT
15 17 (1.28%) FastAPI
Miscellaneous
1 115 (8.67%) Hybrid Cloud
2 77 (5.80%) e-Learning
3 44 (3.32%) Distributed Systems
3 44 (3.32%) Management Information System
4 42 (3.17%) NHS
5 39 (2.94%) Cloud Native
5 39 (2.94%) Self-Motivation
6 23 (1.73%) Onboarding
7 21 (1.58%) Legacy Systems
8 20 (1.51%) Data Structures
8 20 (1.51%) Product Ownership
8 20 (1.51%) Social Media
9 19 (1.43%) Data Centre
10 16 (1.21%) Algorithms
11 15 (1.13%) Driving Licence
12 13 (0.98%) IoT
13 12 (0.90%) Renewable Energy
14 11 (0.83%) Housing Association
14 11 (0.83%) Public Cloud
14 11 (0.83%) SCADA
Operating Systems
1 80 (6.03%) Windows
2 48 (3.62%) Linux
3 38 (2.86%) Windows Server
4 20 (1.51%) Apple iOS
5 19 (1.43%) Android
6 11 (0.83%) VMS
7 7 (0.53%) Windows 10
8 6 (0.45%) Mac OS
9 5 (0.38%) Amazon Linux
9 5 (0.38%) Unix
9 5 (0.38%) Windows Server 2019
10 4 (0.30%) Windows Server 2012
11 3 (0.23%) Ubuntu
12 2 (0.15%) zOS
13 1 (0.075%) Red Hat Enterprise Linux
13 1 (0.075%) Robot Operating System
13 1 (0.075%) Solaris
13 1 (0.075%) Windows Server 2016
Processes & Methodologies
1 332 (25.02%) Collaborative Working
2 331 (24.94%) Business Development
3 308 (23.21%) Agile
4 303 (22.83%) Collaborative Culture
5 274 (20.65%) Marketing Strategy
6 268 (20.20%) Facilities Management
7 202 (15.22%) Project Management
8 188 (14.17%) Problem-Solving
9 186 (14.02%) Artificial Intelligence
10 181 (13.64%) DevOps
11 163 (12.28%) Mentoring
12 148 (11.15%) Continuous Improvement
13 133 (10.02%) Business Intelligence
14 123 (9.27%) CI/CD
15 118 (8.89%) Coaching
16 113 (8.52%) Analytics
16 113 (8.52%) Project Delivery
17 111 (8.36%) Stakeholder Management
18 103 (7.76%) Programme Management
19 93 (7.01%) Digital Marketing
Programming Languages
1 138 (10.40%) Java
2 135 (10.17%) Python
3 133 (10.02%) SQL
4 83 (6.25%) JavaScript
5 54 (4.07%) C#
6 35 (2.64%) PowerShell
7 28 (2.11%) TypeScript
8 17 (1.28%) Shell Script
9 16 (1.21%) R
10 11 (0.83%) Groovy
11 9 (0.68%) C++
12 8 (0.60%) Apex Code
12 8 (0.60%) Scala
13 7 (0.53%) Ruby
14 6 (0.45%) C
14 6 (0.45%) PHP
15 5 (0.38%) Bash
15 5 (0.38%) T-SQL
16 3 (0.23%) SPARQL
16 3 (0.23%) VBA
Qualifications
1 279 (21.02%) Security Cleared
2 199 (15.00%) SC Cleared
3 143 (10.78%) Degree
4 39 (2.94%) DV Cleared
5 26 (1.96%) CISSP
5 26 (1.96%) Microsoft Certification
6 25 (1.88%) Azure Certification
7 24 (1.81%) PMI Certification
8 23 (1.73%) PMP
9 18 (1.36%) BPSS Clearance
9 18 (1.36%) Master's Degree
10 17 (1.28%) AWS Certification
11 16 (1.21%) DBS Check
12 12 (0.90%) Computer Science Degree
12 12 (0.90%) MCSA
12 12 (0.90%) MCSE
13 11 (0.83%) Chartered Engineer
13 11 (0.83%) HND
13 11 (0.83%) MCP
14 10 (0.75%) A+ Certification
Quality Assurance & Compliance
1 57 (4.30%) QA
2 48 (3.62%) Accessibility
3 39 (2.94%) GDPR
4 28 (2.11%) ISO/IEC 27001
5 26 (1.96%) Data Quality
6 21 (1.58%) Cyber Essentials
7 20 (1.51%) WCAG
8 19 (1.43%) SLA
9 15 (1.13%) Cyber Essentials PLUS
10 13 (0.98%) NCSC
10 13 (0.98%) NIST
11 11 (0.83%) PMO
12 8 (0.60%) GRC
13 7 (0.53%) ISO 9001
14 6 (0.45%) California Consumer Privacy Act
14 6 (0.45%) Def Stans
15 5 (0.38%) SOC 2
16 4 (0.30%) GAAP
16 4 (0.30%) IFRS
16 4 (0.30%) ISO 14001
System Software
1 105 (7.91%) Docker
2 55 (4.14%) Active Directory
3 17 (1.28%) VMware Infrastructure
4 8 (0.60%) DFS Replication
5 6 (0.45%) Postfix
6 5 (0.38%) Firmware
7 3 (0.23%) Embedded Firmware
7 3 (0.23%) Virtual Desktop
7 3 (0.23%) Virtual Servers
8 2 (0.15%) Dovecot
8 2 (0.15%) Hyper-V
8 2 (0.15%) Squid
8 2 (0.15%) VMware ESXi
8 2 (0.15%) vSphere
9 1 (0.075%) Apache Flume
9 1 (0.075%) HDFS
9 1 (0.075%) RHEV
9 1 (0.075%) Virtual Machines
9 1 (0.075%) VMware NSX
Systems Management
1 92 (6.93%) Kubernetes
2 68 (5.12%) Terraform
3 38 (2.86%) Ansible
4 20 (1.51%) Grafana
5 18 (1.36%) Prometheus
6 14 (1.06%) Kibana
7 6 (0.45%) SCCM
7 6 (0.45%) ZABBIX
8 5 (0.38%) Microsoft Intune
9 4 (0.30%) Cisco CUCM
10 3 (0.23%) Functional Safety
10 3 (0.23%) Kustomize
10 3 (0.23%) Nessus
10 3 (0.23%) Packer
10 3 (0.23%) Progress Chef
11 2 (0.15%) Proxmox
11 2 (0.15%) SmoothWall
11 2 (0.15%) vCenter Server
12 1 (0.075%) PaperCut
12 1 (0.075%) VxRail
Vendors
1 175 (13.19%) Microsoft
2 96 (7.23%) SAP
3 89 (6.71%) IBM
4 82 (6.18%) Red Hat
5 70 (5.28%) Oracle
6 57 (4.30%) Salesforce
7 50 (3.77%) Google
8 48 (3.62%) ServiceNow
9 25 (1.88%) VMware
10 24 (1.81%) Databricks
11 21 (1.58%) MuleSoft
12 20 (1.51%) Splunk
13 18 (1.36%) Cisco
14 16 (1.21%) Adobe
14 16 (1.21%) Informatica
15 15 (1.13%) Facebook
15 15 (1.13%) Palantir
16 13 (0.98%) Dynatrace
17 12 (0.90%) Juniper
18 11 (0.83%) Atlassian