IIS Jobs in England

Microsoft Internet Information Services (IIS)
UK > England

The table below provides summary statistics for permanent job vacancies advertised in England requiring IIS skills. It includes a benchmarking guide to the annual salaries offered in vacancies that cited IIS over the 6 months leading up to 26 July 2024, comparing them to the same period in the previous two years.

6 months to
26 Jul 2024
Same period 2023 Same period 2022
Rank 497 506 509
Rank change year-on-year +9 +3 -108
Permanent jobs citing IIS 323 358 996
As % of all permanent jobs advertised in England 0.41% 0.50% 0.68%
As % of the Application Platforms category 4.39% 4.51% 4.95%
Number of salaries quoted 265 299 672
10th Percentile £37,500 £32,500 £35,000
25th Percentile £45,750 £44,750 £40,000
Median annual salary (50th Percentile) £52,500 £58,000 £50,000
Median % change year-on-year -9.48% +16.00% -
75th Percentile £64,750 £71,250 £65,813
90th Percentile £76,250 £87,500 £78,625
UK median annual salary £52,500 £55,000 £50,000
% change year-on-year -4.55% +10.00% -

All Application Platform Skills
England

IIS falls under the Application Platforms category. For comparison with the information above, the following table provides summary statistics for all permanent job vacancies requiring application platform skills in England.

Permanent vacancies with a requirement for application platform skills 7,350 7,935 20,123
As % of all permanent jobs advertised in England 9.38% 11.16% 13.69%
Number of salaries quoted 5,299 6,228 10,569
10th Percentile £29,000 £31,250 £30,000
25th Percentile £37,500 £40,000 £39,750
Median annual salary (50th Percentile) £52,500 £57,500 £55,000
Median % change year-on-year -8.70% +4.55% +4.76%
75th Percentile £80,000 £77,500 £75,000
90th Percentile £122,500 £95,000 £94,400
UK median annual salary £52,500 £55,834 £55,000
% change year-on-year -5.97% +1.52% +4.76%

IIS
Job Vacancy Trend in England

Job postings citing IIS as a proportion of all IT jobs advertised in England.
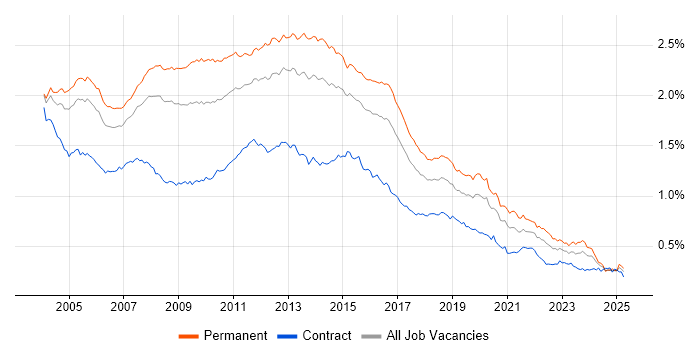
Job vacancy trend for IIS in England

IIS
Salary Trend in England

3-month moving average salary quoted in jobs citing IIS in England.

Salary trend for IIS in England

IIS
Salary Histogram in England

Salary distribution for jobs citing IIS in England over the 6 months to 26 July 2024.

Salary histogram for IIS in England

IIS
Job Locations in England

The table below looks at the demand and provides a guide to the median salaries quoted in IT jobs citing IIS within the England region over the 6 months to 26 July 2024. The 'Rank Change' column provides an indication of the change in demand within each location based on the same 6 month period last year.

Location Rank Change
on Same Period
Last Year
Matching
Permanent
IT Job Ads
Median Salary
Past 6 Months
Median Salary
% Change
on Same Period
Last Year
Live
Jobs
London +32 80 £55,000 -18.52% 6
Midlands +23 76 £50,000 -9.09% 4
North of England +15 69 £57,500 +15.00% 8
South East -34 61 £55,000 -8.33% 10
North West +4 50 £60,000 +9.09% 6
West Midlands +20 42 £52,500 -4.55% 3
East Midlands -7 34 £50,000 - 1
South West +1 22 £61,500 +66.22%
Yorkshire +48 13 £52,500 +5.00% 1
East of England +6 12 £36,000 -52.00% 1
North East -7 6 £35,000 -48.15% 1
IIS
UK

IIS
Co-occurring Skills and Capabilities in England by Category

The follow tables expand on the table above by listing co-occurrences grouped by category. The same employment type, locality and period is covered with up to 20 co-occurrences shown in each of the following categories:

Application Platforms
1 43 (13.31%) Tomcat
2 38 (11.76%) SharePoint
3 37 (11.46%) Umbraco
4 36 (11.15%) Apache
5 34 (10.53%) CMS
6 32 (9.91%) Microsoft Exchange
7 26 (8.05%) Headless CMS
7 26 (8.05%) Kentico
7 26 (8.05%) Sitecore CMS
8 10 (3.10%) WebSphere
9 7 (2.17%) JBoss
9 7 (2.17%) WebLogic
9 7 (2.17%) WildFly
10 5 (1.55%) nginx
10 5 (1.55%) WordPress
11 3 (0.93%) WebSphere Application Server
12 1 (0.31%) Confluence
12 1 (0.31%) IBM Notes
12 1 (0.31%) Moodle
12 1 (0.31%) Tornado
Applications
1 17 (5.26%) Microsoft Office
2 6 (1.86%) Adobe XD
3 3 (0.93%) Adobe Illustrator
3 3 (0.93%) Microsoft Excel
4 1 (0.31%) Autodesk Inventor
4 1 (0.31%) Chatbot
4 1 (0.31%) MS Visio
Business Applications
1 24 (7.43%) NEC Housing
2 7 (2.17%) Teamcenter
3 4 (1.24%) Dynamics CRM
Cloud Services
1 199 (61.61%) Azure
2 97 (30.03%) Azure DevOps
3 48 (14.86%) Microsoft 365
4 31 (9.60%) AWS
5 26 (8.05%) Kontent
6 16 (4.95%) Power Platform
7 14 (4.33%) Entra ID
8 12 (3.72%) IaaS
8 12 (3.72%) SaaS
9 11 (3.41%) GCP
10 9 (2.79%) GitHub
11 7 (2.17%) Google Analytics
11 7 (2.17%) OneDrive
12 6 (1.86%) Cloudflare
12 6 (1.86%) Figma
12 6 (1.86%) PaaS
13 5 (1.55%) GitHub Actions
14 4 (1.24%) Azure AKS
14 4 (1.24%) Azure Monitor
14 4 (1.24%) Azure Service Bus
Communications & Networking
1 89 (27.55%) DNS
2 79 (24.46%) Firewall
3 33 (10.22%) SAN
3 33 (10.22%) SSL
4 32 (9.91%) DHCP
5 28 (8.67%) TCP/IP
6 22 (6.81%) VPN
7 21 (6.50%) WAN
8 14 (4.33%) iSCSI
9 10 (3.10%) Internet
10 9 (2.79%) LAN
11 8 (2.48%) SD-WAN
11 8 (2.48%) Wireless
11 8 (2.48%) WLAN
12 6 (1.86%) Fibre Channel
13 5 (1.55%) FTP
13 5 (1.55%) HTTP
13 5 (1.55%) NAS
14 4 (1.24%) NetScaler
14 4 (1.24%) Wi-Fi
Database & Business Intelligence
1 162 (50.15%) SQL Server
2 32 (9.91%) Oracle Database
3 16 (4.95%) Power BI
4 13 (4.02%) Relational Database
5 11 (3.41%) Amazon RDS
6 8 (2.48%) MySQL
6 8 (2.48%) SQL Server Reporting Services
7 7 (2.17%) SQL Server Integration Services
8 5 (1.55%) Elasticsearch
9 4 (1.24%) Azure SQL Database
9 4 (1.24%) PostgreSQL
9 4 (1.24%) Redis
10 2 (0.62%) Data Warehouse
10 2 (0.62%) NoSQL
11 1 (0.31%) Data Lake
11 1 (0.31%) Firebird
11 1 (0.31%) RDBMS
Development Applications
1 47 (14.55%) Git
2 39 (12.07%) Visual Studio
3 27 (8.36%) Jasmine
3 27 (8.36%) Karma Test Runner
4 20 (6.19%) Octopus Deploy
5 13 (4.02%) JIRA
6 11 (3.41%) TeamCity
7 8 (2.48%) MSBuild
7 8 (2.48%) Team Foundation Server
8 4 (1.24%) Toad
9 3 (0.93%) Bitbucket
9 3 (0.93%) Browser DevTools
9 3 (0.93%) Fiddler
10 2 (0.62%) Jenkins
11 1 (0.31%) Gradle
11 1 (0.31%) SonarQube
11 1 (0.31%) SQL Server Management Studio (SSMS)
11 1 (0.31%) Visual Studio Code
11 1 (0.31%) Vite
11 1 (0.31%) WebDriver
General
1 77 (23.84%) Finance
2 57 (17.65%) Social Skills
3 33 (10.22%) Public Sector
4 27 (8.36%) Law
5 26 (8.05%) Analytical Skills
6 25 (7.74%) Local Government
7 24 (7.43%) Police
8 10 (3.10%) Manufacturing
9 7 (2.17%) Legal
10 6 (1.86%) Aerospace
10 6 (1.86%) Documentation Skills
10 6 (1.86%) Organisational Skills
11 5 (1.55%) Marketing
12 4 (1.24%) Banking
12 4 (1.24%) French Language
12 4 (1.24%) Spanish Language
13 3 (0.93%) Back Office
13 3 (0.93%) Electronics
13 3 (0.93%) Presentation Skills
14 2 (0.62%) Telecoms
Job Titles
1 136 (42.11%) Developer
2 68 (21.05%) C# Developer
3 60 (18.58%) .NET Developer
4 55 (17.03%) Senior
5 50 (15.48%) Applications Support
6 37 (11.46%) Infrastructure Engineer
7 36 (11.15%) C# .NET Developer
8 32 (9.91%) ASP.NET Developer
9 31 (9.60%) Applications Developer
9 31 (9.60%) Senior Developer
10 30 (9.29%) C# ASP.NET Developer
10 30 (9.29%) Senior .NET Developer
11 28 (8.67%) Lead
11 28 (8.67%) Senior ASP.NET Developer
12 27 (8.36%) .NET Applications Developer
13 26 (8.05%) C# Application Developer
13 26 (8.05%) Senior .NET Applications Developer
13 26 (8.05%) Senior Applications Developer
13 26 (8.05%) Senior C# Application Developer
13 26 (8.05%) Senior C# Developer
Libraries, Frameworks & Software Standards
1 159 (49.23%) .NET
2 119 (36.84%) ASP.NET
3 95 (29.41%) REST
4 77 (23.84%) AngularJS
5 76 (23.53%) Web Services
6 67 (20.74%) HTML
7 64 (19.81%) CSS
7 64 (19.81%) React
8 61 (18.89%) JSON
9 56 (17.34%) XML
10 51 (15.79%) ASP.NET MVC
11 46 (14.24%) Twitter Bootstrap
12 42 (13.00%) .NET Core
13 38 (11.76%) .NET Framework
14 35 (10.84%) Sass
15 34 (10.53%) jQuery
15 34 (10.53%) SOAP
16 29 (8.98%) RESTful
17 28 (8.67%) Vue
18 27 (8.36%) RxJS
Miscellaneous
1 57 (17.65%) Self-Motivation
2 32 (9.91%) Public Cloud
3 26 (8.05%) Clustering
4 14 (4.33%) Data Centre
5 12 (3.72%) Replication
6 9 (2.79%) Cloud Native
7 8 (2.48%) Product Ownership
8 6 (1.86%) IoT
8 6 (1.86%) Linux Command Line
8 6 (1.86%) Management Information System
8 6 (1.86%) PKI
8 6 (1.86%) PMI
9 4 (1.24%) Hybrid Cloud
9 4 (1.24%) Legacy Systems
9 4 (1.24%) Team-Oriented Environment
10 3 (0.93%) Distributed Computing
10 3 (0.93%) Distributed Systems
10 3 (0.93%) Driving Licence
10 3 (0.93%) Graphic Design
11 2 (0.62%) CMDB
Operating Systems
1 173 (53.56%) Windows
2 78 (24.15%) Linux
3 74 (22.91%) Windows Server
4 26 (8.05%) Unix
5 25 (7.74%) Solaris
6 22 (6.81%) Windows Server 2016
7 21 (6.50%) VMS
8 12 (3.72%) Windows Server 2019
9 6 (1.86%) Ubuntu
10 4 (1.24%) Windows Server 2008
11 3 (0.93%) Windows 10
12 2 (0.62%) Windows Server 2012
13 1 (0.31%) Android
13 1 (0.31%) Apple iOS
13 1 (0.31%) CentOS
13 1 (0.31%) Mac OS X
Processes & Methodologies
1 116 (35.91%) DevOps
2 71 (21.98%) MVC
3 65 (20.12%) Problem-Solving
4 64 (19.81%) Web Development
5 54 (16.72%) Continuous Integration
6 43 (13.31%) Customer Service
6 43 (13.31%) Infrastructure Engineering
7 39 (12.07%) Agile
8 37 (11.46%) Server Management
9 35 (10.84%) High Availability
9 35 (10.84%) Unit Testing
10 34 (10.53%) CRM
10 34 (10.53%) E-Commerce
11 33 (10.22%) Technical Leadership
12 31 (9.60%) ERP
13 30 (9.29%) Mentoring
13 30 (9.29%) Project Delivery
14 29 (8.98%) Task Automation
15 27 (8.36%) Deployment Automation
15 27 (8.36%) User Acceptance Testing
Programming Languages
1 149 (46.13%) SQL
2 146 (45.20%) C#
3 106 (32.82%) JavaScript
4 63 (19.50%) PowerShell
5 46 (14.24%) T-SQL
6 34 (10.53%) VB.NET
7 30 (9.29%) TypeScript
8 27 (8.36%) VB
8 27 (8.36%) VB6
9 24 (7.43%) Shell Script
10 20 (6.19%) XAML
11 19 (5.88%) Python
12 15 (4.64%) Java
13 7 (2.17%) PL/SQL
13 7 (2.17%) XPath
14 5 (1.55%) Bicep
15 4 (1.24%) Bash
16 3 (0.93%) C
16 3 (0.93%) C++
17 1 (0.31%) Ruby
Qualifications
1 62 (19.20%) Degree
2 38 (11.76%) Security Cleared
3 18 (5.57%) Computer Science Degree
4 8 (2.48%) DV Cleared
5 6 (1.86%) Azure Certification
5 6 (1.86%) PMI Certification
5 6 (1.86%) SC Cleared
6 4 (1.24%) Microsoft Certification
7 3 (0.93%) DBS Check
7 3 (0.93%) Master's Degree
7 3 (0.93%) VMware Certified Professional (VCP)
8 1 (0.31%) CCA
8 1 (0.31%) CCDA
8 1 (0.31%) CCNA
8 1 (0.31%) CISMP
8 1 (0.31%) Citrix Certification
8 1 (0.31%) IISP
8 1 (0.31%) MCSA
8 1 (0.31%) MCSE
8 1 (0.31%) Microsoft Certified Architect
Quality Assurance & Compliance
1 42 (13.00%) QA
2 32 (9.91%) Accessibility
3 6 (1.86%) SLA
4 5 (1.55%) ISO/IEC 27001
5 3 (0.93%) NIST
6 2 (0.62%) GDPR
6 2 (0.62%) PCI DSS
7 1 (0.31%) Cyber Essentials
7 1 (0.31%) HMG Security Policy Framework
7 1 (0.31%) ISO/IEC 27002 (supersedes ISO/IEC 17799)
7 1 (0.31%) JSP 440
7 1 (0.31%) NIST 800
7 1 (0.31%) PMO
7 1 (0.31%) RMADS
System Software
1 86 (26.63%) Active Directory
2 49 (15.17%) VMware Infrastructure
3 21 (6.50%) vSphere
4 18 (5.57%) Hyper-V
5 15 (4.64%) Docker
6 11 (3.41%) Virtual Machines
7 6 (1.86%) Forefront TMG
7 6 (1.86%) VMware Workstation
8 5 (1.55%) Terminal Services
8 5 (1.55%) VMware Server
9 3 (0.93%) Ceph
10 2 (0.62%) VMware ESXi
10 2 (0.62%) VMware NSX
11 1 (0.31%) BitLocker
11 1 (0.31%) DFS Replication
11 1 (0.31%) Firmware
11 1 (0.31%) Virtual Servers
Systems Management
1 19 (5.88%) Kubernetes
2 17 (5.26%) Microsoft Intune
3 15 (4.64%) Active Directory Federation Services
4 14 (4.33%) SCOM
5 13 (4.02%) Microsoft Clustering
6 10 (3.10%) Pingdom
6 10 (3.10%) WSUS
7 8 (2.48%) Terraform
8 7 (2.17%) Ansible
8 7 (2.17%) ZABBIX
9 6 (1.86%) Opsgenie
9 6 (1.86%) SCCM
9 6 (1.86%) VxRail
10 5 (1.55%) SCOrch
11 4 (1.24%) Grafana
11 4 (1.24%) Oracle Enterprise Manager
11 4 (1.24%) Prometheus
11 4 (1.24%) vMotion
12 3 (0.93%) CA Single Sign-On
12 3 (0.93%) N-central
Vendors
1 180 (55.73%) Microsoft
2 58 (17.96%) VMware
3 42 (13.00%) Oracle
4 26 (8.05%) Optimizely
4 26 (8.05%) Sitecore
5 24 (7.43%) NEC
6 16 (4.95%) SolarWinds
7 14 (4.33%) Cisco
8 13 (4.02%) Dell
9 12 (3.72%) Veeam
10 10 (3.10%) Fortinet
11 9 (2.79%) Adobe
11 9 (2.79%) Palo Alto
12 8 (2.48%) Google
12 8 (2.48%) Zerto
13 7 (2.17%) Aruba
13 7 (2.17%) NetApp
14 6 (1.86%) Citrix
15 5 (1.55%) HP
15 5 (1.55%) ProCurve