Systems Administrator Jobs in England

System Administrator (Sysadmin)
UK > England

The median System Administrator (Sysadmin) salary in England is £47,000 per year, according to job vacancies posted during the 6 months leading to 20 September 2024.

The table below provides salary benchmarking and summary statistics, comparing them to the same period in the previous two years.

6 months to
20 Sep 2024
Same period 2023 Same period 2022
Rank 372 420 658
Rank change year-on-year +48 +238 -56
Permanent jobs requiring a Systems Administrator 473 365 517
As % of all permanent jobs advertised in England 0.65% 0.65% 0.40%
As % of the Job Titles category 0.68% 0.69% 0.42%
Number of salaries quoted 338 286 375
10th Percentile £31,250 £26,375 £29,000
25th Percentile £35,000 £34,686 £36,250
Median annual salary (50th Percentile) £47,000 £45,000 £47,500
Median % change year-on-year +4.44% -5.26% +12.48%
75th Percentile £53,750 £62,500 £56,250
90th Percentile £70,000 £68,750 £63,750
UK median annual salary £45,000 £45,000 £46,000
% change year-on-year - -2.17% +15.00%

All Permanent IT Job Vacancies
England

For comparison with the information above, the following table provides summary statistics for all permanent IT job vacancies in England. Most job vacancies include a discernible job title that can be normalized. As such, the figures in the second row provide an indication of the number of permanent jobs in our overall sample.

Permanent vacancies in England with a recognized job title 69,088 53,050 124,485
% of permanent jobs with a recognized job title 95.38% 94.36% 95.61%
Number of salaries quoted 39,631 39,423 73,022
10th Percentile £30,000 £32,500 £32,500
25th Percentile £40,000 £45,000 £44,500
Median annual salary (50th Percentile) £55,000 £60,000 £60,000
Median % change year-on-year -8.33% - +4.35%
75th Percentile £75,000 £80,000 £80,000
90th Percentile £93,750 £100,000 £97,500
UK median annual salary £55,000 £60,000 £60,000
% change year-on-year -8.33% - +9.09%

Systems Administrator
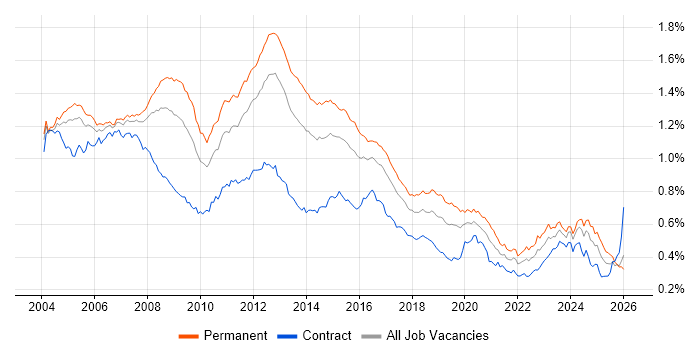
Job Vacancy Trend in England

Job postings that featured Systems Administrator in the job title as a proportion of all IT jobs advertised in England.

Job vacancy trend for Systems Administrator in England

Systems Administrator
Salary Trend in England

3-month moving average salary quoted in jobs citing Systems Administrator in England.

Salary trend for Systems Administrator in England

Systems Administrator
Salary Histogram in England

Salary distribution for jobs citing Systems Administrator in England over the 6 months to 20 September 2024.

Salary histogram for Systems Administrator in England

Systems Administrator
Job Locations in England

The table below looks at the demand and provides a guide to the median salaries quoted in IT jobs citing Systems Administrator within the England region over the 6 months to 20 September 2024. The 'Rank Change' column provides an indication of the change in demand within each location based on the same 6 month period last year.

Location Rank Change
on Same Period
Last Year
Matching
Permanent
IT Job Ads
Median Salary
Past 6 Months
Median Salary
% Change
on Same Period
Last Year
Live
Jobs
London +22 108 £50,000 -9.09% 23
South West +31 98 £50,000 +3.09% 14
South East +8 92 £50,000 +25.00% 14
Midlands +1 74 £40,000 +11.89% 13
North of England +20 72 £35,000 -12.81% 11
East Midlands -10 42 £40,000 +13.48% 4
West Midlands -17 32 £37,500 -1.32% 9
Yorkshire +31 31 £33,750 +3.85% 4
North West -23 27 £45,000 +0.83% 7
East of England -37 25 £40,000 -31.62% 1
North East -11 14 £35,000 -6.14%
Systems Administrator
UK

Systems Administrator Skill Set
Top 30 Co-occurring Skills and Capabilities in England

For the 6 months to 20 September 2024, Systems Administrator job roles required the following skills and capabilities in order of popularity. The figures indicate the absolute number co-occurrences and as a proportion of all permanent job ads across the England region featuring Systems Administrator in the job title.

1 182 (38.48%) Windows
2 120 (25.37%) Microsoft
3 116 (24.52%) Linux
4 106 (22.41%) VMware
4 106 (22.41%) Security Cleared
5 93 (19.66%) VMware Infrastructure
6 92 (19.45%) Active Directory
7 88 (18.60%) Azure
8 78 (16.49%) Microsoft 365
9 69 (14.59%) DV Cleared
10 68 (14.38%) Problem-Solving
11 67 (14.16%) Social Skills
12 61 (12.90%) PKI
13 60 (12.68%) Windows Server
14 55 (11.63%) Degree
14 55 (11.63%) Finance
15 45 (9.51%) Firewall
16 43 (9.09%) AWS
17 40 (8.46%) PowerShell
17 40 (8.46%) Ansible
18 38 (8.03%) DNS
19 37 (7.82%) Python
20 32 (6.77%) VPN
21 31 (6.55%) DHCP
22 30 (6.34%) Microsoft Exchange
22 30 (6.34%) SQL
22 30 (6.34%) Entra ID
22 30 (6.34%) Bash
22 30 (6.34%) Customer Service
23 29 (6.13%) Oracle

Systems Administrator Skill Set
Co-occurring Skills and Capabilities in England by Category

The follow tables expand on the table above by listing co-occurrences grouped by category. The same employment type, locality and period is covered with up to 20 co-occurrences shown in each of the following categories:

Application Platforms
1 30 (6.34%) Microsoft Exchange
2 26 (5.50%) SharePoint
3 9 (1.90%) Confluence
4 7 (1.48%) IIS
5 3 (0.63%) Apache
5 3 (0.63%) OpenStack
6 2 (0.42%) Moodle
7 1 (0.21%) Exchange Server 2010
7 1 (0.21%) Exchange Server 2013
7 1 (0.21%) nginx
7 1 (0.21%) Tomcat
Applications
1 15 (3.17%) Microsoft Office
2 13 (2.75%) Microsoft Excel
3 4 (0.85%) Microsoft PowerPoint
4 1 (0.21%) 1Password
Business Applications
1 10 (2.11%) iTrent
2 6 (1.27%) Oracle HRMS
3 4 (0.85%) Maximo
4 3 (0.63%) Dynamics NAV
5 2 (0.42%) SAP MDM
5 2 (0.42%) SAP PM
6 1 (0.21%) Dynamics CRM
6 1 (0.21%) Magento
Cloud Services
1 88 (18.60%) Azure
2 78 (16.49%) Microsoft 365
3 43 (9.09%) AWS
4 30 (6.34%) Entra ID
5 23 (4.86%) GCP
6 16 (3.38%) Power Platform
7 15 (3.17%) SaaS
8 7 (1.48%) Azure DevOps
9 6 (1.27%) DigitalOcean
9 6 (1.27%) Dynamics 365
10 4 (0.85%) Cloud Computing
10 4 (0.85%) OneDrive
10 4 (0.85%) OpenShift
10 4 (0.85%) PowerApps
10 4 (0.85%) Salesforce Sales Cloud
10 4 (0.85%) Salesforce Service Cloud
10 4 (0.85%) WhatsApp
11 3 (0.63%) Power Automate
12 2 (0.42%) Azure App Service
12 2 (0.42%) Azure Logic Apps
Communications & Networking
1 45 (9.51%) Firewall
2 38 (8.03%) DNS
3 32 (6.77%) VPN
4 31 (6.55%) DHCP
5 25 (5.29%) TCP/IP
5 25 (5.29%) VLAN
6 23 (4.86%) LAN
7 15 (3.17%) SAN
8 14 (2.96%) WAN
9 13 (2.75%) VSAN
9 13 (2.75%) Wi-Fi
10 12 (2.54%) Internet
11 10 (2.11%) Network Security
12 8 (1.69%) Wireless
13 7 (1.48%) NAS
14 5 (1.06%) VoIP
14 5 (1.06%) WLAN
15 4 (0.85%) BGP
15 4 (0.85%) SSL
16 3 (0.63%) Cisco Firepower
Database & Business Intelligence
1 23 (4.86%) SQL Server
2 9 (1.90%) Power BI
3 6 (1.27%) BusinessObjects
4 3 (0.63%) Big Data
4 3 (0.63%) Elasticsearch
4 3 (0.63%) MariaDB
4 3 (0.63%) MySQL
4 3 (0.63%) Relational Database
4 3 (0.63%) SQL Server Reporting Services
5 2 (0.42%) Geospatial Data
6 1 (0.21%) Amazon RDS
6 1 (0.21%) Data Hub
6 1 (0.21%) Data Lake
6 1 (0.21%) MongoDB
6 1 (0.21%) Oracle Database
6 1 (0.21%) Oracle Reports
Development Applications
1 12 (2.54%) Git
2 9 (1.90%) JIRA
3 7 (1.48%) Jenkins
4 5 (1.06%) AdminStudio
5 2 (0.42%) Octopus Deploy
5 2 (0.42%) Subversion
6 1 (0.21%) Bitbucket
General
1 67 (14.16%) Social Skills
2 55 (11.63%) Finance
3 23 (4.86%) Analytical Skills
4 22 (4.65%) Manufacturing
5 19 (4.02%) Retail
6 16 (3.38%) Public Sector
7 12 (2.54%) Marketing
8 11 (2.33%) Telecoms
9 9 (1.90%) Aerospace
10 8 (1.69%) Banking
10 8 (1.69%) Organisational Skills
11 7 (1.48%) Law
11 7 (1.48%) Legal
12 6 (1.27%) Presentation Skills
13 5 (1.06%) Local Government
14 4 (0.85%) Documentation Skills
15 3 (0.63%) Pharmaceutical
16 2 (0.42%) Advertising
16 2 (0.42%) Billing
16 2 (0.42%) Inclusion and Diversity
Libraries, Frameworks & Software Standards
1 11 (2.33%) LDAP
2 10 (2.11%) Oracle Fusion
3 7 (1.48%) REST
4 5 (1.06%) Middleware
4 5 (1.06%) Software Packaging
4 5 (1.06%) XML
5 4 (0.85%) 802.1X
5 4 (0.85%) HTML
5 4 (0.85%) Web Services
5 4 (0.85%) YAML
6 3 (0.63%) .NET
6 3 (0.63%) OpenACC
6 3 (0.63%) OpenMP
6 3 (0.63%) React
7 2 (0.42%) ASP.NET
7 2 (0.42%) ASP.NET MVC
7 2 (0.42%) CSS
7 2 (0.42%) Elastic Stack
7 2 (0.42%) SPFx
7 2 (0.42%) XML Messaging
Miscellaneous
1 61 (12.90%) PKI
2 29 (6.13%) Management Information System
3 23 (4.86%) Data Centre
4 11 (2.33%) Onboarding
5 7 (1.48%) Cyber Threat
5 7 (1.48%) Security Posture
6 5 (1.06%) Cloud Native
6 5 (1.06%) Cyberattack
6 5 (1.06%) Driving Licence
6 5 (1.06%) Self-Motivation
7 4 (0.85%) Client/Server
7 4 (0.85%) Replication
8 3 (0.63%) Algorithms
8 3 (0.63%) CUDA
8 3 (0.63%) HP StoreVirtual
8 3 (0.63%) Linux Command Line
8 3 (0.63%) PropTech
9 2 (0.42%) Bitcoin
9 2 (0.42%) Learning Management System
9 2 (0.42%) Public Cloud
Operating Systems
1 182 (38.48%) Windows
2 116 (24.52%) Linux
3 60 (12.68%) Windows Server
4 23 (4.86%) Red Hat Enterprise Linux
5 20 (4.23%) Unix
6 16 (3.38%) Ubuntu
6 16 (3.38%) Windows 10
7 15 (3.17%) CentOS
7 15 (3.17%) Windows Server 2019
8 10 (2.11%) Mac OS
9 9 (1.90%) Windows Server 2016
10 8 (1.69%) Windows 7
11 7 (1.48%) Windows Server 2012
12 6 (1.27%) Android
13 4 (0.85%) Apple iOS
13 4 (0.85%) Debian
14 3 (0.63%) Solaris
14 3 (0.63%) SUSE Linux Enterprise Server
14 3 (0.63%) VMS
15 2 (0.42%) Windows Server 2008
Processes & Methodologies
1 68 (14.38%) Problem-Solving
2 30 (6.34%) Customer Service
3 29 (6.13%) ITIL
4 28 (5.92%) Agile
4 28 (5.92%) Cybersecurity
5 25 (5.29%) DevOps
5 25 (5.29%) High Availability
6 20 (4.23%) Business Continuity
7 19 (4.02%) Infrastructure Engineering
8 17 (3.59%) Change Management
8 17 (3.59%) Collaborative Working
8 17 (3.59%) Computer Science
8 17 (3.59%) Disaster Recovery
8 17 (3.59%) Infrastructure as Code
9 15 (3.17%) Configuration Management
9 15 (3.17%) Continuous Improvement
9 15 (3.17%) Storage Management
10 14 (2.96%) CI/CD
10 14 (2.96%) Performance Monitoring
10 14 (2.96%) Performance Tuning
Programming Languages
1 40 (8.46%) PowerShell
2 37 (7.82%) Python
3 30 (6.34%) Bash
3 30 (6.34%) SQL
4 17 (3.59%) Perl
5 7 (1.48%) JavaScript
6 5 (1.06%) C++
7 4 (0.85%) Apex Code
7 4 (0.85%) PHP
8 3 (0.63%) C
8 3 (0.63%) C-shell
8 3 (0.63%) Fortran
8 3 (0.63%) Java
8 3 (0.63%) Shell Script
9 2 (0.42%) C#
10 1 (0.21%) Go
10 1 (0.21%) T-SQL
Qualifications
1 106 (22.41%) Security Cleared
2 69 (14.59%) DV Cleared
3 55 (11.63%) Degree
4 18 (3.81%) Computer Science Degree
5 11 (2.33%) Microsoft Certification
6 9 (1.90%) RHCE
6 9 (1.90%) SC Cleared
7 8 (1.69%) RHCSA
8 6 (1.27%) Azure Certification
8 6 (1.27%) BPSS Clearance
8 6 (1.27%) HNC
9 3 (0.63%) Citrix Certification
9 3 (0.63%) ITIL Certification
9 3 (0.63%) VMware Certified Professional (VCP)
10 2 (0.42%) ISO 27001 Lead Auditor
11 1 (0.21%) CompTIA Security+
11 1 (0.21%) ITIL Foundation Certificate
11 1 (0.21%) Linux+ Certification
Quality Assurance & Compliance
1 18 (3.81%) ISO/IEC 27001
2 12 (2.54%) QA
3 9 (1.90%) Cyber Essentials
3 9 (1.90%) SLA
4 5 (1.06%) Cyber Essentials PLUS
4 5 (1.06%) Data Quality
5 4 (0.85%) GRC
5 4 (0.85%) NIST
5 4 (0.85%) NIST 800
6 2 (0.42%) ISO 22301
6 2 (0.42%) ISO 9001
7 1 (0.21%) GDPR
7 1 (0.21%) PMO
System Software
1 93 (19.66%) VMware Infrastructure
2 92 (19.45%) Active Directory
3 23 (4.86%) Hyper-V
4 21 (4.44%) vSphere
5 18 (3.81%) Docker
5 18 (3.81%) VMware ESXi
6 13 (2.75%) Virtual Servers
7 9 (1.90%) VMware NSX
8 8 (1.69%) Virtual Machines
9 5 (1.06%) FreeRADIUS
9 5 (1.06%) Shibboleth
10 3 (0.63%) Ceph
10 3 (0.63%) GPFS
10 3 (0.63%) KVM
10 3 (0.63%) Lustre
10 3 (0.63%) Slurm Workload Manager
10 3 (0.63%) Virtual Desktop
11 2 (0.42%) Microsoft Virtual Server
12 1 (0.21%) Samba
12 1 (0.21%) Xen
Systems Management
1 40 (8.46%) Ansible
2 22 (4.65%) SCCM
3 17 (3.59%) Puppet
4 16 (3.38%) Terraform
5 14 (2.96%) Kubernetes
5 14 (2.96%) Microsoft Intune
6 12 (2.54%) ZABBIX
7 10 (2.11%) WSUS
8 8 (1.69%) Failover Clustering
9 5 (1.06%) Nagios
9 5 (1.06%) vCenter Server
10 4 (0.85%) Microsoft Clustering
11 3 (0.63%) Grafana
11 3 (0.63%) McAfee ePO
11 3 (0.63%) Podman
11 3 (0.63%) Progress Chef
11 3 (0.63%) Prometheus
11 3 (0.63%) SCOM
12 1 (0.21%) EMC VPLEX
12 1 (0.21%) Red Hat Satellite
Vendors
1 120 (25.37%) Microsoft
2 106 (22.41%) VMware
3 29 (6.13%) Oracle
4 24 (5.07%) Red Hat
5 22 (4.65%) Veeam
6 15 (3.17%) Citrix
7 14 (2.96%) Dell
8 13 (2.75%) Apple
9 8 (1.69%) HP
9 8 (1.69%) NetApp
10 6 (1.27%) Cisco
10 6 (1.27%) Google
10 6 (1.27%) IBM
11 5 (1.06%) Epicor
12 4 (0.85%) Databricks
12 4 (0.85%) Dell Compellent
12 4 (0.85%) Okta
12 4 (0.85%) Proofpoint
12 4 (0.85%) Salesforce
12 4 (0.85%) SAP