Change Management Jobs in England

Change Management
UK > England

The table below provides summary statistics for permanent job vacancies advertised in England requiring Change Management skills. It includes a benchmarking guide to the annual salaries offered in vacancies that cited Change Management over the 6 months leading up to 14 May 2025, comparing them to the same period in the previous two years.

6 months to
14 May 2025
Same period 2024 Same period 2023
Rank 106 82 115
Rank change year-on-year -24 +33 +7
Permanent jobs citing Change Management 1,450 2,747 2,699
As % of all permanent jobs advertised in England 2.97% 3.20% 3.00%
As % of the Processes & Methodologies category 3.15% 3.75% 3.13%
Number of salaries quoted 874 1,481 1,695
10th Percentile £7,000 £35,924 £33,600
25th Percentile £33,337 £43,923 £40,250
Median annual salary (50th Percentile) £53,096 £55,000 £55,000
Median % change year-on-year -3.46% - -
75th Percentile £70,000 £72,500 £72,500
90th Percentile £90,000 £87,500 £88,750
UK median annual salary £53,688 £55,000 £55,000
% change year-on-year -2.39% - -

All Process and Methodology Skills
England

Change Management falls under the Processes and Methodologies category. For comparison with the information above, the following table provides summary statistics for all permanent job vacancies requiring process or methodology skills in England.

Permanent vacancies with a requirement for process or methodology skills 45,979 73,257 86,134
As % of all permanent jobs advertised in England 94.14% 85.46% 95.62%
Number of salaries quoted 23,654 53,821 51,155
10th Percentile £30,000 £29,000 £34,324
25th Percentile £42,500 £40,000 £46,000
Median annual salary (50th Percentile) £57,500 £55,000 £62,500
Median % change year-on-year +4.55% -12.00% +4.17%
75th Percentile £76,250 £73,410 £82,500
90th Percentile £100,000 £93,750 £101,250
UK median annual salary £57,500 £55,000 £61,000
% change year-on-year +4.55% -9.84% +1.67%

Change Management
Job Vacancy Trend in England

Job postings citing Change Management as a proportion of all IT jobs advertised in England.
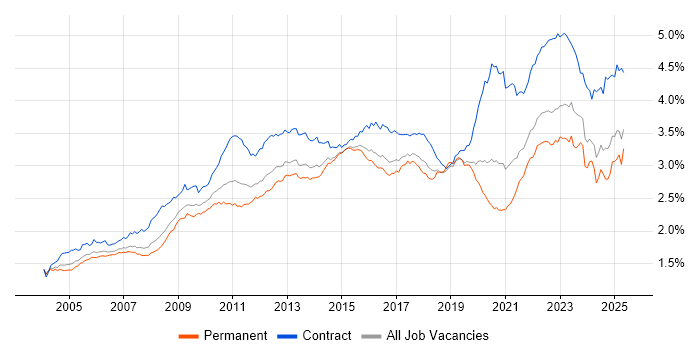
Job vacancy trend for Change Management in England

Change Management
Salary Trend in England

3-month moving average salary quoted in jobs citing Change Management in England.

Salary trend for Change Management in England

Change Management
Salary Histogram in England

Salary distribution for jobs citing Change Management in England over the 6 months to 14 May 2025.

Salary histogram for Change Management in England

Change Management
Job Locations in England

The table below looks at the demand and provides a guide to the median salaries quoted in IT jobs citing Change Management within the England region over the 6 months to 14 May 2025. The 'Rank Change' column provides an indication of the change in demand within each location based on the same 6 month period last year.

Location Rank Change
on Same Period
Last Year
Matching
Permanent
IT Job Ads
Median Salary
Past 6 Months
Median Salary
% Change
on Same Period
Last Year
Live
Jobs
North of England -6 423 £7,000 -86.67% 213
London -26 417 £70,000 -3.45% 655
North West +1 355 £7,000 -86.67% 129
South East -16 234 £57,500 +9.52% 302
Midlands -27 181 £50,000 -4.76% 149
West Midlands -5 140 £50,500 -2.88% 104
East of England -35 110 £50,967 -5.62% 70
South West -18 70 £62,500 +25.00% 99
Yorkshire -12 61 £50,000 -9.09% 55
East Midlands -25 39 £43,750 -18.98% 39
North East -11 7 £50,000 +11.11% 32
Change Management
UK

Change Management
Co-occurring Skills and Capabilities in England by Category

The follow tables expand on the table above by listing co-occurrences grouped by category. The same employment type, locality and period is covered with up to 20 co-occurrences shown in each of the following categories:

Application Platforms
1 54 (3.72%) SharePoint
2 49 (3.38%) Microsoft Exchange
3 32 (2.21%) Confluence
4 22 (1.52%) IIS
5 10 (0.69%) WordPress
6 7 (0.48%) Apache
7 3 (0.21%) Tomcat
8 2 (0.14%) CMS
8 2 (0.14%) Skype for Business
9 1 (0.069%) Adobe Experience Manager
9 1 (0.069%) Apache Airflow
9 1 (0.069%) Blackberry Enterprise Server
9 1 (0.069%) EPiServer
9 1 (0.069%) NetWeaver
9 1 (0.069%) Oracle Workflow
9 1 (0.069%) Tornado
9 1 (0.069%) WebLogic
9 1 (0.069%) WebSphere
Applications
1 101 (6.97%) Microsoft Office
2 56 (3.86%) Microsoft Excel
3 36 (2.48%) MS Visio
4 31 (2.14%) Microsoft PowerPoint
5 17 (1.17%) Microsoft Project
6 12 (0.83%) Trello
7 2 (0.14%) SOLIDWORKS
7 2 (0.14%) Spreadsheet
8 1 (0.069%) AutoCAD
8 1 (0.069%) ProjectWise
Business Applications
1 27 (1.86%) SAP S/4HANA
2 24 (1.66%) Dynamics AX
3 23 (1.59%) NetSuite
4 18 (1.24%) SAP ERP
5 13 (0.90%) Dynamics CRM
6 10 (0.69%) Raiser’s Edge
6 10 (0.69%) Remedy ITSM
7 6 (0.41%) iTrent
7 6 (0.41%) Oracle Applications
7 6 (0.41%) Oracle EBS
8 4 (0.28%) Dynamics NAV
8 4 (0.28%) SAP CO
8 4 (0.28%) SAP FI
8 4 (0.28%) SAP FI/CO
9 3 (0.21%) CA PPM
10 2 (0.14%) Infor M3
10 2 (0.14%) Maximo
10 2 (0.14%) Oracle ERP
10 2 (0.14%) Oracle Financials
10 2 (0.14%) SAP BPC
Cloud Services
1 206 (14.21%) Azure
2 115 (7.93%) Microsoft 365
3 92 (6.34%) AWS
4 67 (4.62%) SaaS
5 58 (4.00%) Power Platform
6 55 (3.79%) Entra ID
7 44 (3.03%) GCP
8 33 (2.28%) Dynamics 365
9 30 (2.07%) Azure Monitor
10 23 (1.59%) Azure DevOps
11 22 (1.52%) PowerApps
12 19 (1.31%) Power Automate
13 17 (1.17%) Azure Logic Apps
14 14 (0.97%) Salsify
15 13 (0.90%) Azure Data Factory
16 12 (0.83%) Google Workspace
16 12 (0.83%) Microsoft Copilot
17 11 (0.76%) npm
17 11 (0.76%) OneDrive
17 11 (0.76%) Virtual Private Cloud
Communications & Networking
1 67 (4.62%) Firewall
2 48 (3.31%) LAN
3 47 (3.24%) WAN
4 44 (3.03%) VPN
5 28 (1.93%) Network Security
6 25 (1.72%) BGP
6 25 (1.72%) DNS
6 25 (1.72%) SD-WAN
7 24 (1.66%) Wireless
8 23 (1.59%) OSPF
9 22 (1.52%) WLAN
10 20 (1.38%) TCP/IP
11 19 (1.31%) IPsec
11 19 (1.31%) Wi-Fi
12 17 (1.17%) Remote Desktop
13 15 (1.03%) Cisco ASA
14 14 (0.97%) DHCP
14 14 (0.97%) MPLS
15 12 (0.83%) Cisco Firepower
15 12 (0.83%) NX-OS
Database & Business Intelligence
1 61 (4.21%) SQL Server
2 33 (2.28%) Data Warehouse
2 33 (2.28%) Power BI
2 33 (2.28%) Relational Database
3 19 (1.31%) Metadata
4 17 (1.17%) Oracle Reports
5 16 (1.10%) NoSQL
6 14 (0.97%) Data Lake
6 14 (0.97%) Tableau
7 10 (0.69%) Big Data
7 10 (0.69%) DB2
8 8 (0.55%) PostgreSQL
8 8 (0.55%) SQL Server Integration Services
9 7 (0.48%) Amazon RDS
9 7 (0.48%) MongoDB
10 5 (0.34%) BusinessObjects
11 4 (0.28%) GIS
11 4 (0.28%) SQL Server Reporting Services
12 3 (0.21%) Electronic Patient Records
12 3 (0.21%) SAP HANA
Development Applications
1 64 (4.41%) JIRA
2 32 (2.21%) Git
3 16 (1.10%) Sonatype Nexus
4 11 (0.76%) Cucumber
4 11 (0.76%) Cypress.io
4 11 (0.76%) webpack
5 10 (0.69%) Jenkins
6 8 (0.55%) Visual Studio
7 5 (0.34%) Vagrant
8 2 (0.14%) Bitbucket
8 2 (0.14%) Postman
9 1 (0.069%) Artifactory
9 1 (0.069%) Atlassian Bamboo
9 1 (0.069%) Eclipse
9 1 (0.069%) NetBeans
9 1 (0.069%) Rational DOORS
9 1 (0.069%) Subversion
General
1 540 (37.24%) Social Skills
2 385 (26.55%) Finance
3 294 (20.28%) Analytical Skills
4 132 (9.10%) Law
5 107 (7.38%) Influencing Skills
6 88 (6.07%) Manufacturing
7 84 (5.79%) Banking
8 79 (5.45%) Legal
9 56 (3.86%) Marketing
10 54 (3.72%) Inclusion and Diversity
11 53 (3.66%) Telecoms
12 51 (3.52%) Retail
13 49 (3.38%) Public Sector
14 39 (2.69%) Electronics
14 39 (2.69%) Organisational Skills
15 27 (1.86%) Presentation Skills
16 25 (1.72%) Games
17 22 (1.52%) Billing
18 21 (1.45%) Local Government
19 20 (1.38%) Pharmaceutical
Job Titles
1 412 (28.41%) Senior
2 323 (22.28%) Analyst
3 210 (14.48%) Senior Manager
4 162 (11.17%) Engineering Manager
5 151 (10.41%) Lead
6 111 (7.66%) Change Analyst
7 96 (6.62%) Project Manager
8 88 (6.07%) Business Change Analyst
9 86 (5.93%) Senior Data Warehouse Specialist
10 80 (5.52%) Engineering Specialist
11 71 (4.90%) Support Analyst
12 56 (3.86%) Senior Systems Engineer
13 52 (3.59%) Business Analyst
14 47 (3.24%) Applications Support
15 45 (3.10%) IT Manager
16 44 (3.03%) Senior Analyst
17 42 (2.90%) Consultant
18 36 (2.48%) Support Manager
19 34 (2.34%) Developer
19 34 (2.34%) Systems Analyst
Libraries, Frameworks & Software Standards
1 27 (1.86%) .NET
2 17 (1.17%) SAP Fiori
2 17 (1.17%) Web Services
3 16 (1.10%) HTML
3 16 (1.10%) RESTful
4 14 (0.97%) CSS
5 11 (0.76%) FIX Protocol
5 11 (0.76%) Jest
5 11 (0.76%) React
5 11 (0.76%) Spring Boot
6 10 (0.69%) JSON
7 9 (0.62%) .NET Framework
7 9 (0.62%) Middleware
8 8 (0.55%) AngularJS
9 7 (0.48%) ASP.NET
9 7 (0.48%) Node.js
10 6 (0.41%) Oracle Fusion
10 6 (0.41%) YAML
11 5 (0.34%) REST
11 5 (0.34%) SOAP
Miscellaneous
1 148 (10.21%) Management Information System
2 50 (3.45%) Onboarding
3 44 (3.03%) Data Centre
4 42 (2.90%) Self-Motivation
5 40 (2.76%) Product Ownership
6 34 (2.34%) Legacy Systems
7 26 (1.79%) Taxonomies
8 23 (1.59%) Blockchain
8 23 (1.59%) FMCG
8 23 (1.59%) Robotics
9 19 (1.31%) Client/Server
10 17 (1.17%) Private Cloud
10 17 (1.17%) Social Media
11 13 (0.90%) Cloud Native
12 12 (0.83%) Virtual Team
13 11 (0.76%) CMDB
13 11 (0.76%) Public Cloud
14 10 (0.69%) Driving Licence
14 10 (0.69%) Hybrid Cloud
14 10 (0.69%) PACS
Operating Systems
1 142 (9.79%) Windows
2 56 (3.86%) Linux
3 44 (3.03%) Windows Server
4 33 (2.28%) Unix
5 19 (1.31%) Windows 10
6 15 (1.03%) Windows Vista
7 14 (0.97%) Apple iOS
8 12 (0.83%) Mac OS
9 10 (0.69%) Red Hat Enterprise Linux
10 5 (0.34%) VMS
10 5 (0.34%) Windows Server 2012
10 5 (0.34%) Windows Server 2019
11 4 (0.28%) Windows Server 2016
12 3 (0.21%) Amazon Linux
12 3 (0.21%) Mac OS X
13 2 (0.14%) SUSE
14 1 (0.069%) Ubuntu
Processes & Methodologies
1 415 (28.62%) Problem-Solving
2 351 (24.21%) Continuous Improvement
3 271 (18.69%) Agile
4 269 (18.55%) ITIL
5 255 (17.59%) Project Management
6 199 (13.72%) Stakeholder Management
7 164 (11.31%) Stakeholder Engagement
7 164 (11.31%) Strategic Thinking
8 158 (10.90%) Project Delivery
9 147 (10.14%) Business Case
10 143 (9.86%) Collaborative Working
11 128 (8.83%) Customer Service
11 128 (8.83%) ITSM
12 124 (8.55%) Business Analysis
13 122 (8.41%) Service Delivery
14 119 (8.21%) Service Management
15 117 (8.07%) Process Improvement
16 116 (8.00%) Incident Management
17 112 (7.72%) Roadmaps
18 111 (7.66%) Workshop Facilitation
Programming Languages
1 126 (8.69%) SQL
2 56 (3.86%) PowerShell
3 46 (3.17%) Python
4 35 (2.41%) T-SQL
5 31 (2.14%) Java
6 29 (2.00%) C#
7 24 (1.66%) JavaScript
8 17 (1.17%) ABAP
9 9 (0.62%) PL/SQL
9 9 (0.62%) Scala
10 8 (0.55%) PHP
10 8 (0.55%) Shell Script
11 7 (0.48%) VB.NET
12 6 (0.41%) R
13 4 (0.28%) C++
13 4 (0.28%) Groovy
13 4 (0.28%) Perl
14 3 (0.21%) TypeScript
14 3 (0.21%) VBA
15 2 (0.14%) Data Analysis Expressions
Qualifications
1 288 (19.86%) BPSS Clearance
2 263 (18.14%) Degree
3 90 (6.21%) CBAP
4 80 (5.52%) HNC
5 63 (4.34%) Security Cleared
6 57 (3.93%) HND
7 36 (2.48%) PMI Certification
8 34 (2.34%) Cisco Certification
9 30 (2.07%) CISA
9 30 (2.07%) PMP
10 29 (2.00%) Microsoft Certification
11 27 (1.86%) Six Sigma Green Belt
12 25 (1.72%) ITIL Certification
12 25 (1.72%) Six Sigma Black Belt
13 24 (1.66%) DBS Check
13 24 (1.66%) Numerate Degree
13 24 (1.66%) SC Cleared
14 22 (1.52%) CCNP
14 22 (1.52%) ISACA
15 18 (1.24%) Computer Science Degree
Quality Assurance & Compliance
1 75 (5.17%) SLA
2 64 (4.41%) QA
3 31 (2.14%) Data Quality
4 30 (2.07%) PMO
5 23 (1.59%) GDPR
6 22 (1.52%) ISO/IEC 27001
6 22 (1.52%) ITGC
7 13 (0.90%) GMP
8 10 (0.69%) Accessibility
8 10 (0.69%) ISO 9001
9 9 (0.62%) NIST
10 8 (0.55%) Sarbanes-Oxley
10 8 (0.55%) WCAG
11 7 (0.48%) Cyber Essentials
11 7 (0.48%) GLP
11 7 (0.48%) GRC
12 4 (0.28%) IFRS
12 4 (0.28%) IFRS 9
12 4 (0.28%) P3O
13 3 (0.21%) PCI DSS
System Software
1 80 (5.52%) Active Directory
2 28 (1.93%) VMware Infrastructure
3 23 (1.59%) Docker
4 19 (1.31%) Firmware
5 8 (0.55%) BitLocker
5 8 (0.55%) Virtual Desktop
6 5 (0.34%) Hyper-V
6 5 (0.34%) Terminal Services
6 5 (0.34%) Veritas Cluster Server
6 5 (0.34%) vSphere
7 4 (0.28%) DFS Replication
8 1 (0.069%) EMC RecoverPoint
8 1 (0.069%) HDFS
8 1 (0.069%) Oracle RAC
8 1 (0.069%) ProxySG
8 1 (0.069%) Virtual Machines
8 1 (0.069%) Virtual Servers
8 1 (0.069%) VMware NSX
Systems Management
1 32 (2.21%) Terraform
2 28 (1.93%) Microsoft Intune
3 18 (1.24%) Ansible
4 14 (0.97%) SCCM
5 10 (0.69%) Grafana
5 10 (0.69%) Prometheus
6 7 (0.48%) Progress Chef
6 7 (0.48%) Puppet
7 6 (0.41%) FortiGate
8 5 (0.34%) Kubernetes
8 5 (0.34%) ZABBIX
9 3 (0.21%) NetBackup
9 3 (0.21%) Single Sign-On
10 2 (0.14%) RSA Archer
10 2 (0.14%) SCOM
10 2 (0.14%) WSUS
11 1 (0.069%) ITRS Geneos
11 1 (0.069%) Nessus
11 1 (0.069%) Norton AntiVirus
11 1 (0.069%) Oracle RMAN
Vendors
1 266 (18.34%) Microsoft
2 108 (7.45%) Oracle
3 94 (6.48%) SAP
4 71 (4.90%) ServiceNow
5 62 (4.28%) Cisco
6 57 (3.93%) Salesforce
7 47 (3.24%) Google
8 42 (2.90%) VMware
9 32 (2.21%) CheckPoint
10 30 (2.07%) SolarWinds
11 25 (1.72%) Meraki
12 20 (1.38%) Apple
13 16 (1.10%) Citrix
14 15 (1.03%) F5
15 13 (0.90%) Fortinet
16 12 (0.83%) HP
17 11 (0.76%) Dynatrace
17 11 (0.76%) Facebook
17 11 (0.76%) Remedy
18 10 (0.69%) Red Hat