Financial Institution Jobs in England

Financial Institution
UK > England

The table below looks at the prevalence of the term Financial Institution in permanent job vacancies in England. Included is a benchmarking guide to the salaries offered in vacancies that cited Financial Institution over the 6 months leading up to 18 July 2025, comparing them to the same period in the previous two years.

6 months to
18 Jul 2025
Same period 2024 Same period 2023
Rank 311 529 391
Rank change year-on-year +218 -138 +14
Permanent jobs citing Financial Institution 486 318 600
As % of all permanent jobs advertised in England 0.93% 0.37% 0.81%
As % of the General category 1.37% 0.64% 1.22%
Number of salaries quoted 168 164 389
10th Percentile £55,000 £37,525 £51,250
25th Percentile £68,750 £52,500 £60,000
Median annual salary (50th Percentile) £82,750 £73,750 £85,000
Median % change year-on-year +12.20% -13.24% +9.68%
75th Percentile £111,250 £107,813 £110,000
90th Percentile £118,750 £122,861 £123,000
UK median annual salary £82,500 £72,500 £85,000
% change year-on-year +13.79% -14.71% +13.33%

All General Skills
England

Financial Institution falls under the General Skills category. For comparison with the information above, the following table provides summary statistics for all permanent job vacancies requiring common skills in England.

Permanent vacancies with a requirement for common skills 35,467 49,963 49,173
As % of all permanent jobs advertised in England 67.56% 57.52% 66.07%
Number of salaries quoted 17,510 32,668 30,530
10th Percentile £27,000 £28,000 £32,000
25th Percentile £37,000 £37,000 £43,184
Median annual salary (50th Percentile) £55,000 £53,205 £60,000
Median % change year-on-year +3.37% -11.33% -
75th Percentile £75,000 £72,500 £82,500
90th Percentile £98,474 £95,000 £105,000
UK median annual salary £54,793 £52,500 £60,000
% change year-on-year +4.37% -12.50% -

Financial Institution
Job Vacancy Trend in England

Job postings citing Financial Institution as a proportion of all IT jobs advertised in England.
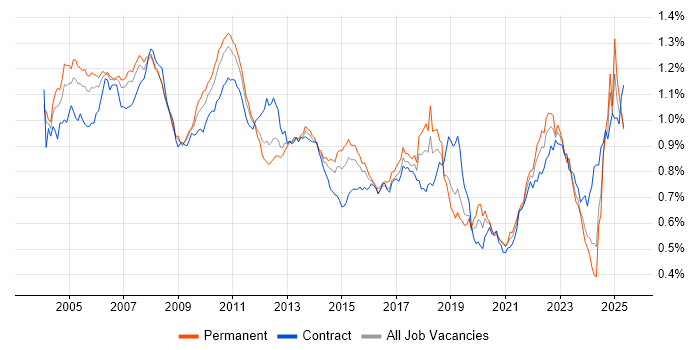
Job vacancy trend for Financial Institution in England

Financial Institution
Salary Trend in England

3-month moving average salary quoted in jobs citing Financial Institution in England.

Salary trend for Financial Institution in England

Financial Institution
Salary Histogram in England

Salary distribution for jobs citing Financial Institution in England over the 6 months to 18 July 2025.

Salary histogram for Financial Institution in England

Financial Institution
Job Locations in England

The table below looks at the demand and provides a guide to the median salaries quoted in IT jobs citing Financial Institution within the England region over the 6 months to 18 July 2025. The 'Rank Change' column provides an indication of the change in demand within each location based on the same 6 month period last year.

Location Rank Change
on Same Period
Last Year
Matching
Permanent
IT Job Ads
Median Salary
Past 6 Months
Median Salary
% Change
on Same Period
Last Year
Live
Jobs
London +162 364 £90,000 +2.73% 532
North of England +72 46 £72,500 +107.14% 45
North West +38 34 £72,500 +107.14% 23
Midlands +95 33 £68,750 +111.54% 28
West Midlands +71 17 £52,500 +61.54% 19
South West +76 16 £59,750 -17.59% 13
East of England +37 16 - - 18
East Midlands - 16 £73,500 - 9
South East +44 11 £56,250 -10.00% 61
Yorkshire - 11 £73,750 - 19
North East +32 1 - - 3
Financial Institution
UK

Financial Institution
Co-occurring Skills and Capabilities in England by Category

The follow tables expand on the table above by listing co-occurrences grouped by category. The same employment type, locality and period is covered with up to 20 co-occurrences shown in each of the following categories:

Application Platforms
1 11 (2.26%) Confluence
2 5 (1.03%) Apache Spark
2 5 (1.03%) SharePoint
3 1 (0.21%) CMS
3 1 (0.21%) SAS
3 1 (0.21%) WordPress
Applications
1 165 (33.95%) Microsoft PowerPoint
2 12 (2.47%) Microsoft Excel
3 6 (1.23%) MS Visio
4 4 (0.82%) Microsoft Office
5 2 (0.41%) Microsoft Project
6 1 (0.21%) Spreadsheet
6 1 (0.21%) SPSS
6 1 (0.21%) SPSS Modeler
6 1 (0.21%) Stata
6 1 (0.21%) Trello
Business Applications
1 4 (0.82%) Dynamics CRM
2 2 (0.41%) Eikon
3 1 (0.21%) BASE24
3 1 (0.21%) RMDS
Cloud Services
1 93 (19.14%) AWS
2 45 (9.26%) Azure
3 30 (6.17%) GCP
4 14 (2.88%) SaaS
5 9 (1.85%) Microsoft 365
6 8 (1.65%) Cloud Computing
7 7 (1.44%) Amazon S3
8 6 (1.23%) Amazon EC2
8 6 (1.23%) AWS Lambda
8 6 (1.23%) GitHub
8 6 (1.23%) Power Platform
8 6 (1.23%) Serverless
9 5 (1.03%) Google Workspace
9 5 (1.03%) Slack
10 4 (0.82%) Azure DevOps
10 4 (0.82%) Dynamics 365
10 4 (0.82%) Figma
10 4 (0.82%) Miro
10 4 (0.82%) npm
10 4 (0.82%) Yarn
Communications & Networking
1 5 (1.03%) Firewall
2 4 (0.82%) Fibre Channel
2 4 (0.82%) Network Security
2 4 (0.82%) Wireless
3 3 (0.62%) VLAN
4 2 (0.41%) Cisco Wireless
4 2 (0.41%) LAN
4 2 (0.41%) OSPF
4 2 (0.41%) SD-WAN
4 2 (0.41%) TCP/IP
4 2 (0.41%) VPN
4 2 (0.41%) WAN
5 1 (0.21%) ATM
5 1 (0.21%) BGP
5 1 (0.21%) DHCP
5 1 (0.21%) DNS
5 1 (0.21%) Ethernet
5 1 (0.21%) Remote Desktop
5 1 (0.21%) WebEx
5 1 (0.21%) WLAN
Database & Business Intelligence
1 23 (4.73%) Data Lake
2 22 (4.53%) Metadata
3 9 (1.85%) Big Data
4 8 (1.65%) MySQL
5 7 (1.44%) PostgreSQL
6 6 (1.23%) Amazon RDS
6 6 (1.23%) Amazon Redshift
6 6 (1.23%) MongoDB
6 6 (1.23%) Relational Database
6 6 (1.23%) SQL Server
7 5 (1.03%) Power BI
7 5 (1.03%) Tableau
8 4 (0.82%) Apache Hive
8 4 (0.82%) Hadoop
9 3 (0.62%) Amazon Aurora
9 3 (0.62%) CockroachDB
9 3 (0.62%) Hazelcast
9 3 (0.62%) NoSQL
10 2 (0.41%) BusinessObjects
10 2 (0.41%) Tableau Desktop
Development Applications
1 23 (4.73%) JIRA
2 16 (3.29%) Jenkins
3 12 (2.47%) Git
4 5 (1.03%) Artifactory
4 5 (1.03%) TeamCity
5 4 (0.82%) Appium
5 4 (0.82%) Balsamiq
5 4 (0.82%) Fiddler
5 4 (0.82%) JMeter
5 4 (0.82%) LoadRunner
5 4 (0.82%) Postman
5 4 (0.82%) Selenium
5 4 (0.82%) webpack
6 3 (0.62%) GitLab
7 1 (0.21%) CircleCI
7 1 (0.21%) JetBrains Rider
7 1 (0.21%) JUnit
7 1 (0.21%) Maven
7 1 (0.21%) VersaTest
7 1 (0.21%) Visual Studio
General
1 486 (100.00%) Finance
2 314 (64.61%) Social Skills
3 266 (54.73%) Banking
4 261 (53.70%) Analytical Skills
5 217 (44.65%) Inclusion and Diversity
6 159 (32.72%) French Language
6 159 (32.72%) German Language
7 76 (15.64%) Law
8 52 (10.70%) Legal
9 26 (5.35%) Retail Banking
10 25 (5.14%) Investment Banking
11 21 (4.32%) Prime Brokerage
12 19 (3.91%) Influencing Skills
13 17 (3.50%) Marketing
14 10 (2.06%) Front Office
15 9 (1.85%) Retail
16 8 (1.65%) Mandarin Language
17 5 (1.03%) Digital Economy
17 5 (1.03%) Documentation Skills
17 5 (1.03%) Organisational Skills
Job Titles
1 186 (38.27%) Analyst
2 157 (32.30%) Credit Analyst
2 157 (32.30%) Research Analyst
3 49 (10.08%) Software Engineer
4 48 (9.88%) Risk Manager
4 48 (9.88%) Senior
5 40 (8.23%) Java Engineer
6 38 (7.82%) Architect
7 37 (7.61%) Java Software Engineer
8 32 (6.58%) Lead
9 26 (5.35%) Credit Risk Manager
10 22 (4.53%) Data Architect
11 18 (3.70%) Senior Software Engineer
12 16 (3.29%) Senior Java Engineer
13 15 (3.09%) Senior Java Software Engineer
14 14 (2.88%) Lead Software Engineer
14 14 (2.88%) Product Owner
15 13 (2.67%) Developer
16 10 (2.06%) Product Manager
17 9 (1.85%) Junior
Libraries, Frameworks & Software Standards
1 40 (8.23%) Spring
2 36 (7.41%) Kafka
2 36 (7.41%) Spring Boot
3 32 (6.58%) AngularJS
4 30 (6.17%) React
5 28 (5.76%) Akka
6 20 (4.12%) RxJava
6 20 (4.12%) Spring WebFlux
7 14 (2.88%) RESTful
8 10 (2.06%) REST
9 6 (1.23%) WebSockets
10 5 (1.03%) .NET
11 4 (0.82%) CSS
11 4 (0.82%) FIX Protocol
11 4 (0.82%) Hibernate
11 4 (0.82%) HTML
11 4 (0.82%) Node.js
11 4 (0.82%) NumPy
11 4 (0.82%) SciPy
11 4 (0.82%) YAML
Miscellaneous
1 185 (38.07%) Credit Risk
2 161 (33.13%) Fixed Income
3 31 (6.38%) Cloud Native
4 28 (5.76%) Hedge funds
4 28 (5.76%) Product Ownership
5 26 (5.35%) Derivative
6 22 (4.53%) Onboarding
7 21 (4.32%) Blockchain
8 14 (2.88%) Self-Motivation
9 10 (2.06%) Distributed Systems
10 8 (1.65%) Virtual Team
11 5 (1.03%) Greenfield Project
11 5 (1.03%) Public Cloud
11 5 (1.03%) Video Conferencing
12 4 (0.82%) Data Centre
12 4 (0.82%) Data Structures
12 4 (0.82%) Enterprise Storage
12 4 (0.82%) Management Information System
13 3 (0.62%) Analytical Mindset
13 3 (0.62%) Cyber Threat
Operating Systems
1 17 (3.50%) Linux
2 7 (1.44%) Windows
3 4 (0.82%) zOS
4 3 (0.62%) Unix
5 2 (0.41%) Red Hat Enterprise Linux
5 2 (0.41%) Windows 10
6 1 (0.21%) Windows Server
Processes & Methodologies
1 239 (49.18%) Risk Management
2 201 (41.36%) Asset Management
3 191 (39.30%) Decision-Making
4 161 (33.13%) Business Strategy
5 160 (32.92%) Portfolio Management
6 158 (32.51%) Risk Assessment
7 157 (32.30%) Credit Risk Analysis
7 157 (32.30%) Financial Modelling
8 130 (26.75%) Agile
9 90 (18.52%) Stakeholder Management
10 66 (13.58%) Fintech
11 65 (13.37%) Problem-Solving
12 61 (12.55%) Software Engineering
13 49 (10.08%) Analytics
13 49 (10.08%) Line Management
14 47 (9.67%) CI/CD
15 46 (9.47%) Roadmaps
16 43 (8.85%) Data Privacy
17 42 (8.64%) Microservices
18 37 (7.61%) DevOps
Programming Languages
1 66 (13.58%) Java
2 37 (7.61%) Python
3 36 (7.41%) SQL
4 23 (4.73%) TypeScript
5 21 (4.32%) JavaScript
6 7 (1.44%) PowerShell
7 5 (1.03%) C#
7 5 (1.03%) Go
8 4 (0.82%) JCL
8 4 (0.82%) PL/SQL
8 4 (0.82%) REXX
9 3 (0.62%) Apex Code
9 3 (0.62%) Bicep
9 3 (0.62%) R
10 2 (0.41%) Bash
10 2 (0.41%) C++
10 2 (0.41%) Perl
11 1 (0.21%) COBOL
11 1 (0.21%) T-SQL
11 1 (0.21%) VBA
Qualifications
1 186 (38.27%) Degree
2 164 (33.74%) Master's Degree
3 158 (32.51%) CFA
4 30 (6.17%) AWS Certification
5 25 (5.14%) Azure Certification
6 8 (1.65%) PMI Certification
7 7 (1.44%) PMP
8 6 (1.23%) PhD
9 4 (0.82%) AWS Certified Solutions Architect
9 4 (0.82%) ISTQB
10 3 (0.62%) CISA
10 3 (0.62%) CISSP
10 3 (0.62%) Microsoft Certification
11 2 (0.41%) CBAP
11 2 (0.41%) HNC
11 2 (0.41%) HND
11 2 (0.41%) ITIL Certification
11 2 (0.41%) JNCIA
11 2 (0.41%) Network+ Certification
11 2 (0.41%) Novell Certification
Quality Assurance & Compliance
1 24 (4.94%) GDPR
2 21 (4.32%) California Consumer Privacy Act
3 10 (2.06%) QA
4 4 (0.82%) ISO/IEC 27001
5 3 (0.62%) Data Quality
6 2 (0.41%) Accessibility
6 2 (0.41%) ISO 20022
6 2 (0.41%) PMO
7 1 (0.21%) Basel III
7 1 (0.21%) COBIT
7 1 (0.21%) Cyber Essentials
7 1 (0.21%) ISO 8583
7 1 (0.21%) MiFID
7 1 (0.21%) NIST
7 1 (0.21%) SLA
7 1 (0.21%) SOC 2
System Software
1 41 (8.44%) Docker
2 6 (1.23%) Active Directory
3 4 (0.82%) Time Sharing Option
4 3 (0.62%) VMware Infrastructure
5 2 (0.41%) Postfix
6 1 (0.21%) Hyper-V
Systems Management
1 47 (9.67%) Kubernetes
2 17 (3.50%) Terraform
3 7 (1.44%) Ansible
4 2 (0.41%) Computer Emergency Response Teams
4 2 (0.41%) CSIRT
4 2 (0.41%) Nagios
4 2 (0.41%) Proxmox
4 2 (0.41%) Puppet
4 2 (0.41%) SCCM
4 2 (0.41%) ZABBIX
5 1 (0.21%) Computer Incident Response Team
5 1 (0.21%) Grafana
5 1 (0.21%) Jamf Pro
Vendors
1 159 (32.72%) Bloomberg
2 42 (8.64%) Microsoft
3 27 (5.56%) Avaloq
4 13 (2.67%) Oracle
5 11 (2.26%) Salesforce
6 10 (2.06%) Google
7 4 (0.82%) Broadcom
7 4 (0.82%) Dell
7 4 (0.82%) IBM
8 3 (0.62%) SAP
8 3 (0.62%) VMware
9 2 (0.41%) Adobe
9 2 (0.41%) Alteryx
9 2 (0.41%) Cisco
9 2 (0.41%) Citrix
9 2 (0.41%) Reuters
9 2 (0.41%) Splunk
10 1 (0.21%) AirMagnet
10 1 (0.21%) Meraki
10 1 (0.21%) ServiceNow