Red Hat Enterprise Linux Job Trends in England

Red Hat Enterprise Linux (RHEL)
UK > England

The table below provides summary statistics and salary benchmarking for jobs advertised in England requiring Red Hat Enterprise Linux skills. It covers permanent job vacancies from the 6 months leading up to 19 November 2025, with comparisons to the same periods in the previous two years.

6 months to
19 Nov 2025
Same period 2024 Same period 2023
Rank 452 485 409
Rank change year-on-year +33 -76 +72
Permanent jobs citing Red Hat Enterprise Linux 161 241 297
As % of all permanent jobs in England 0.35% 0.40% 0.64%
As % of the Operating Systems category 3.28% 2.95% 3.59%
Number of salaries quoted 109 161 233
10th Percentile £46,250 £40,000 £42,500
25th Percentile £52,500 £46,250 £50,000
Median annual salary (50th Percentile) £70,000 £65,465 £65,000
Median % change year-on-year +6.93% +0.71% +12.07%
75th Percentile £85,000 £85,000 £85,000
90th Percentile £100,250 £115,000 £100,000
UK median annual salary £68,000 £65,465 £63,000
% change year-on-year +3.87% +3.91% +6.78%

All Operating Systems
England

Red Hat Enterprise Linux falls under the Operating Systems category. For comparison with the information above, the following table provides summary statistics for all permanent job vacancies requiring operating system skills in England.

Permanent vacancies with a requirement for operating system skills 4,911 8,174 8,276
As % of all permanent jobs advertised in England 10.68% 13.60% 17.76%
Number of salaries quoted 3,719 4,744 6,777
10th Percentile £26,750 £28,500 £27,500
25th Percentile £31,250 £36,250 £34,500
Median annual salary (50th Percentile) £42,500 £50,500 £50,000
Median % change year-on-year -15.84% +1.00% -4.76%
75th Percentile £65,000 £72,500 £68,750
90th Percentile £85,000 £87,500 £88,750
UK median annual salary £42,500 £50,500 £50,000
% change year-on-year -15.84% +1.00% -4.76%

Red Hat Enterprise Linux
Job Vacancy Trend in England

Historical trend showing the proportion of permanent IT job postings citing Red Hat Enterprise Linux relative to all permanent IT jobs advertised in England.
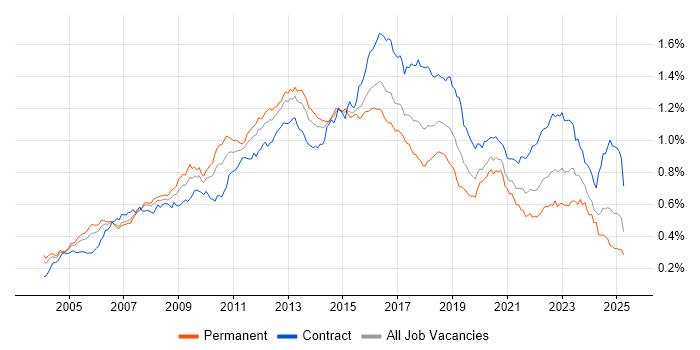
Red Hat Enterprise Linux job vacancy trend in England

Red Hat Enterprise Linux
Salary Trend in England

Salary distribution trend for jobs in England citing Red Hat Enterprise Linux.

Salary distribution trend for jobs in England citing Red Hat Enterprise Linux

Red Hat Enterprise Linux
Salary Histogram in England

Salary distribution for jobs citing Red Hat Enterprise Linux in England over the 6 months to 19 November 2025.

Salary histogram for Red Hat Enterprise Linux in England

Red Hat Enterprise Linux
Job Locations in England

The table below looks at the demand and provides a guide to the median salaries quoted in IT jobs citing Red Hat Enterprise Linux within the England region over the 6 months to 19 November 2025. The 'Rank Change' column provides an indication of the change in demand within each location based on the same 6 month period last year.

Location Rank Change
on Same Period
Last Year
Matching
Permanent
IT Job Ads
Median Salary
Past 6 Months
Median Salary
% Change
on Same Period
Last Year
Live
Jobs
London +60 90 £85,000 - 53
South East +27 36 £60,500 +34.44% 26
East of England +15 12 £43,000 -22.52% 5
North of England +41 9 £65,000 -0.71% 2
South West -8 7 £56,250 -25.00% 6
Midlands +45 6 £57,500 +43.75% 11
East Midlands +19 5 £57,500 +43.75%
Yorkshire +2 5 £65,000 -0.71%
North West +27 4 £60,000 -8.35% 2
West Midlands +41 1 £52,500 -19.80% 11
Red Hat Enterprise Linux
UK

Red Hat Enterprise Linux
Co-Occurring Skills & Capabilities in England by Category

The following tables expand on the one above by listing co-occurrences grouped by category. They cover the same employment type, locality and period, with up to 20 co-occurrences shown in each category:

Application Platforms
1 21 (13.04%) Tomcat
2 20 (12.42%) WebSphere
3 18 (11.18%) Microsoft Exchange
4 16 (9.94%) WebSphere Application Server
5 15 (9.32%) Apache
6 5 (3.11%) Confluence
7 4 (2.48%) IIS
8 3 (1.86%) JBoss
8 3 (1.86%) Skype for Business
9 2 (1.24%) Apache Spark
10 1 (0.62%) nginx
10 1 (0.62%) SharePoint
Cloud Services
1 60 (37.27%) AWS
2 31 (19.25%) Azure
3 21 (13.04%) GitHub
4 17 (10.56%) Microsoft 365
5 15 (9.32%) OpenShift
6 11 (6.83%) Cohesity
7 9 (5.59%) Amazon EKS
7 9 (5.59%) AWS Lambda
7 9 (5.59%) Serverless
8 8 (4.97%) Amazon EC2
8 8 (4.97%) Amazon S3
8 8 (4.97%) AWS CloudFormation
8 8 (4.97%) SaaS
9 7 (4.35%) Route 53
10 6 (3.73%) Amazon ECR
10 6 (3.73%) Virtual Private Cloud
11 5 (3.11%) GCP
12 4 (2.48%) Azure DevOps
13 2 (1.24%) AWS CodeDeploy
14 1 (0.62%) Dynamics 365
Communications & Networking
1 25 (15.53%) Firewall
2 21 (13.04%) SAN
3 17 (10.56%) DNS
3 17 (10.56%) LAN
3 17 (10.56%) SSL
3 17 (10.56%) WAN
4 15 (9.32%) TCP/IP
5 12 (7.45%) Fibre Channel
6 10 (6.21%) DHCP
7 8 (4.97%) iSCSI
7 8 (4.97%) Remote Desktop
8 7 (4.35%) Intrusion Detection
8 7 (4.35%) Multicast
8 7 (4.35%) VSAN
9 3 (1.86%) Skype
10 2 (1.24%) AMQP
10 2 (1.24%) Cisco IOS
10 2 (1.24%) HTTP
10 2 (1.24%) VLAN
10 2 (1.24%) VoIP
Database & Business Intelligence
1 26 (16.15%) PostgreSQL
2 25 (15.53%) SQL Server
3 18 (11.18%) DB2
4 11 (6.83%) MySQL
5 7 (4.35%) Amazon RDS
6 3 (1.86%) Big Data
6 3 (1.86%) MongoDB
7 2 (1.24%) Cloudera CDH
7 2 (1.24%) Hadoop
7 2 (1.24%) Oracle Database
7 2 (1.24%) SAP HANA
Development Applications
1 31 (19.25%) Git
2 16 (9.94%) GitLab
3 8 (4.97%) Jenkins
4 7 (4.35%) JIRA
5 4 (2.48%) Atlassian Bamboo
5 4 (2.48%) Bitbucket
6 3 (1.86%) Ant
6 3 (1.86%) Artifactory
6 3 (1.86%) Maven
6 3 (1.86%) Sonatype Nexus
7 1 (0.62%) MSI
General
1 50 (31.06%) Finance
2 41 (25.47%) Social Skills
3 22 (13.66%) Banking
4 13 (8.07%) Organisational Skills
5 10 (6.21%) Investment Banking
6 7 (4.35%) Front Office
7 4 (2.48%) Advertising
7 4 (2.48%) Analytical Skills
8 3 (1.86%) Aerospace
9 2 (1.24%) Electronics
9 2 (1.24%) Financial Institution
9 2 (1.24%) Military
9 2 (1.24%) Retail
9 2 (1.24%) Telecoms
10 1 (0.62%) Inclusion and Diversity
10 1 (0.62%) Manufacturing
Job Titles
1 46 (28.57%) Linux Engineer
2 36 (22.36%) Administrator
3 27 (16.77%) Linux Support
4 22 (13.66%) Linux Administrator
5 18 (11.18%) Support Engineer
6 17 (10.56%) Applications Support
6 17 (10.56%) Cisco Engineer
6 17 (10.56%) Infrastructure Engineer
6 17 (10.56%) Systems Administrator
7 16 (9.94%) Linux Support Engineer
7 16 (9.94%) Senior
8 15 (9.32%) DevOps Engineer
9 13 (8.07%) Linux DevOps Engineer
9 13 (8.07%) Linux/Unix DevOps
9 13 (8.07%) VMware Engineer
10 12 (7.45%) Infrastructure Support
11 10 (6.21%) Linux Infrastructure Engineer
11 10 (6.21%) Linux Systems Administrator
11 10 (6.21%) Unix Support
12 9 (5.59%) Senior Linux Engineer
Libraries, Frameworks & Software Standards
1 17 (10.56%) LDAP
2 16 (9.94%) LAPP Stack
2 16 (9.94%) WebSphere MQ
3 8 (4.97%) Kafka
3 8 (4.97%) Middleware
4 7 (4.35%) FIX Protocol
5 3 (1.86%) Elastic Stack
5 3 (1.86%) LAMP
6 2 (1.24%) AngularJS
6 2 (1.24%) gRPC
6 2 (1.24%) Material-UI
6 2 (1.24%) Node.js
6 2 (1.24%) OpenAPI
6 2 (1.24%) RabbitMQ
6 2 (1.24%) React
6 2 (1.24%) REST
6 2 (1.24%) Spring
6 2 (1.24%) Spring Boot
6 2 (1.24%) Swagger
7 1 (0.62%) Regular Expression
Miscellaneous
1 28 (17.39%) Management Information System
2 20 (12.42%) Linux Command Line
3 19 (11.80%) Hybrid Cloud
4 12 (7.45%) Cloud Native
5 7 (4.35%) Data Centre
5 7 (4.35%) Derivative
5 7 (4.35%) Driving Licence
6 5 (3.11%) Virtual Team
7 4 (2.48%) Onboarding
7 4 (2.48%) Video on Demand
7 4 (2.48%) Video\Live Streaming
8 3 (1.86%) Blackberry
8 3 (1.86%) Clustering
8 3 (1.86%) PKI
8 3 (1.86%) Replication
8 3 (1.86%) RSA SecurID
9 2 (1.24%) Enterprise Cloud
10 1 (0.62%) Distributed Systems
10 1 (0.62%) FPGA
10 1 (0.62%) Manufacturing Execution System
Operating Systems
1 161 (100.00%) Linux
2 72 (44.72%) Windows
3 39 (24.22%) CentOS
4 34 (21.12%) Unix
5 30 (18.63%) Windows Server
6 26 (16.15%) Windows Server 2019
7 15 (9.32%) Solaris
8 12 (7.45%) Debian
9 9 (5.59%) Oracle Linux
9 9 (5.59%) Ubuntu
10 8 (4.97%) Windows 10
11 7 (4.35%) Windows Server 2016
12 5 (3.11%) HPUX
13 4 (2.48%) AIX
13 4 (2.48%) SUSE Linux Enterprise Server
13 4 (2.48%) Windows Server 2012
14 3 (1.86%) CoreOS
15 2 (1.24%) VMS
16 1 (0.62%) OpenVMS
16 1 (0.62%) SUSE
Processes & Methodologies
1 50 (31.06%) ITIL
2 49 (30.43%) DevOps
3 30 (18.63%) Containerisation
3 30 (18.63%) Root Cause Analysis
4 25 (15.53%) Infrastructure as Code
5 21 (13.04%) Change Management
5 21 (13.04%) Infrastructure Engineering
6 19 (11.80%) Release Management
7 18 (11.18%) Disaster Recovery
8 17 (10.56%) Incident Response
9 16 (9.94%) Low Latency
9 16 (9.94%) User Acceptance Testing
10 14 (8.70%) Continuous Improvement
10 14 (8.70%) Cybersecurity
10 14 (8.70%) Problem-Solving
10 14 (8.70%) Time Management
11 12 (7.45%) Collaborative Working
11 12 (7.45%) Incident Management
11 12 (7.45%) Infrastructure Automation
12 10 (6.21%) Agile
Programming Languages
1 71 (44.10%) Python
2 53 (32.92%) Bash
3 24 (14.91%) PowerShell
4 18 (11.18%) Korn
5 11 (6.83%) PHP
6 8 (4.97%) C++
6 8 (4.97%) Shell Script
7 7 (4.35%) Perl
8 6 (3.73%) Java
9 5 (3.11%) SQL
10 3 (1.86%) Groovy
11 2 (1.24%) JavaScript
12 1 (0.62%) C#
Qualifications
1 35 (21.74%) Security Cleared
2 34 (21.12%) Degree
3 24 (14.91%) DV Cleared
4 22 (13.66%) AWS Certification
5 16 (9.94%) ITIL Certification
6 15 (9.32%) SC Cleared
7 10 (6.21%) Microsoft Certification
8 8 (4.97%) MCSE
8 8 (4.97%) VMware Certified Professional (VCP)
9 7 (4.35%) CCNA
9 7 (4.35%) Cisco Certification
10 6 (3.73%) RHCE
11 5 (3.11%) Computer Science Degree
11 5 (3.11%) RHCSA
12 3 (1.86%) AWS Certified Cloud Practitioner
12 3 (1.86%) AWS Certified SysOps Administrator
13 2 (1.24%) Dell Certification
13 2 (1.24%) ITIL Foundation Certificate
13 2 (1.24%) MCSA
Quality Assurance & Compliance
1 26 (16.15%) SLA
2 9 (5.59%) QA
3 2 (1.24%) Def Stans
4 1 (0.62%) ISO 20022
4 1 (0.62%) SEPA
System Software
1 45 (27.95%) VMware Infrastructure
2 29 (18.01%) Active Directory
3 22 (13.66%) vSphere
4 17 (10.56%) NFS
5 16 (9.94%) Docker
6 11 (6.83%) Hyper-V
7 8 (4.97%) Citrix Hypervisor
8 7 (4.35%) VMware ESXi
9 4 (2.48%) Virtual Machines
10 2 (1.24%) Postfix
11 1 (0.62%) Apache ZooKeeper
11 1 (0.62%) Dovecot
11 1 (0.62%) VMware NSX
Systems Management
1 75 (46.58%) Ansible
2 46 (28.57%) Kubernetes
3 34 (21.12%) Terraform
4 14 (8.70%) Puppet
5 11 (6.83%) WSUS
6 8 (4.97%) Red Hat Satellite
6 8 (4.97%) SCOM
7 6 (3.73%) Progress Chef
7 6 (3.73%) SCCM
8 5 (3.11%) Microsoft Data Protection Manager
8 5 (3.11%) Nagios
9 4 (2.48%) Grafana
9 4 (2.48%) Podman
10 3 (1.86%) McAfee ePO
10 3 (1.86%) SCVMM
11 2 (1.24%) EMC NetWorker
11 2 (1.24%) ZABBIX
12 1 (0.62%) Data Guard
12 1 (0.62%) Red Hat Spacewalk
12 1 (0.62%) WMI
Vendors
1 88 (54.66%) Red Hat
2 69 (42.86%) VMware
3 34 (21.12%) Microsoft
4 33 (20.50%) Cisco
5 23 (14.29%) Commvault
6 22 (13.66%) IBM
6 22 (13.66%) Oracle
7 14 (8.70%) Pure Storage
8 12 (7.45%) Dell
9 11 (6.83%) ServiceNow
10 8 (4.97%) NetApp
10 8 (4.97%) Splunk
11 6 (3.73%) HP
12 5 (3.11%) Atlassian
13 3 (1.86%) McAfee
14 2 (1.24%) EMC
14 2 (1.24%) Fujitsu
14 2 (1.24%) Google
14 2 (1.24%) Juniper
14 2 (1.24%) SAP