Back Office Jobs in England

Back Office
UK > England

The table below looks at the prevalence of the term Back Office in permanent job vacancies in England. Included is a benchmarking guide to the salaries offered in vacancies that cited Back Office over the 6 months leading up to 31 May 2025, comparing them to the same period in the previous two years.

6 months to
31 May 2025
Same period 2024 Same period 2023
Rank 482 417 464
Rank change year-on-year -65 +47 +29
Permanent jobs citing Back Office 201 500 529
As % of all permanent jobs advertised in England 0.41% 0.56% 0.62%
As % of the General category 0.58% 0.96% 0.92%
Number of salaries quoted 152 392 362
10th Percentile £34,000 £27,000 £35,550
25th Percentile £56,529 £37,875 £50,000
Median annual salary (50th Percentile) £73,750 £68,750 £70,000
Median % change year-on-year +7.27% -1.79% +7.69%
75th Percentile £97,500 £93,750 £95,000
90th Percentile £119,750 £112,500 £111,125
UK median annual salary £72,500 £67,500 £70,000
% change year-on-year +7.41% -3.57% +7.69%

All General Skills
England

Back Office falls under the General Skills category. For comparison with the information above, the following table provides summary statistics for all permanent job vacancies requiring common skills in England.

Permanent vacancies with a requirement for common skills 34,488 52,134 57,770
As % of all permanent jobs advertised in England 69.93% 58.04% 67.83%
Number of salaries quoted 16,095 36,062 32,007
10th Percentile £27,500 £27,500 £32,500
25th Percentile £40,000 £36,250 £43,750
Median annual salary (50th Percentile) £55,565 £52,500 £60,000
Median % change year-on-year +5.84% -12.50% -
75th Percentile £76,250 £72,500 £82,500
90th Percentile £100,000 £95,000 £105,000
UK median annual salary £55,000 £52,500 £60,000
% change year-on-year +4.76% -12.50% -

Back Office
Job Vacancy Trend in England

Job postings citing Back Office as a proportion of all IT jobs advertised in England.
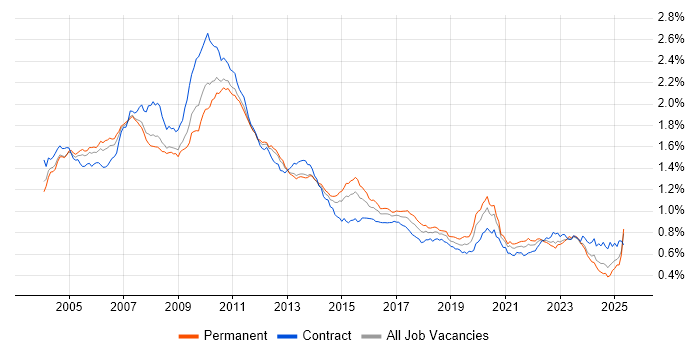
Job vacancy trend for Back Office in England

Back Office
Salary Trend in England

3-month moving average salary quoted in jobs citing Back Office in England.

Salary trend for Back Office in England

Back Office
Salary Histogram in England

Salary distribution for jobs citing Back Office in England over the 6 months to 31 May 2025.

Salary histogram for Back Office in England

Back Office
Job Locations in England

The table below looks at the demand and provides a guide to the median salaries quoted in IT jobs citing Back Office within the England region over the 6 months to 31 May 2025. The 'Rank Change' column provides an indication of the change in demand within each location based on the same 6 month period last year.

Location Rank Change
on Same Period
Last Year
Matching
Permanent
IT Job Ads
Median Salary
Past 6 Months
Median Salary
% Change
on Same Period
Last Year
Live
Jobs
London -34 115 £90,000 +5.88% 232
North of England +20 31 £65,000 +22.47% 38
South East +33 24 £37,500 - 34
South West +121 16 £55,000 - 14
North West -23 16 £65,000 +22.47% 25
Yorkshire +60 12 £65,000 +16.72% 7
Midlands +25 6 £70,000 +150.00% 14
East of England +17 6 £60,394 +28.77% 7
West Midlands +23 5 £70,000 +180.00% 4
North East - 3 £70,000 - 6
East Midlands +36 1 - - 10
Back Office
UK

Back Office
Co-occurring Skills and Capabilities in England by Category

The follow tables expand on the table above by listing co-occurrences grouped by category. The same employment type, locality and period is covered with up to 20 co-occurrences shown in each of the following categories:

Application Platforms
1 24 (11.94%) Microsoft Exchange
2 20 (9.95%) IIS
3 9 (4.48%) CMS
4 7 (3.48%) Confluence
5 6 (2.99%) Apache
6 3 (1.49%) Jupyter
6 3 (1.49%) nginx
6 3 (1.49%) SharePoint
6 3 (1.49%) Umbraco
7 1 (0.50%) ColdFusion
7 1 (0.50%) Oracle Workflow
Applications
1 14 (6.97%) Microsoft Excel
2 12 (5.97%) Microsoft Office
3 3 (1.49%) Microsoft PowerPoint
3 3 (1.49%) Photoshop
4 1 (0.50%) Trello
Business Applications
1 13 (6.47%) Dynamics CRM
2 9 (4.48%) Endur
3 3 (1.49%) Markit EDM
4 2 (1.00%) Aladdin
4 2 (1.00%) Oracle ERP
5 1 (0.50%) Dynamics NAV
5 1 (0.50%) Oracle Assets
5 1 (0.50%) Oracle EBS
5 1 (0.50%) Oracle EBS R12
5 1 (0.50%) Oracle Financials
5 1 (0.50%) Oracle General Ledger
5 1 (0.50%) Oracle Internet Expenses
5 1 (0.50%) Oracle iProcurement
5 1 (0.50%) Oracle Payables
5 1 (0.50%) Oracle Procure-to-Pay
5 1 (0.50%) Oracle Receivables
5 1 (0.50%) SAP ERP
Cloud Services
1 64 (31.84%) Azure
2 29 (14.43%) SaaS
3 23 (11.44%) AWS
4 22 (10.95%) Microsoft 365
5 20 (9.95%) GitHub
6 19 (9.45%) Azure DevOps
7 18 (8.96%) Power Platform
8 13 (6.47%) Dynamics 365
9 9 (4.48%) Entra ID
10 7 (3.48%) Azure Service Bus
11 6 (2.99%) Firebase
12 4 (1.99%) GCP
13 3 (1.49%) Google Workspace
13 3 (1.49%) Mimecast
13 3 (1.49%) npm
13 3 (1.49%) OCI
13 3 (1.49%) OpenShift
14 2 (1.00%) Azure App Service
14 2 (1.00%) Azure Functions
14 2 (1.00%) Serverless
Communications & Networking
1 15 (7.46%) Firewall
2 9 (4.48%) TCP/IP
3 8 (3.98%) DNS
4 7 (3.48%) VPN
5 4 (1.99%) 5G
5 4 (1.99%) Broadband
6 3 (1.49%) Cisco ASA
6 3 (1.49%) DHCP
7 1 (0.50%) Cisco IOS
7 1 (0.50%) Internet
7 1 (0.50%) SSH
Database & Business Intelligence
1 38 (18.91%) SQL Server
2 21 (10.45%) Data Hub
2 21 (10.45%) SQL CLR
3 18 (8.96%) Power BI
4 13 (6.47%) Metadata
5 12 (5.97%) SQL Server Analysis Services
5 12 (5.97%) SQL Server Reporting Services
6 8 (3.98%) MongoDB
6 8 (3.98%) Relational Database
7 7 (3.48%) Redis
8 5 (2.49%) Tableau
9 4 (1.99%) MySQL
9 4 (1.99%) Oracle Database
10 3 (1.49%) Data Lake
10 3 (1.49%) Data Warehouse
10 3 (1.49%) Dremio
11 2 (1.00%) PostgreSQL
11 2 (1.00%) SQL Server Integration Services
12 1 (0.50%) Oracle Reports
Development Applications
1 17 (8.46%) JIRA
2 12 (5.97%) Git
3 5 (2.49%) Octopus Deploy
4 3 (1.49%) Bitbucket
4 3 (1.49%) Visual Studio
4 3 (1.49%) Visual Studio Code
4 3 (1.49%) Vite
5 2 (1.00%) Artifactory
6 1 (0.50%) Cucumber
6 1 (0.50%) JUnit
6 1 (0.50%) Moq
6 1 (0.50%) MSTest
6 1 (0.50%) NUnit
6 1 (0.50%) Oracle Forms
6 1 (0.50%) SpecFlow
6 1 (0.50%) Subversion
6 1 (0.50%) TeamCity
6 1 (0.50%) xUnit.net
General
1 100 (49.75%) Finance
2 58 (28.86%) Social Skills
3 20 (9.95%) Retail
4 18 (8.96%) Front Office
5 15 (7.46%) Analytical Skills
5 15 (7.46%) Banking
5 15 (7.46%) Presentation Skills
6 12 (5.97%) Marketing
7 8 (3.98%) Public Sector
7 8 (3.98%) Telecoms
8 7 (3.48%) Advertising
8 7 (3.48%) Law
9 6 (2.99%) Inclusion and Diversity
10 5 (2.49%) Legal
10 5 (2.49%) Local Government
11 4 (1.99%) Investment Banking
11 4 (1.99%) Military
12 3 (1.49%) Corporate Banking
13 1 (0.50%) German Language
13 1 (0.50%) Manufacturing
Job Titles
1 48 (23.88%) Senior
2 36 (17.91%) Developer
3 27 (13.43%) Analyst
4 23 (11.44%) Senior Developer
5 14 (6.97%) Applications Support
5 14 (6.97%) Project Manager
6 13 (6.47%) Architect
6 13 (6.47%) Development Manager
6 13 (6.47%) Support Engineer
7 12 (5.97%) Applications Manager
7 12 (5.97%) Microsoft Developer
7 12 (5.97%) SaaS Developer
7 12 (5.97%) Senior Microsoft Developer
7 12 (5.97%) Senior SQL Developer
7 12 (5.97%) Software Engineer
7 12 (5.97%) SQL Developer
8 11 (5.47%) Application Development Manager
8 11 (5.47%) Applications Development Manager
8 11 (5.47%) Business Analyst
8 11 (5.47%) Lead
Libraries, Frameworks & Software Standards
1 38 (18.91%) .NET
2 30 (14.93%) .NET Framework
3 20 (9.95%) .NET Core
4 12 (5.97%) HTML
5 11 (5.47%) Entity Framework
6 10 (4.98%) Web Services
7 9 (4.48%) Dapper ORM
8 8 (3.98%) REST
9 6 (2.99%) ASP.NET Web API
9 6 (2.99%) Blazor
9 6 (2.99%) CSS
9 6 (2.99%) FIX Protocol
9 6 (2.99%) Kafka
9 6 (2.99%) Node.js
9 6 (2.99%) RabbitMQ
10 5 (2.49%) React
11 4 (1.99%) jQuery
11 4 (1.99%) WinForms
12 3 (1.49%) ASP.NET
12 3 (1.49%) WCF
Miscellaneous
1 21 (10.45%) Private Cloud
2 14 (6.97%) Onboarding
3 13 (6.47%) Management Information System
4 11 (5.47%) Data Centre
5 9 (4.48%) Team-Oriented Environment
6 8 (3.98%) Derivative
7 6 (2.99%) Driving Licence
7 6 (2.99%) Equities
7 6 (2.99%) Hybrid Cloud
7 6 (2.99%) Operational Technology
7 6 (2.99%) Product Ownership
8 5 (2.49%) Client/Server
9 4 (1.99%) Cloud Native
9 4 (1.99%) Foreign Exchange (FX)
9 4 (1.99%) Greenfield Project
9 4 (1.99%) Handset
9 4 (1.99%) IoT
9 4 (1.99%) Legacy Systems
9 4 (1.99%) Self-Motivation
9 4 (1.99%) Video Conferencing
Operating Systems
1 46 (22.89%) Windows
2 26 (12.94%) Windows Server
3 18 (8.96%) Linux
4 14 (6.97%) Windows 10
5 6 (2.99%) Unix
5 6 (2.99%) Windows Server 2019
6 1 (0.50%) CentOS
6 1 (0.50%) Debian
6 1 (0.50%) Windows Server 2016
Processes & Methodologies
1 50 (24.88%) Agile
2 48 (23.88%) Problem-Solving
3 28 (13.93%) Workflow
4 26 (12.94%) Fintech
5 25 (12.44%) CI/CD
5 25 (12.44%) Infrastructure Engineering
6 24 (11.94%) Data Privacy
6 24 (11.94%) Software Engineering
7 23 (11.44%) Business Intelligence
7 23 (11.44%) Roadmaps
8 22 (10.95%) DevOps
8 22 (10.95%) Wealth Management
9 21 (10.45%) Continuous Improvement
9 21 (10.45%) High Availability
9 21 (10.45%) Migration
9 21 (10.45%) Performance Tuning
10 20 (9.95%) CRM
10 20 (9.95%) Data Management
11 19 (9.45%) Customer Service
12 18 (8.96%) Project Delivery
Programming Languages
1 82 (40.80%) SQL
2 28 (13.93%) Python
3 27 (13.43%) C#
4 16 (7.96%) PowerShell
5 13 (6.47%) T-SQL
6 12 (5.97%) JavaScript
7 7 (3.48%) PHP
7 7 (3.48%) TypeScript
8 5 (2.49%) Bash
8 5 (2.49%) C++
9 3 (1.49%) Java
9 3 (1.49%) PL/SQL
10 1 (0.50%) Bicep
10 1 (0.50%) Shell Script
Qualifications
1 34 (16.92%) Degree
2 9 (4.48%) Computer Science Degree
3 8 (3.98%) SC Cleared
3 8 (3.98%) Security Cleared
4 7 (3.48%) CTC Cleared
5 3 (1.49%) Master's Degree
6 2 (1.00%) MBA
7 1 (0.50%) ACCA
7 1 (0.50%) CIMA
7 1 (0.50%) DBS Check
7 1 (0.50%) MCP
7 1 (0.50%) MCSA
7 1 (0.50%) MCSE
7 1 (0.50%) Microsoft Certification
7 1 (0.50%) Numerate Degree
7 1 (0.50%) PMI Certification
Quality Assurance & Compliance
1 10 (4.98%) SLA
2 4 (1.99%) Accessibility
3 3 (1.49%) Data Quality
4 2 (1.00%) FINRA
4 2 (1.00%) ISO/IEC 27001
4 2 (1.00%) PMO
4 2 (1.00%) QA
5 1 (0.50%) GDPR
5 1 (0.50%) ISO 9001
5 1 (0.50%) NCSC
System Software
1 26 (12.94%) VMware Infrastructure
2 9 (4.48%) Hyper-V
3 7 (3.48%) Active Directory
4 6 (2.99%) Docker
5 3 (1.49%) Samba
6 1 (0.50%) Virtual Machines
Systems Management
1 12 (5.97%) Failover Clustering
2 11 (5.47%) Kubernetes
3 7 (3.48%) Microsoft Intune
3 7 (3.48%) Terraform
4 5 (2.49%) ZABBIX
5 3 (1.49%) Active Directory Federation Services
5 3 (1.49%) Ansible
5 3 (1.49%) SCCM
6 1 (0.50%) Systems Management Server (SMS)
Vendors
1 57 (28.36%) Microsoft
2 26 (12.94%) VMware
3 20 (9.95%) Oracle
4 13 (6.47%) Cisco
4 13 (6.47%) Siebel
5 6 (2.99%) Trayport
6 4 (1.99%) Bloomberg
6 4 (1.99%) Murex
6 4 (1.99%) Red Hat
6 4 (1.99%) Reuters
6 4 (1.99%) ServiceNow
7 3 (1.49%) CheckPoint
7 3 (1.49%) Databricks
7 3 (1.49%) Dell
7 3 (1.49%) LogicMonitor
7 3 (1.49%) Okta
7 3 (1.49%) SAP
7 3 (1.49%) SolarWinds
7 3 (1.49%) Zscaler
8 2 (1.00%) eFront