Security Cleared Jobs in the North of England

Security Clearance
England > North of England

The table below provides summary statistics for permanent job vacancies advertised in the North of England with a requirement for Security Cleared qualifications. It includes a benchmarking guide to the salaries offered over the 6 months leading up to 28 May 2025, comparing them to the same period in the previous two years.

6 months to
28 May 2025
Same period 2024 Same period 2023
Rank 39 41 44
Rank change year-on-year +2 +3 -12
Permanent jobs citing Security Cleared 744 826 1,093
As % of all permanent jobs advertised in the North of England 6.43% 4.56% 6.58%
As % of the Qualifications category 11.21% 21.10% 21.36%
Number of salaries quoted 140 405 325
10th Percentile £38,500 £35,000 £32,700
25th Percentile £47,375 £42,139 £43,162
Median annual salary (50th Percentile) £60,000 £55,000 £60,000
Median % change year-on-year +9.09% -8.33% +20.00%
75th Percentile £74,258 £66,250 £77,500
90th Percentile £95,225 £82,500 £85,750
England median annual salary £60,000 £57,500 £60,000
% change year-on-year +4.35% -4.17% +9.09%

All Academic and Professional Certifications
North of England

Security Cleared falls under the Academic Qualifications and Professional Certifications category. For comparison with the information above, the following table provides summary statistics for all permanent job vacancies requiring academic qualifications or professional certifications in the North of England.

Permanent vacancies requiring academic qualifications or professional certifications 6,636 3,915 5,118
As % of all permanent jobs advertised in the North of England 57.34% 21.62% 30.79%
Number of salaries quoted 2,965 2,700 1,737
10th Percentile £26,750 £26,250 £30,000
25th Percentile £40,748 £35,000 £40,000
Median annual salary (50th Percentile) £50,055 £48,013 £54,882
Median % change year-on-year +4.25% -12.52% +15.54%
75th Percentile £58,943 £62,500 £68,250
90th Percentile £72,500 £79,000 £82,500
England median annual salary £54,793 £54,500 £60,000
% change year-on-year +0.54% -9.17% +9.09%

Security Cleared
Job Vacancy Trend in the North of England

Job postings citing Security Cleared as a proportion of all IT jobs advertised in the North of England.
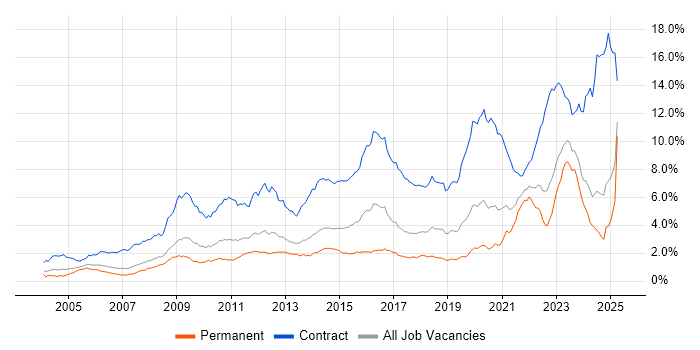
Job vacancy trend for Security Cleared in the North of England

Security Cleared
Salary Trend in the North of England

3-month moving average salary quoted in jobs citing Security Cleared in the North of England.

Salary trend for Security Cleared in the North of England

Security Cleared
Salary Histogram in the North of England

Salary distribution for jobs citing Security Cleared in the North of England over the 6 months to 28 May 2025.

Salary histogram for Security Cleared in the North of England

Security Cleared
Job Locations in the North of England

The table below looks at the demand and provides a guide to the median salaries quoted in IT jobs citing Security Cleared within the North of England region over the 6 months to 28 May 2025. The 'Rank Change' column provides an indication of the change in demand within each location based on the same 6 month period last year.

Location Rank Change
on Same Period
Last Year
Matching
Permanent
IT Job Ads
Median Salary
Past 6 Months
Median Salary
% Change
on Same Period
Last Year
Live
Jobs
North West -1 657 £65,000 +18.99% 284
Yorkshire -24 73 £50,000 -16.67% 162
North East +21 12 £69,384 +26.15% 78
Security Cleared
England

Security Cleared
Co-occurring Skills and Capabilities in the North of England by Category

The follow tables expand on the table above by listing co-occurrences grouped by category. The same employment type, locality and period is covered with up to 20 co-occurrences shown in each of the following categories:

Application Platforms
1 4 (0.54%) Microsoft Exchange
1 4 (0.54%) nginx
2 3 (0.40%) Confluence
3 2 (0.27%) Apache
3 2 (0.27%) Exchange Server 2010
3 2 (0.27%) Skype for Business
4 1 (0.13%) Jupyter
4 1 (0.13%) SharePoint
4 1 (0.13%) SharePoint Server
Applications
1 9 (1.21%) Microsoft Excel
1 9 (1.21%) Microsoft Office
1 9 (1.21%) Microsoft PowerPoint
2 1 (0.13%) GNU Octave
2 1 (0.13%) MS Visio
Business Applications
1 2 (0.27%) Dynamics CRM
2 1 (0.13%) Oracle ERP
2 1 (0.13%) Oracle Payroll
Cloud Services
1 220 (29.57%) Azure
2 202 (27.15%) AWS
3 184 (24.73%) GCP
4 18 (2.42%) Entra ID
5 11 (1.48%) Microsoft 365
6 10 (1.34%) Power Platform
7 9 (1.21%) Dynamics 365
8 8 (1.08%) Serverless
9 7 (0.94%) AWS CloudFormation
9 7 (0.94%) GitHub
9 7 (0.94%) OCI
10 6 (0.81%) Amazon ECR
10 6 (0.81%) Amazon ECS
10 6 (0.81%) Amazon ElastiCache
10 6 (0.81%) Amazon OpenSearch
10 6 (0.81%) AWS CodeBuild
10 6 (0.81%) AWS Lambda
10 6 (0.81%) Cloud Computing
10 6 (0.81%) dbt
10 6 (0.81%) Pulumi
Communications & Networking
1 396 (53.23%) DNS
2 394 (52.96%) VPN
3 19 (2.55%) Firewall
4 13 (1.75%) LAN
5 11 (1.48%) TCP/IP
6 9 (1.21%) Wireless
7 8 (1.08%) Cisco ASA
7 8 (1.08%) Cisco Firepower
7 8 (1.08%) OSPF
8 7 (0.94%) BGP
8 7 (0.94%) IPsec
8 7 (0.94%) Network Security
9 6 (0.81%) DHCP
10 5 (0.67%) EIGRP
10 5 (0.67%) HSRP
11 4 (0.54%) Wi-Fi
12 2 (0.27%) Cisco Nexus
12 2 (0.27%) Reverse Proxy
12 2 (0.27%) Skype
12 2 (0.27%) VLAN
Database & Business Intelligence
1 16 (2.15%) PostgreSQL
2 10 (1.34%) Redis
3 9 (1.21%) Amazon RDS
4 7 (0.94%) MongoDB
4 7 (0.94%) SQL Server
5 6 (0.81%) Elasticsearch
5 6 (0.81%) MySQL
5 6 (0.81%) NoSQL
6 4 (0.54%) Big Data
7 2 (0.27%) Amazon Redshift
7 2 (0.27%) Azure SQL Database
7 2 (0.27%) Data Warehouse
7 2 (0.27%) Flink
7 2 (0.27%) Power BI
7 2 (0.27%) Star Schema
8 1 (0.13%) DynamoDB
8 1 (0.13%) Oracle BI Publisher
8 1 (0.13%) Oracle Exadata
8 1 (0.13%) Oracle ODI
Development Applications
1 17 (2.28%) Git
2 9 (1.21%) Jenkins
3 7 (0.94%) GitLab
4 5 (0.67%) JIRA
5 2 (0.27%) ClearCase
5 2 (0.27%) Rational DOORS
6 1 (0.13%) Eclipse
6 1 (0.13%) JUnit
6 1 (0.13%) NetBeans
6 1 (0.13%) SQL Server Management Studio (SSMS)
6 1 (0.13%) Visual Studio
General
1 581 (78.09%) Inclusion and Diversity
2 417 (56.05%) Finance
3 406 (54.57%) Analytical Skills
4 61 (8.20%) Social Skills
5 29 (3.90%) Public Sector
6 19 (2.55%) Law
7 15 (2.02%) Telecoms
8 14 (1.88%) Aerospace
9 12 (1.61%) Electronics
10 8 (1.08%) Marketing
11 6 (0.81%) Legal
12 5 (0.67%) Military
12 5 (0.67%) Presentation Skills
13 4 (0.54%) Manufacturing
13 4 (0.54%) Organisational Skills
13 4 (0.54%) Police
14 3 (0.40%) Documentation Skills
14 3 (0.40%) Influencing Skills
14 3 (0.40%) Pharmaceutical
14 3 (0.40%) Retail
Job Titles
1 410 (55.11%) Developer
2 391 (52.55%) Software Developer
3 202 (27.15%) Senior
4 188 (25.27%) Software Engineer
5 178 (23.92%) Senior Software Engineer
6 19 (2.55%) Consultant
7 16 (2.15%) Infrastructure Engineer
8 15 (2.02%) Architect
8 15 (2.02%) Support Engineer
9 11 (1.48%) Lead
10 10 (1.34%) Service Desk Engineer
11 9 (1.21%) Infrastructure Support
11 9 (1.21%) Infrastructure Support Engineer
12 8 (1.08%) Principal Engineer
12 8 (1.08%) Senior Consultant
12 8 (1.08%) ServiceNow Consultant
13 7 (0.94%) Network Engineer
14 6 (0.81%) 2nd Line Engineer
14 6 (0.81%) Senior Developer
14 6 (0.81%) Systems Engineer
Libraries, Frameworks & Software Standards
1 182 (24.46%) Node.js
2 175 (23.52%) .NET
3 10 (1.34%) Django
4 9 (1.21%) React
5 6 (0.81%) AngularJS
6 5 (0.67%) REST
6 5 (0.67%) SOAP
7 4 (0.54%) Middleware
7 4 (0.54%) RESTful
7 4 (0.54%) Spring
7 4 (0.54%) Spring Boot
7 4 (0.54%) Vue
7 4 (0.54%) Web Services
8 3 (0.40%) Oracle Fusion
8 3 (0.40%) SailPoint
9 2 (0.27%) FastAPI
9 2 (0.27%) XML
9 2 (0.27%) XSD
10 1 (0.13%) ADO
10 1 (0.13%) OpenTelemetry
Miscellaneous
1 563 (75.67%) Cyberattack
2 183 (24.60%) Self-Motivation
3 172 (23.12%) Linux Command Line
4 15 (2.02%) Data Centre
5 10 (1.34%) Management Information System
6 8 (1.08%) Cloud Native
7 7 (0.94%) Operational Technology
8 6 (0.81%) Device Driver
9 5 (0.67%) CMDB
10 4 (0.54%) Distributed Systems
10 4 (0.54%) Onboarding
11 3 (0.40%) Algorithms
11 3 (0.40%) CCTV
11 3 (0.40%) Private Cloud
12 2 (0.27%) Enterprise Cloud
12 2 (0.27%) Hybrid Cloud
12 2 (0.27%) Low-Code
12 2 (0.27%) PKI
12 2 (0.27%) Smart Energy
13 1 (0.13%) NHS
Operating Systems
1 586 (78.76%) Linux
2 389 (52.28%) Android
3 23 (3.09%) Windows
4 17 (2.28%) Windows Server
5 7 (0.94%) Unix
6 4 (0.54%) Windows 10
7 3 (0.40%) Windows Server 2019
8 2 (0.27%) Windows Server 2016
9 1 (0.13%) AIX
9 1 (0.13%) Apple iOS
9 1 (0.13%) Debian
9 1 (0.13%) Mac OS
9 1 (0.13%) Solaris
9 1 (0.13%) Ubuntu
9 1 (0.13%) Windows Server 2012
Processes & Methodologies
1 591 (79.44%) Agile
2 393 (52.82%) OO
3 391 (52.55%) OOP
4 390 (52.42%) Design Patterns
4 390 (52.42%) Line Management
4 390 (52.42%) Mathematics
5 388 (52.15%) Android Development
6 195 (26.21%) Software Engineering
7 185 (24.87%) Mentoring
8 183 (24.60%) Scrum
9 179 (24.06%) Site Reliability Engineering
10 178 (23.92%) Microservices
11 176 (23.66%) User Experience
12 175 (23.52%) Machine Learning
13 174 (23.39%) Cloud Security
14 172 (23.12%) Data Engineering
15 27 (3.63%) Problem-Solving
16 24 (3.23%) CI/CD
17 23 (3.09%) Cybersecurity
17 23 (3.09%) DevOps
Programming Languages
1 585 (78.63%) Python
2 578 (77.69%) Java
3 568 (76.34%) C++
4 560 (75.27%) Go
5 191 (25.67%) JavaScript
6 173 (23.25%) Rust
7 23 (3.09%) SQL
8 10 (1.34%) TypeScript
9 7 (0.94%) C
10 5 (0.67%) C#
10 5 (0.67%) Kusto Query Language
10 5 (0.67%) MATLAB
10 5 (0.67%) Perl
11 4 (0.54%) R
12 3 (0.40%) Bash
12 3 (0.40%) PowerShell
13 2 (0.27%) Scala
14 1 (0.13%) VB
14 1 (0.13%) VBScript
14 1 (0.13%) X++
Qualifications
1 584 (78.49%) DV Cleared
2 172 (23.12%) AWS Certification
2 172 (23.12%) AWS Certified Developer
2 172 (23.12%) AWS Certified Solutions Architect
3 126 (16.94%) SC Cleared
4 32 (4.30%) Degree
5 7 (0.94%) Master's Degree
6 6 (0.81%) CompTIA CySA+
6 6 (0.81%) Microsoft Certification
7 5 (0.67%) CISSP
7 5 (0.67%) Computer Science Degree
8 4 (0.54%) CCNA
8 4 (0.54%) CISA
8 4 (0.54%) Cisco Certification
8 4 (0.54%) DBS Check
9 3 (0.40%) Chartered Engineer
9 3 (0.40%) PhD
10 2 (0.27%) CCNP
11 1 (0.13%) CCSA
11 1 (0.13%) ITIL Certification
Quality Assurance & Compliance
1 16 (2.15%) ISO/IEC 27001
2 8 (1.08%) NIST
2 8 (1.08%) SLA
3 7 (0.94%) NCSC
4 6 (0.81%) ISO/IEC 27002 (supersedes ISO/IEC 17799)
4 6 (0.81%) QA
5 4 (0.54%) GDPR
6 3 (0.40%) IEC 61508
6 3 (0.40%) ISO 14001
6 3 (0.40%) ISO 9001
7 2 (0.27%) Data Quality
7 2 (0.27%) GRC
7 2 (0.27%) ISO/IEC 27005
8 1 (0.13%) NIST 800
8 1 (0.13%) P3O
8 1 (0.13%) PMBOK
8 1 (0.13%) PMO
System Software
1 406 (54.57%) Docker
2 19 (2.55%) Active Directory
3 5 (0.67%) VMware Infrastructure
4 3 (0.40%) Hyper-V
5 2 (0.27%) Virtual Desktop
5 2 (0.27%) Virtual Servers
6 1 (0.13%) BitLocker
6 1 (0.13%) Firmware
6 1 (0.13%) Microsoft App-V
6 1 (0.13%) VMware NSX
Systems Management
1 390 (52.42%) Ansible
2 12 (1.61%) Terraform
3 9 (1.21%) Kubernetes
4 6 (0.81%) AWS Copilot
5 4 (0.54%) HAProxy
5 4 (0.54%) QRadar
6 3 (0.40%) Functional Safety
6 3 (0.40%) Microsoft Intune
7 2 (0.27%) Prometheus
7 2 (0.27%) SCCM
8 1 (0.13%) Active Directory Federation Services
8 1 (0.13%) Jamf Pro
Vendors
1 43 (5.78%) Microsoft
2 16 (2.15%) ServiceNow
3 15 (2.02%) Oracle
4 11 (1.48%) Cisco
5 8 (1.08%) CheckPoint
5 8 (1.08%) VMware
6 6 (0.81%) AlienVault
6 6 (0.81%) Google
6 6 (0.81%) Palo Alto
7 5 (0.67%) SAP
8 4 (0.54%) Splunk
9 3 (0.40%) BeyondTrust
9 3 (0.40%) Citrix
9 3 (0.40%) CyberArk
9 3 (0.40%) Okta
10 2 (0.27%) Dynatrace
10 2 (0.27%) McAfee
10 2 (0.27%) Red Hat
11 1 (0.13%) Fortinet
11 1 (0.13%) Workday