Reverse Engineering Jobs in the UK excluding London

Reverse Engineering
UK > UK excluding London

The following table provides summary statistics for permanent job vacancies advertised in the UK excluding London with a requirement for Reverse Engineering skills. Included is a benchmarking guide to the salaries offered in vacancies that have cited Reverse Engineering over the 6 months to 13 May 2024 with a comparison to the same period in the previous 2 years.

6 months to
13 May 2024
Same period 2023 Same period 2022
Rank 720 639 714
Rank change year-on-year -81 +75 -90
Permanent jobs citing Reverse Engineering 44 116 126
As % of all permanent jobs advertised in the UK excluding London 0.062% 0.19% 0.18%
As % of the Processes & Methodologies category 0.074% 0.20% 0.19%
Number of salaries quoted 29 62 99
10th Percentile £28,000 £45,000 £36,000
25th Percentile £31,250 £52,438 £52,088
Median annual salary (50th Percentile) £57,500 £72,500 £70,000
Median % change year-on-year -20.69% +3.57% +27.27%
75th Percentile £63,750 £75,000 £100,000
90th Percentile £75,250 £77,500 -
UK median annual salary £75,000 £70,000 £80,000
% change year-on-year +7.14% -12.50% +14.29%

All Process and Methodology Skills
UK excluding London

Reverse Engineering is in the Processes and Methodologies category. The following table is for comparison with the above and provides summary statistics for all permanent job vacancies advertised in the UK excluding London with a requirement for process or methodology skills.

Permanent vacancies with a requirement for process or methodology skills 59,475 57,466 67,334
As % of all permanent jobs advertised in the UK excluding London 83.95% 95.60% 94.10%
Number of salaries quoted 41,116 29,651 41,279
10th Percentile £27,250 £30,500 £30,000
25th Percentile £36,250 £40,000 £38,750
Median annual salary (50th Percentile) £50,000 £55,000 £52,500
Median % change year-on-year -9.09% +4.76% +9.38%
75th Percentile £65,000 £70,000 £67,500
90th Percentile £77,500 £82,500 £80,000
UK median annual salary £55,000 £61,000 £60,000
% change year-on-year -9.84% +1.67% +9.09%

Reverse Engineering
Job Vacancy Trend in the UK excluding London

Job postings citing Reverse Engineering as a proportion of all IT jobs advertised in the UK excluding London.
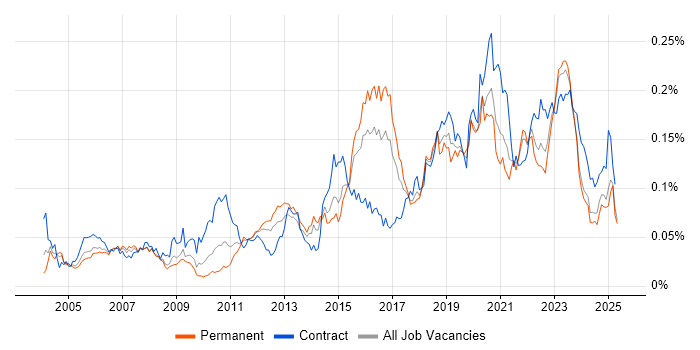
Job vacancy trend for Reverse Engineering in the UK excluding London

Reverse Engineering
Salary Trend in the UK excluding London

3-month moving average salary quoted in jobs citing Reverse Engineering in the UK excluding London.

Salary trend for Reverse Engineering in the UK excluding London

Reverse Engineering
Salary Histogram in the UK excluding London

Salary distribution for jobs citing Reverse Engineering in the UK excluding London over the 6 months to 13 May 2024.

Salary histogram for Reverse Engineering in the UK excluding London

Reverse Engineering
Job Locations in the UK excluding London

The table below looks at the demand and provides a guide to the median salaries quoted in IT jobs citing Reverse Engineering within the UK excluding London region over the 6 months to 13 May 2024. The 'Rank Change' column provides an indication of the change in demand within each location based on the same 6 month period last year.

Location Rank Change
on Same Period
Last Year
Matching
Permanent
IT Job Ads
Median Salary
Past 6 Months
Median Salary
% Change
on Same Period
Last Year
Live
Jobs
North of England +43 19 £60,000 -17.24% 6
Yorkshire - 12 £28,000 -
South East 0 10 £61,250 -18.33% 6
North West -10 10 £62,500 -13.79% 5
Scotland - 8 - - 2
Midlands -11 6 £62,500 -10.71% 9
East of England +17 5 £62,500 -3.85% 3
South West -57 5 £73,750 -1.67% 3
West Midlands +8 4 £62,500 -9.09% 4
North East -3 3 £62,500 -12.28% 1
East Midlands -6 2 £47,500 - 5
Reverse Engineering
UK

Reverse Engineering
Co-occurring Skills and Capabilities in the UK excluding London by Category

The follow tables expand on the table above by listing co-occurrences grouped by category. The same employment type, locality and period is covered with up to 20 co-occurrences shown in each of the following categories:

Application Platforms
1 1 (2.27%) Microsoft Exchange
1 1 (2.27%) SAS
Cloud Services
1 8 (18.18%) SaaS
2 4 (9.09%) Azure
3 1 (2.27%) AWS
3 1 (2.27%) Microsoft 365
Communications & Networking
1 7 (15.91%) Firewall
2 3 (6.82%) BGP
2 3 (6.82%) DMZ
2 3 (6.82%) DNS
2 3 (6.82%) Intrusion Detection
2 3 (6.82%) IPsec
2 3 (6.82%) MPLS
2 3 (6.82%) Network Security
2 3 (6.82%) OSPF
2 3 (6.82%) SD-WAN
2 3 (6.82%) SSL
2 3 (6.82%) VPN
3 2 (4.55%) Internet
3 2 (4.55%) TCP/IP
3 2 (4.55%) Wireless
3 2 (4.55%) Wireless Security
Database & Business Intelligence
1 2 (4.55%) SQL Server
2 1 (2.27%) Data Warehouse
2 1 (2.27%) Metadata
2 1 (2.27%) PostgreSQL
2 1 (2.27%) SAS EBI
Development Applications
1 4 (9.09%) Git
2 3 (6.82%) Visual Studio
3 2 (4.55%) Burp Suite
3 2 (4.55%) Metasploit
3 2 (4.55%) Visual Studio Code
4 1 (2.27%) Eclipse
4 1 (2.27%) Jenkins
4 1 (2.27%) JIRA
4 1 (2.27%) Rational DOORS
4 1 (2.27%) Subversion
General
1 8 (18.18%) Social Skills
2 3 (6.82%) Automotive
2 3 (6.82%) Electronics
2 3 (6.82%) Telecoms
3 2 (4.55%) Analytical Skills
3 2 (4.55%) Finance
3 2 (4.55%) Law
3 2 (4.55%) Presentation Skills
4 1 (2.27%) Billing
4 1 (2.27%) Games
4 1 (2.27%) Inclusion and Diversity
4 1 (2.27%) Manufacturing
4 1 (2.27%) Organisational Skills
4 1 (2.27%) Public Sector
Job Titles
1 13 (29.55%) Software Engineer
2 11 (25.00%) Senior
3 9 (20.45%) Principal Engineer
4 8 (18.18%) Principal Software Engineer
4 8 (18.18%) Senior Software Engineer
4 8 (18.18%) Senior Windows Engineer
4 8 (18.18%) Windows Engineer
5 7 (15.91%) Test Technician
6 4 (9.09%) Developer
7 3 (6.82%) Analyst
7 3 (6.82%) Applications Engineer
7 3 (6.82%) C# Software Engineer
7 3 (6.82%) Firewall Engineer
7 3 (6.82%) Full Stack Developer
7 3 (6.82%) Network Engineer
7 3 (6.82%) Penetration Tester
7 3 (6.82%) Presales Engineer
7 3 (6.82%) Presales Network Engineer
7 3 (6.82%) Vulnerability Researcher
8 2 (4.55%) Full Stack Web Developer
Libraries, Frameworks & Software Standards
1 6 (13.64%) .NET
2 5 (11.36%) .NET Framework
3 4 (9.09%) .NET Core
3 4 (9.09%) REST
4 3 (6.82%) ASP.NET
4 3 (6.82%) CSS
4 3 (6.82%) HTML
5 2 (4.55%) AngularJS
5 2 (4.55%) Entity Framework
5 2 (4.55%) HTML5 Boilerplate
5 2 (4.55%) LINQ
5 2 (4.55%) LINQ to SQL
5 2 (4.55%) Twitter Bootstrap
5 2 (4.55%) Web Services
6 1 (2.27%) Ajax
6 1 (2.27%) MEAN Stack
6 1 (2.27%) MERN Stack
6 1 (2.27%) Node.js
6 1 (2.27%) POSIX
6 1 (2.27%) React
Miscellaneous
1 8 (18.18%) Cloud Native
1 8 (18.18%) Virtual Team
2 4 (9.09%) Algorithms
2 4 (9.09%) Embedded Systems
3 3 (6.82%) Cyber Kill Chain
3 3 (6.82%) PKI
4 2 (4.55%) CCTV
4 2 (4.55%) CPLD
4 2 (4.55%) Cyber Defence
4 2 (4.55%) Cyber Threat
4 2 (4.55%) FPGA
4 2 (4.55%) Mobile App
4 2 (4.55%) Security Posture
5 1 (2.27%) Cyberattack
5 1 (2.27%) Data Structures
5 1 (2.27%) Distributed Systems
5 1 (2.27%) IoT
5 1 (2.27%) Mainframe
5 1 (2.27%) Management Information System
5 1 (2.27%) Self-Motivation
Operating Systems
1 17 (38.64%) Windows
2 12 (27.27%) Linux
3 8 (18.18%) Mac OS
4 4 (9.09%) Android
4 4 (9.09%) Apple iOS
5 3 (6.82%) Unix
6 2 (4.55%) Kali Linux
7 1 (2.27%) FreeBSD
7 1 (2.27%) Mac OS X
7 1 (2.27%) Red Hat Enterprise Linux
Processes & Methodologies
1 19 (43.18%) Cybersecurity
2 14 (31.82%) Software Engineering
3 10 (22.73%) Agile
3 10 (22.73%) Computer Security
3 10 (22.73%) Threat Detection
4 9 (20.45%) Cyber Threat Intelligence
4 9 (20.45%) TDD
4 9 (20.45%) Threat Analysis
4 9 (20.45%) Threat Intelligence
5 8 (18.18%) Analytics
5 8 (18.18%) Component Testing
5 8 (18.18%) Data Science
5 8 (18.18%) Kalman Filter
5 8 (18.18%) Multithreading
5 8 (18.18%) Performance Optimisation
5 8 (18.18%) Problem-Solving
5 8 (18.18%) Security Analytics
5 8 (18.18%) Technical Leadership
5 8 (18.18%) Test Automation
6 7 (15.91%) Incident Response
Programming Languages
1 10 (22.73%) C#
2 8 (18.18%) Python
3 7 (15.91%) SQL
4 5 (11.36%) JavaScript
5 4 (9.09%) Bash
5 4 (9.09%) C
5 4 (9.09%) C++
6 3 (6.82%) Perl
6 3 (6.82%) PowerShell
7 2 (4.55%) T-SQL
7 2 (4.55%) TypeScript
8 1 (2.27%) Java
8 1 (2.27%) PHP
8 1 (2.27%) PL/SQL
8 1 (2.27%) ProC
8 1 (2.27%) Shell Script
Qualifications
1 11 (25.00%) Degree
2 8 (18.18%) Security Cleared
3 5 (11.36%) SC Cleared
4 4 (9.09%) DV Cleared
5 3 (6.82%) OSCP
6 2 (4.55%) CHECK Team Member
6 2 (4.55%) CREST Certified
6 2 (4.55%) GCFA
6 2 (4.55%) GCIH
6 2 (4.55%) Network+ Certification
7 1 (2.27%) CISSP
7 1 (2.27%) Computer Science Degree
7 1 (2.27%) GCFE
7 1 (2.27%) GCIA
7 1 (2.27%) GIAC
7 1 (2.27%) GREM
Quality Assurance & Compliance
1 2 (4.55%) PCI DSS
2 1 (2.27%) Actionable Recommendations
2 1 (2.27%) ISO 13485
2 1 (2.27%) SLA
System Software
1 1 (2.27%) Active Directory
1 1 (2.27%) Docker
1 1 (2.27%) Firmware
Systems Management
1 2 (4.55%) Nmap
2 1 (2.27%) Ansible
2 1 (2.27%) Kubernetes
Vendors
1 8 (18.18%) Dell
2 4 (9.09%) Microsoft
3 3 (6.82%) Fortinet
4 2 (4.55%) LogRhythm
4 2 (4.55%) McAfee
4 2 (4.55%) Oracle