Analytics Jobs in the UK excluding London

Analytics
UK > UK excluding London

The following table provides summary statistics for permanent job vacancies advertised in the UK excluding London with a requirement for Analytics skills. Included is a benchmarking guide to the salaries offered in vacancies that have cited Analytics over the 6 months to 6 December 2023 with a comparison to the same period in the previous 2 years.

6 months to
6 Dec 2023
Same period 2022 Same period 2021
Rank 33 29 33
Rank change year-on-year -4 +4 +28
Permanent jobs citing Analytics 2,141 5,321 4,908
As % of all permanent jobs advertised in the UK excluding London 6.75% 8.01% 7.57%
As % of the Processes & Methodologies category 7.15% 8.38% 7.97%
Number of salaries quoted 1,358 2,319 2,615
10th Percentile £32,750 £35,000 £32,500
25th Percentile £41,500 £43,750 £39,423
Median annual salary (50th Percentile) £56,500 £55,197 £52,500
Median % change year-on-year +2.36% +5.14% -
75th Percentile £71,250 £72,500 £67,500
90th Percentile £86,625 £85,000 £82,500
UK median annual salary £65,000 £65,000 £62,500
% change year-on-year - +4.00% +4.17%

All Process and Methodology Skills
UK excluding London

Analytics is in the Processes and Methodologies category. The following table is for comparison with the above and provides summary statistics for all permanent job vacancies advertised in the UK excluding London with a requirement for process or methodology skills.

Permanent vacancies with a requirement for process or methodology skills 29,926 63,487 61,556
As % of all permanent jobs advertised in the UK excluding London 94.31% 95.55% 94.90%
Number of salaries quoted 20,430 36,275 41,959
10th Percentile £28,500 £30,822 £29,750
25th Percentile £38,750 £40,000 £37,500
Median annual salary (50th Percentile) £52,500 £53,500 £50,000
Median % change year-on-year -1.87% +7.00% +4.17%
75th Percentile £67,500 £69,313 £65,000
90th Percentile £81,250 £83,744 £78,750
UK median annual salary £60,000 £60,500 £60,000
% change year-on-year -0.83% +0.83% +9.09%

Analytics
Job Vacancy Trend in the UK excluding London

Job postings citing Analytics as a proportion of all IT jobs advertised in the UK excluding London.
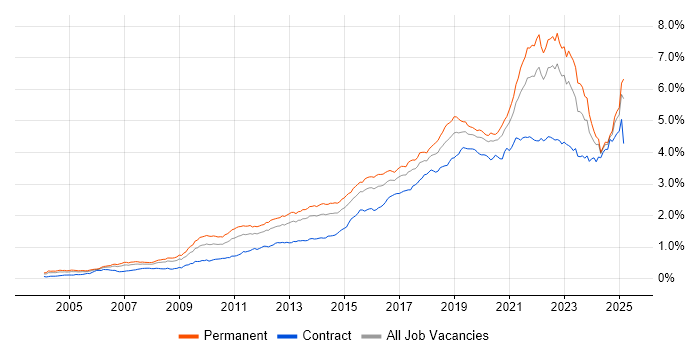
Job vacancy trend for Analytics in the UK excluding London

Analytics
Salary Trend in the UK excluding London

3-month moving average salary quoted in jobs citing Analytics in the UK excluding London.

Salary trend for Analytics in the UK excluding London

Analytics
Salary Histogram in the UK excluding London

Salary distribution for jobs citing Analytics in the UK excluding London over the 6 months to 6 December 2023.

Salary histogram for Analytics in the UK excluding London

Analytics
Job Locations in the UK excluding London

The table below looks at the demand and provides a guide to the median salaries quoted in IT jobs citing Analytics within the UK excluding London region over the 6 months to 6 December 2023. The 'Rank Change' column provides an indication of the change in demand within each location based on the same 6 month period last year.

Location Rank Change
on Same Period
Last Year
Matching
Permanent
IT Job Ads
Median Salary
Past 6 Months
Median Salary
% Change
on Same Period
Last Year
Live
Jobs
North of England +6 682 £57,500 +1.94% 386
South East -5 425 £57,500 -4.17% 366
North West +8 360 £55,000 - 237
South West +7 338 £59,556 +8.28% 121
Yorkshire 0 306 £59,556 -8.38% 110
Midlands -24 248 £53,250 +2.40% 228
Scotland -8 240 £59,556 +8.28% 85
West Midlands -16 175 £53,125 +6.25% 158
Wales +2 92 £44,710 -14.84% 41
East of England -18 73 £56,000 -2.61% 89
East Midlands -30 73 £55,000 -4.35% 70
Northern Ireland -5 46 £68,750 +37.50% 12
North East +5 16 £50,500 -8.18% 45
Analytics
UK

Analytics
Co-occurring Skills and Capabilities in the UK excluding London by Category

The follow tables expand on the table above by listing co-occurrences grouped by category. The same employment type, locality and period is covered with up to 20 co-occurrences shown in each of the following categories:

Application Platforms
1 72 (3.36%) Apache Spark
2 62 (2.90%) Apache
3 57 (2.66%) SAS
4 36 (1.68%) SharePoint
5 18 (0.84%) Confluence
6 14 (0.65%) Apache Airflow
6 14 (0.65%) WordPress
7 11 (0.51%) Oracle Application Server
8 10 (0.47%) CMS
9 5 (0.23%) Jupyter
9 5 (0.23%) Luigi
10 4 (0.19%) SharePoint Server
11 3 (0.14%) Drupal
12 2 (0.093%) Adobe Experience Manager
12 2 (0.093%) ArcGIS
13 1 (0.047%) IBM Domino
13 1 (0.047%) IIS
13 1 (0.047%) Oracle Workflow
13 1 (0.047%) Tomcat
13 1 (0.047%) WebLogic
Applications
1 119 (5.56%) Microsoft Excel
2 51 (2.38%) Microsoft Office
3 10 (0.47%) Microsoft PowerPoint
4 8 (0.37%) Microsoft Project
4 8 (0.37%) Spreadsheet
5 6 (0.28%) Sketch
6 4 (0.19%) Adobe XD
6 4 (0.19%) InVision
6 4 (0.19%) UserZoom
7 3 (0.14%) SPSS
8 2 (0.093%) Chatbot
8 2 (0.093%) MS Visio
8 2 (0.093%) Photoshop
9 1 (0.047%) Adobe Creative Suite
9 1 (0.047%) InDesign
9 1 (0.047%) Trello
Business Applications
1 22 (1.03%) SAP S/4HANA
2 14 (0.65%) Cloudability
3 12 (0.56%) Sparx Enterprise Architect
4 9 (0.42%) Oracle ERP
5 8 (0.37%) Shopify
6 6 (0.28%) SAP CO
6 6 (0.28%) SAP FI
6 6 (0.28%) SAP FI/CO
6 6 (0.28%) SAP Retail
7 5 (0.23%) IBM Planning Analytics
7 5 (0.23%) Magento
7 5 (0.23%) NetSuite
7 5 (0.23%) Oracle General Ledger
8 4 (0.19%) iTrent
8 4 (0.19%) SAP ERP
8 4 (0.19%) Unit4 Business World
9 3 (0.14%) Dynamics CRM
9 3 (0.14%) Infor M3
9 3 (0.14%) Oracle Receivables
9 3 (0.14%) SAP SD
Cloud Services
1 524 (24.47%) Power Platform
2 494 (23.07%) Azure
3 224 (10.46%) GCP
4 196 (9.15%) AWS
5 141 (6.59%) Google Analytics
6 103 (4.81%) Azure DevOps
7 97 (4.53%) SaaS
8 78 (3.64%) Azure Data Factory
9 75 (3.50%) Serverless
10 69 (3.22%) Microsoft 365
11 60 (2.80%) PaaS
12 56 (2.62%) IaaS
13 51 (2.38%) Azure Synapse Analytics
13 51 (2.38%) GitHub
13 51 (2.38%) Snowflake
14 38 (1.77%) Azure Monitor
14 38 (1.77%) Vertex AI
15 37 (1.73%) Entra ID
15 37 (1.73%) GitHub Actions
16 35 (1.63%) PowerApps
Communications & Networking
1 45 (2.10%) Firewall
2 36 (1.68%) DNS
3 30 (1.40%) DHCP
4 28 (1.31%) Network Security
5 14 (0.65%) Wireless
6 11 (0.51%) SMS
7 9 (0.42%) Internet
7 9 (0.42%) VPN
8 8 (0.37%) TCP/IP
9 7 (0.33%) HTTP
9 7 (0.33%) WAN
10 5 (0.23%) VoIP
10 5 (0.23%) Wireshark
11 4 (0.19%) SMTP
11 4 (0.19%) SNMP
12 3 (0.14%) DMZ
12 3 (0.14%) DSL
12 3 (0.14%) IPv4
12 3 (0.14%) MQTT
12 3 (0.14%) Wi-Fi
Database & Business Intelligence
1 514 (24.01%) Power BI
2 285 (13.31%) Data Warehouse
3 193 (9.01%) Tableau
4 166 (7.75%) Data Lake
5 114 (5.32%) Big Data
6 112 (5.23%) SQL Server
7 102 (4.76%) Looker
8 100 (4.67%) NoSQL
9 91 (4.25%) SQL Server Integration Services
10 83 (3.88%) Relational Database
11 75 (3.50%) SQL Server Reporting Services
12 72 (3.36%) BigQuery
13 54 (2.52%) SQL Server Analysis Services
14 52 (2.43%) PostgreSQL
15 50 (2.34%) Star Schema
16 43 (2.01%) MySQL
17 38 (1.77%) Data Hub
17 38 (1.77%) Metadata
18 37 (1.73%) Power Query
19 34 (1.59%) Bigtable
Development Applications
1 102 (4.76%) Jenkins
2 65 (3.04%) Git
3 57 (2.66%) JIRA
4 27 (1.26%) SonarQube
5 24 (1.12%) Sonatype Nexus
6 23 (1.07%) GitLab
7 22 (1.03%) Maven
8 17 (0.79%) Spinnaker
9 13 (0.61%) Axure RP
9 13 (0.61%) Gradle
9 13 (0.61%) Oracle Forms
10 10 (0.47%) JUnit
11 9 (0.42%) Artifactory
11 9 (0.42%) SQL Server Management Studio (SSMS)
12 8 (0.37%) Ant
12 8 (0.37%) Cucumber
12 8 (0.37%) Mocha
12 8 (0.37%) Selenium
12 8 (0.37%) Zephyr
13 7 (0.33%) Jasmine
General
1 874 (40.82%) Social Skills
2 745 (34.80%) Finance
3 488 (22.79%) Analytical Skills
4 387 (18.08%) Banking
5 292 (13.64%) Marketing
6 287 (13.40%) Retail
7 126 (5.89%) Manufacturing
8 108 (5.04%) Inclusion and Diversity
9 97 (4.53%) Presentation Skills
10 68 (3.18%) Influencing Skills
11 55 (2.57%) Law
12 50 (2.34%) Legal
13 48 (2.24%) Public Sector
14 36 (1.68%) Electronics
15 33 (1.54%) Advertising
16 22 (1.03%) Financial Institution
16 22 (1.03%) Organisational Skills
17 21 (0.98%) Telecoms
18 19 (0.89%) Retail Finance
19 16 (0.75%) Retail Banking
Job Titles
1 494 (23.07%) Analyst
2 398 (18.59%) Architect
3 266 (12.42%) Senior
4 259 (12.10%) Solutions Architect
5 201 (9.39%) Presales Solution Architect
6 188 (8.78%) Data Engineer
7 185 (8.64%) Developer
8 163 (7.61%) Lead
9 136 (6.35%) Data Analyst
10 93 (4.34%) Senior Analyst
11 70 (3.27%) Data Architect
12 62 (2.90%) Consultant
13 60 (2.80%) Data Manager
14 59 (2.76%) Business Intelligence Developer
15 58 (2.71%) Data Scientist
16 55 (2.57%) Enterprise Architect
17 51 (2.38%) Business Intelligence Analyst
18 47 (2.20%) Senior Developer
19 42 (1.96%) Product Manager
20 40 (1.87%) Product Owner
Libraries, Frameworks & Software Standards
1 85 (3.97%) HTML
2 55 (2.57%) Kafka
3 50 (2.34%) .NET
4 46 (2.15%) CSS
5 38 (1.77%) OpenID
6 37 (1.73%) PySpark
7 36 (1.68%) Pandas
8 35 (1.63%) React
9 28 (1.31%) REST
10 27 (1.26%) Middleware
10 27 (1.26%) PyTorch
11 26 (1.21%) Node.js
11 26 (1.21%) scikit-learn
11 26 (1.21%) TensorFlow
12 21 (0.98%) NumPy
12 21 (0.98%) Spring Boot
13 20 (0.93%) JSON
14 19 (0.89%) Keras
15 18 (0.84%) AngularJS
15 18 (0.84%) ARM Templates
Miscellaneous
1 129 (6.03%) Public Cloud
2 88 (4.11%) Product Ownership
3 84 (3.92%) Cloud Native
4 67 (3.13%) Data Structures
5 65 (3.04%) Self-Motivation
6 64 (2.99%) Algorithms
7 62 (2.90%) Management Information System
8 51 (2.38%) Credit Risk
8 51 (2.38%) Replication
9 35 (1.63%) Blockchain
9 35 (1.63%) Mainframe
10 30 (1.40%) IoT
11 28 (1.31%) Onboarding
12 26 (1.21%) Legacy Systems
13 25 (1.17%) PKI
14 23 (1.07%) Analytical Mindset
15 20 (0.93%) Enterprise Software
15 20 (0.93%) Social Media
16 17 (0.79%) Distributed Systems
17 16 (0.75%) Cyberattack
Operating Systems
1 90 (4.20%) Windows
2 63 (2.94%) Unix
3 61 (2.85%) Linux
4 23 (1.07%) Windows Server
5 16 (0.75%) Windows Server 2016
5 16 (0.75%) Windows Server 2019
6 13 (0.61%) AIX
7 10 (0.47%) Mac OS
8 5 (0.23%) Red Hat Enterprise Linux
8 5 (0.23%) Ubuntu
9 4 (0.19%) Mac OS X
9 4 (0.19%) Windows Server 2012
10 3 (0.14%) Apple iOS
11 2 (0.093%) Windows 10
12 1 (0.047%) Android
Processes & Methodologies
1 747 (34.89%) Agile
2 687 (32.09%) Business Intelligence
3 664 (31.01%) Problem-Solving
4 655 (30.59%) Data Analytics
5 384 (17.94%) Actionable Insight
6 351 (16.39%) Visualisation
7 320 (14.95%) Data Modelling
8 311 (14.53%) Machine Learning
9 301 (14.06%) Decision-Making
10 265 (12.38%) Technology Strategy
11 263 (12.28%) Data Science
11 263 (12.28%) ETL
12 255 (11.91%) Thought Leadership
13 251 (11.72%) DevOps
14 242 (11.30%) Business Case
15 237 (11.07%) IT Strategy
16 227 (10.60%) Data Analysis
17 224 (10.46%) Presales
18 220 (10.28%) Digital Transformation Programme
19 211 (9.86%) Commercial Awareness
Programming Languages
1 657 (30.69%) SQL
2 388 (18.12%) Python
3 93 (4.34%) Java
4 90 (4.20%) JavaScript
5 74 (3.46%) C#
6 73 (3.41%) PL/SQL
7 72 (3.36%) Data Analysis Expressions
7 72 (3.36%) PowerShell
8 71 (3.32%) T-SQL
9 66 (3.08%) R
10 35 (1.63%) Bash
11 30 (1.40%) Scala
12 29 (1.35%) TypeScript
13 28 (1.31%) Go
14 26 (1.21%) VB
15 22 (1.03%) VBScript
16 19 (0.89%) C++
17 18 (0.84%) MATLAB
18 17 (0.79%) PHP
18 17 (0.79%) VBA
Qualifications
1 433 (20.22%) Degree
2 376 (17.56%) Security Cleared
3 330 (15.41%) SC Cleared
4 78 (3.64%) Computer Science Degree
5 66 (3.08%) DV Cleared
6 55 (2.57%) Master's Degree
7 28 (1.31%) Azure Certification
8 22 (1.03%) ITIL Foundation Certificate
9 21 (0.98%) BPSS Clearance
10 19 (0.89%) Numerate Degree
11 16 (0.75%) ITIL Certification
12 14 (0.65%) GCIA
12 14 (0.65%) GCIH
13 13 (0.61%) AWS Certification
13 13 (0.61%) CEH
13 13 (0.61%) GCFA
13 13 (0.61%) GREM
13 13 (0.61%) OSCP
14 12 (0.56%) Microsoft Certification
14 12 (0.56%) TOGAF Certification
Quality Assurance & Compliance
1 134 (6.26%) Data Quality
2 55 (2.57%) QA
3 43 (2.01%) GDPR
4 41 (1.91%) Actionable Recommendations
5 21 (0.98%) ISO/IEC 27001
6 20 (0.93%) Accessibility
7 19 (0.89%) PMO
8 18 (0.84%) IFRS
8 18 (0.84%) SLA
9 16 (0.75%) IFRS 9
10 14 (0.65%) GMP
10 14 (0.65%) NIST
11 13 (0.61%) PCI DSS
12 10 (0.47%) CRD IV
13 6 (0.28%) Cyber Essentials
13 6 (0.28%) Sarbanes-Oxley
14 4 (0.19%) GRC
14 4 (0.19%) ITGC
15 3 (0.14%) Basel III
16 2 (0.093%) WCAG
System Software
1 50 (2.34%) Docker
2 39 (1.82%) Active Directory
3 26 (1.21%) Virtual Machines
4 22 (1.03%) Virtual Desktop
5 5 (0.23%) HDFS
6 4 (0.19%) Firmware
6 4 (0.19%) Hyper-V
7 2 (0.093%) BitLocker
8 1 (0.047%) Embedded Firmware
Systems Management
1 104 (4.86%) Terraform
2 101 (4.72%) Kubernetes
3 29 (1.35%) Ansible
4 28 (1.31%) Microsoft Intune
5 25 (1.17%) Prometheus
6 23 (1.07%) Active Directory Federation Services
6 23 (1.07%) SCCM
7 22 (1.03%) Grafana
7 22 (1.03%) SCOM
7 22 (1.03%) WSUS
8 17 (0.79%) Puppet
9 12 (0.56%) Progress Chef
10 11 (0.51%) Nagios
11 9 (0.42%) Kibana
12 6 (0.28%) Istio
12 6 (0.28%) Oozie
13 4 (0.19%) vRealize
13 4 (0.19%) vRealize Orchestrator
14 3 (0.14%) Computer Emergency Response Teams
14 3 (0.14%) Nessus
Vendors
1 356 (16.63%) Microsoft
2 255 (11.91%) Google
3 116 (5.42%) Databricks
4 81 (3.78%) Oracle
5 73 (3.41%) SAP
6 64 (2.99%) Salesforce
7 39 (1.82%) ServiceNow
8 37 (1.73%) Teradata
9 30 (1.40%) Adobe
10 29 (1.35%) Splunk
11 25 (1.17%) Alteryx
12 23 (1.07%) IBM
13 22 (1.03%) Hotjar
14 19 (0.89%) Ahrefs
15 14 (0.65%) Dell
15 14 (0.65%) Dynatrace
15 14 (0.65%) Informatica
16 12 (0.56%) Sparx
17 11 (0.51%) New Relic
18 9 (0.42%) Cognos