Architect Jobs in the UK excluding London

Architect
UK > UK excluding London

The median Architect salary in the UK excluding London is £73,000 per year, according to job vacancies posted during the 6 months leading to 1 May 2025.

The table below provides salary benchmarking and summary statistics, comparing them to the same period in the previous two years.

6 months to
1 May 2025
Same period 2024 Same period 2023
Rank 72 39 35
Rank change year-on-year -33 -4 +23
Permanent jobs requiring an Architect 1,311 3,795 4,300
As % of all permanent jobs advertised in the UK excluding London 3.56% 5.40% 7.00%
As % of the Job Titles category 3.95% 5.69% 7.85%
Number of salaries quoted 904 2,027 1,648
10th Percentile £59,050 £55,000 £56,219
25th Percentile £62,500 £62,500 £65,000
Median annual salary (50th Percentile) £73,000 £75,000 £79,000
Median % change year-on-year -2.67% -5.06% +5.33%
75th Percentile £85,000 £89,500 £90,000
90th Percentile £98,474 £100,000 £100,000
UK median annual salary £80,000 £80,000 £85,000
% change year-on-year - -5.88% -

All Permanent IT Job Vacancies
UK excluding London

For comparison with the information above, the following table provides summary statistics for all permanent IT job vacancies in the UK excluding London. Most job vacancies include a discernible job title that can be normalized. As such, the figures in the second row provide an indication of the number of permanent jobs in our overall sample.

Permanent vacancies in the UK excluding London with a recognized job title 33,156 66,640 54,781
% of permanent jobs with a recognized job title 90.03% 94.78% 89.23%
Number of salaries quoted 18,505 47,222 31,088
10th Percentile £27,750 £26,750 £29,750
25th Percentile £38,750 £35,000 £38,750
Median annual salary (50th Percentile) £52,000 £50,000 £52,500
Median % change year-on-year +4.00% -4.76% +5.00%
75th Percentile £65,000 £63,750 £68,750
90th Percentile £78,750 £76,250 £82,500
UK median annual salary £57,500 £52,777 £60,000
% change year-on-year +8.95% -12.04% -

Architect
Job Vacancy Trend in the UK excluding London

Job postings that featured Architect in the job title as a proportion of all IT jobs advertised in the UK excluding London.
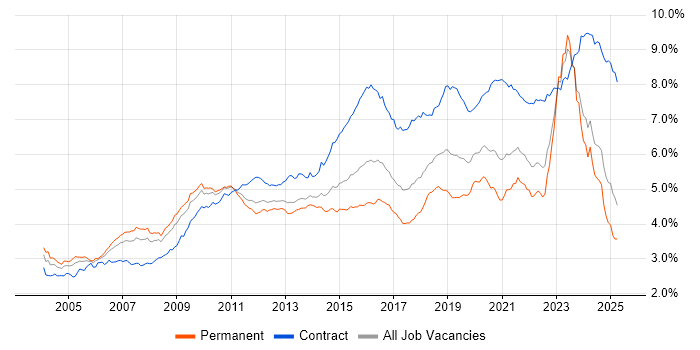
Job vacancy trend for Architect in the UK excluding London

Architect
Salary Trend in the UK excluding London

3-month moving average salary quoted in jobs citing Architect in the UK excluding London.

Salary trend for Architect in the UK excluding London

Architect
Salary Histogram in the UK excluding London

Salary distribution for jobs citing Architect in the UK excluding London over the 6 months to 1 May 2025.

Salary histogram for Architect in the UK excluding London

Architect
Job Locations in the UK excluding London

The table below looks at the demand and provides a guide to the median salaries quoted in IT jobs citing Architect within the UK excluding London region over the 6 months to 1 May 2025. The 'Rank Change' column provides an indication of the change in demand within each location based on the same 6 month period last year.

Location Rank Change
on Same Period
Last Year
Matching
Permanent
IT Job Ads
Median Salary
Past 6 Months
Median Salary
% Change
on Same Period
Last Year
Live
Jobs
North of England -54 406 £65,000 -16.80% 269
South East -17 376 £77,500 +3.33% 408
North West -51 269 £60,000 -20.00% 158
Midlands -37 239 £72,500 -3.33% 183
West Midlands -25 181 £75,000 -1.32% 115
Yorkshire -29 106 £80,000 +0.20% 82
Scotland +5 100 £80,000 +6.67% 61
South West -67 79 £71,991 -4.01% 166
East of England -11 74 £66,850 -16.44% 110
East Midlands -53 57 £65,000 - 54
North East +24 33 £65,000 -18.64% 30
Wales -18 31 £65,000 -1.89% 29
Northern Ireland -13 11 £87,500 -7.89% 28
Architect
UK

Architect Skill Set
Top 30 Co-occurring Skills and Capabilities in the UK excluding London

For the 6 months to 1 May 2025, Architect job roles required the following skills and capabilities in order of popularity. The figures indicate the absolute number co-occurrences and as a proportion of all permanent job ads across the UK excluding London region featuring Architect in the job title.

1 336 (25.63%) Social Skills
2 329 (25.10%) Agile
3 297 (22.65%) Roadmaps
4 289 (22.04%) Azure
5 271 (20.67%) Finance
6 253 (19.30%) Security Cleared
7 245 (18.69%) BPSS Clearance
8 237 (18.08%) Degree
9 230 (17.54%) Mentoring
10 200 (15.26%) Enterprise Architecture
11 196 (14.95%) DevOps
12 190 (14.49%) SC Cleared
12 190 (14.49%) TOGAF
13 183 (13.96%) Microsoft
14 182 (13.88%) Microservices
15 181 (13.81%) Technical Leadership
16 166 (12.66%) Management Information System
17 157 (11.98%) Business Strategy
18 153 (11.67%) ERP
19 149 (11.37%) AWS
20 139 (10.60%) Manufacturing
21 136 (10.37%) Customer Requirements
22 129 (9.84%) Data Architecture
23 127 (9.69%) Cisco
23 127 (9.69%) Problem-Solving
24 122 (9.31%) Information Security
24 122 (9.31%) Stakeholder Management
24 122 (9.31%) SQL
25 116 (8.85%) PLM
26 115 (8.77%) CAD

Architect Skill Set
Co-occurring Skills and Capabilities in the UK excluding London by Category

The follow tables expand on the table above by listing co-occurrences grouped by category. The same employment type, locality and period is covered with up to 20 co-occurrences shown in each of the following categories:

Application Platforms
1 65 (4.96%) Confluence
2 16 (1.22%) CMS
3 11 (0.84%) Umbraco
4 9 (0.69%) Apache Spark
5 8 (0.61%) Oracle SOA Suite
5 8 (0.61%) SAS
6 7 (0.53%) SharePoint
7 4 (0.31%) NetWeaver
8 3 (0.23%) Adobe Experience Manager
8 3 (0.23%) Apache
8 3 (0.23%) Apache Airflow
8 3 (0.23%) OpenStack
9 2 (0.15%) IBM Domino
9 2 (0.15%) IIS
9 2 (0.15%) Microsoft Exchange
9 2 (0.15%) Tomcat
9 2 (0.15%) WebSphere
9 2 (0.15%) WebSphere Application Server
10 1 (0.076%) ArcGIS
10 1 (0.076%) SharePoint Server
Applications
1 14 (1.07%) Chatbot
2 9 (0.69%) Microsoft Office
3 4 (0.31%) MS Visio
4 2 (0.15%) Windchill
5 1 (0.076%) AutoCAD
5 1 (0.076%) Microsoft Excel
Business Applications
1 16 (1.22%) Dynamics CRM
2 13 (0.99%) SAP S/4HANA
3 10 (0.76%) Oracle EBS
4 6 (0.46%) Oracle Procure-to-Pay
5 4 (0.31%) Salesforce CRM
5 4 (0.31%) Sparx Enterprise Architect
6 2 (0.15%) Dynamics AX
6 2 (0.15%) Oracle ERP
6 2 (0.15%) Payment Gateway
6 2 (0.15%) PeopleSoft HCM
6 2 (0.15%) Sprinklr
7 1 (0.076%) Infor SunSystems
7 1 (0.076%) Odoo
7 1 (0.076%) SAP MDG
Cloud Services
1 289 (22.04%) Azure
2 149 (11.37%) AWS
3 93 (7.09%) SaaS
4 84 (6.41%) GCP
5 47 (3.59%) Azure DevOps
5 47 (3.59%) Azure Service Bus
6 44 (3.36%) Azure Cosmos DB
7 40 (3.05%) PaaS
8 39 (2.97%) Serverless
9 37 (2.82%) Power Platform
10 35 (2.67%) Microsoft 365
10 35 (2.67%) SonarCloud
11 32 (2.44%) Dynamics 365
12 25 (1.91%) Azure Synapse Analytics
12 25 (1.91%) Salesforce Sales Cloud
13 22 (1.68%) Amazon S3
13 22 (1.68%) AWS Lambda
13 22 (1.68%) Azure Data Factory
13 22 (1.68%) OCI
14 19 (1.45%) IaaS
Communications & Networking
1 103 (7.86%) WAN
2 78 (5.95%) Firewall
3 62 (4.73%) LAN
4 37 (2.82%) MPLS
5 26 (1.98%) BGP
6 23 (1.75%) IPsec
7 21 (1.60%) Intrusion Detection
7 21 (1.60%) Junos
7 21 (1.60%) VPN
8 18 (1.37%) Cisco IOS
8 18 (1.37%) Network Security
9 13 (0.99%) Wi-Fi
10 12 (0.92%) Cisco ISE
11 11 (0.84%) Ethernet
12 10 (0.76%) Internet
13 8 (0.61%) DNS
14 7 (0.53%) SD-WAN
15 6 (0.46%) TCP/IP
15 6 (0.46%) Wireless
16 3 (0.23%) VLAN
Database & Business Intelligence
1 57 (4.35%) NoSQL
2 42 (3.20%) Data Lake
3 41 (3.13%) Data Warehouse
4 35 (2.67%) Elasticsearch
5 30 (2.29%) SQL Server
6 20 (1.53%) BigQuery
7 18 (1.37%) Azure SQL Database
7 18 (1.37%) Power BI
8 16 (1.22%) Big Data
9 13 (0.99%) Relational Database
10 12 (0.92%) Amazon Redshift
10 12 (0.92%) RDBMS
11 11 (0.84%) Amazon RDS
11 11 (0.84%) Metadata
12 10 (0.76%) PostgreSQL
12 10 (0.76%) Tableau
13 9 (0.69%) MySQL
14 8 (0.61%) Oracle ODI
15 7 (0.53%) Data Vault
16 6 (0.46%) Oracle Reports
Development Applications
1 67 (5.11%) JIRA
2 58 (4.42%) Rational DOORS
3 51 (3.89%) Visual Studio
4 45 (3.43%) Git
5 36 (2.75%) MSBuild
5 36 (2.75%) Octopus Deploy
5 36 (2.75%) Team Foundation Server
6 8 (0.61%) GitLab
7 7 (0.53%) Jenkins
7 7 (0.53%) MSI
7 7 (0.53%) Oracle Forms
8 6 (0.46%) JDeveloper
9 5 (0.38%) ERwin
10 2 (0.15%) Babel
10 2 (0.15%) Liquibase
10 2 (0.15%) Mocha
10 2 (0.15%) Sonatype Nexus
10 2 (0.15%) Visual Studio Code
10 2 (0.15%) webpack
11 1 (0.076%) ER Studio
General
1 336 (25.63%) Social Skills
2 271 (20.67%) Finance
3 139 (10.60%) Manufacturing
4 103 (7.86%) Analytical Skills
5 74 (5.64%) Banking
6 64 (4.88%) Public Sector
7 56 (4.27%) Retail
8 51 (3.89%) Marketing
8 51 (3.89%) Presentation Skills
9 46 (3.51%) Inclusion and Diversity
10 39 (2.97%) Influencing Skills
11 36 (2.75%) Law
12 21 (1.60%) Electronics
13 19 (1.45%) Legal
14 17 (1.30%) Organisational Skills
15 13 (0.99%) Financial Institution
16 12 (0.92%) Advertising
16 12 (0.92%) Documentation Skills
17 11 (0.84%) Telecoms
18 6 (0.46%) Aerospace
Libraries, Frameworks & Software Standards
1 74 (5.64%) REST
2 70 (5.34%) .NET
3 60 (4.58%) CSS
4 49 (3.74%) HTML
5 45 (3.43%) XML
6 42 (3.20%) Middleware
7 41 (3.13%) JSON
8 37 (2.82%) ASP.NET
9 35 (2.67%) Bootstrap
9 35 (2.67%) gRPC
10 30 (2.29%) React
11 27 (2.06%) SOAP
12 25 (1.91%) Lightning Web Components
13 17 (1.30%) SAML
14 15 (1.14%) .NET Framework
15 13 (0.99%) jQuery
15 13 (0.99%) OAuth
16 12 (0.92%) OpenID
16 12 (0.92%) RESTful
17 11 (0.84%) Ajax
Miscellaneous
1 166 (12.66%) Management Information System
2 55 (4.20%) Product Ownership
3 51 (3.89%) Enterprise Software
4 40 (3.05%) Cloud Native
5 31 (2.36%) Public Cloud
6 28 (2.14%) Hybrid Cloud
7 26 (1.98%) Greenfield Project
8 25 (1.91%) Data Centre
9 24 (1.83%) Operational Technology
10 23 (1.75%) Self-Motivation
11 19 (1.45%) Security Posture
12 18 (1.37%) Legacy Systems
13 17 (1.30%) Team-Oriented Environment
14 16 (1.22%) IoT
15 14 (1.07%) Social Media
16 13 (0.99%) Private Cloud
17 12 (0.92%) Blockchain
18 11 (0.84%) SCADA
19 10 (0.76%) Distributed Architecture
19 10 (0.76%) Distributed Systems
Operating Systems
1 59 (4.50%) Windows
2 27 (2.06%) Linux
3 14 (1.07%) Windows Vista
4 13 (0.99%) Red Hat Enterprise Linux
5 7 (0.53%) Android
5 7 (0.53%) Apple iOS
5 7 (0.53%) Windows 10
6 6 (0.46%) Windows Server
7 2 (0.15%) Solaris
7 2 (0.15%) Windows Server 2019
8 1 (0.076%) Mac OS
8 1 (0.076%) Ubuntu
8 1 (0.076%) Windows Server 2016
Processes & Methodologies
1 329 (25.10%) Agile
2 297 (22.65%) Roadmaps
3 230 (17.54%) Mentoring
4 200 (15.26%) Enterprise Architecture
5 196 (14.95%) DevOps
6 190 (14.49%) TOGAF
7 182 (13.88%) Microservices
8 181 (13.81%) Technical Leadership
9 157 (11.98%) Business Strategy
10 153 (11.67%) ERP
11 136 (10.37%) Customer Requirements
12 129 (9.84%) Data Architecture
13 127 (9.69%) Problem-Solving
14 122 (9.31%) Information Security
14 122 (9.31%) Stakeholder Management
15 116 (8.85%) PLM
16 115 (8.77%) CAD
17 108 (8.24%) Analytics
18 105 (8.01%) Continuous Improvement
19 102 (7.78%) Data Modelling
Programming Languages
1 122 (9.31%) SQL
2 72 (5.49%) C#
3 71 (5.42%) JavaScript
4 54 (4.12%) Python
5 53 (4.04%) Java
6 25 (1.91%) Apex Code
7 23 (1.75%) PowerShell
8 14 (1.07%) C++
9 13 (0.99%) C
10 8 (0.61%) R
11 5 (0.38%) PHP
11 5 (0.38%) Scala
11 5 (0.38%) TypeScript
12 3 (0.23%) ABAP
12 3 (0.23%) Bash
13 2 (0.15%) Bicep
13 2 (0.15%) Kusto Query Language
13 2 (0.15%) PL/SQL
13 2 (0.15%) T-SQL
14 1 (0.076%) VBScript
Qualifications
1 253 (19.30%) Security Cleared
2 245 (18.69%) BPSS Clearance
3 237 (18.08%) Degree
4 190 (14.49%) SC Cleared
5 91 (6.94%) CISSP
6 77 (5.87%) Computer Science Degree
7 72 (5.49%) Cisco Certification
8 70 (5.34%) Chartered Engineer
9 67 (5.11%) DV Cleared
10 50 (3.81%) CCNA
11 42 (3.20%) Master's Degree
12 39 (2.97%) TOGAF Certification
13 29 (2.21%) CCNP
14 25 (1.91%) AWS Certification
15 24 (1.83%) JNCIA
16 23 (1.75%) CISM
17 22 (1.68%) Azure Certification
17 22 (1.68%) JNCIS
18 16 (1.22%) (ISC)2 CCSP
18 16 (1.22%) CEH
Quality Assurance & Compliance
1 75 (5.72%) GDPR
2 56 (4.27%) ISO/IEC 15288
3 37 (2.82%) Data Quality
4 34 (2.59%) NIST
5 31 (2.36%) ISO/IEC 27001
6 25 (1.91%) SLA
7 19 (1.45%) PCI DSS
8 18 (1.37%) QA
9 14 (1.07%) Accessibility
9 14 (1.07%) ISO/IEC 12207
10 10 (0.76%) NCSC
11 9 (0.69%) Cyber Essentials
12 7 (0.53%) Basel II
12 7 (0.53%) Basel III
12 7 (0.53%) Dodd-Frank
12 7 (0.53%) IFRS
12 7 (0.53%) IFRS 9
13 6 (0.46%) COBIT
14 4 (0.31%) JSP 440
14 4 (0.31%) NIST 800
System Software
1 82 (6.25%) Docker
2 39 (2.97%) Active Directory
3 36 (2.75%) VMware Infrastructure
4 17 (1.30%) Virtual Desktop
5 6 (0.46%) BitLocker
6 5 (0.38%) Hyper-V
7 3 (0.23%) Virtual Machines
7 3 (0.23%) VMware ESXi
8 2 (0.15%) Firmware
8 2 (0.15%) KVM
8 2 (0.15%) NFS
8 2 (0.15%) SRDF
8 2 (0.15%) Veritas Cluster Server
8 2 (0.15%) Xen
9 1 (0.076%) Microsoft App-V
9 1 (0.076%) VMware NSX
9 1 (0.076%) vSphere
Systems Management
1 51 (3.89%) Kubernetes
2 34 (2.59%) Terraform
3 22 (1.68%) Single Sign-On
4 16 (1.22%) Ansible
5 12 (0.92%) Active Directory Federation Services
6 9 (0.69%) WMI
7 6 (0.46%) Progress Chef
7 6 (0.46%) SCCM
8 5 (0.38%) FortiGate
9 4 (0.31%) CASB
10 3 (0.23%) Microsoft Intune
11 2 (0.15%) Puppet
11 2 (0.15%) vCenter Server
12 1 (0.076%) Istio
12 1 (0.076%) Marathon
12 1 (0.076%) WSUS
Vendors
1 183 (13.96%) Microsoft
2 127 (9.69%) Cisco
3 109 (8.31%) Juniper
4 93 (7.09%) SAP
5 82 (6.25%) IBM
6 59 (4.50%) Siemens
7 47 (3.59%) VMware
8 46 (3.51%) Oracle
9 45 (3.43%) Salesforce
10 40 (3.05%) Google
11 33 (2.52%) Aruba
12 32 (2.44%) Fortinet
13 26 (1.98%) Palo Alto
14 25 (1.91%) Databricks
15 22 (1.68%) Apple
16 21 (1.60%) Salesforce Marketing Cloud
17 19 (1.45%) Adobe
18 17 (1.30%) Red Hat
19 11 (0.84%) ServiceNow
19 11 (0.84%) SevOne