Telecoms Jobs in the UK excluding London

Telecommunications
UK > UK excluding London

The table below looks at the prevalence of the term Telecoms in permanent job vacancies in the UK excluding London. Included is a benchmarking guide to the salaries offered in vacancies that cited Telecoms over the 6 months leading up to 18 August 2025, comparing them to the same period in the previous two years.

6 months to
18 Aug 2025
Same period 2024 Same period 2023
Rank 97 99 27
Rank change year-on-year +2 -72 +115
Permanent jobs citing Telecoms 1,255 1,481 3,623
As % of all permanent jobs advertised in the UK excluding London 2.80% 2.38% 8.31%
As % of the General category 4.40% 4.44% 12.61%
Number of salaries quoted 586 770 755
10th Percentile £25,500 £25,975 £25,000
25th Percentile £27,000 £30,000 £28,500
Median annual salary (50th Percentile) £36,000 £42,500 £42,500
Median % change year-on-year -15.29% - -15.00%
75th Percentile £52,500 £58,750 £62,500
90th Percentile £73,750 £71,250 £75,000
UK median annual salary £42,500 £47,500 £54,000
% change year-on-year -10.53% -12.04% -1.82%

All General Skills
UK excluding London

Telecoms falls under the General Skills category. For comparison with the information above, the following table provides summary statistics for all permanent job vacancies requiring common skills in the UK excluding London.

Permanent vacancies with a requirement for common skills 28,491 33,371 28,739
As % of all permanent jobs advertised in the UK excluding London 63.58% 53.54% 65.90%
Number of salaries quoted 13,744 17,983 16,289
10th Percentile £25,087 £27,500 £28,000
25th Percentile £30,000 £35,000 £37,500
Median annual salary (50th Percentile) £45,000 £50,000 £52,500
Median % change year-on-year -10.00% -4.76% +5.00%
75th Percentile £62,500 £63,750 £67,500
90th Percentile £75,900 £77,500 £81,250
UK median annual salary £52,500 £55,000 £60,000
% change year-on-year -4.55% -8.33% -

Telecoms
Job Vacancy Trend in the UK excluding London

Job postings citing Telecoms as a proportion of all IT jobs advertised in the UK excluding London.
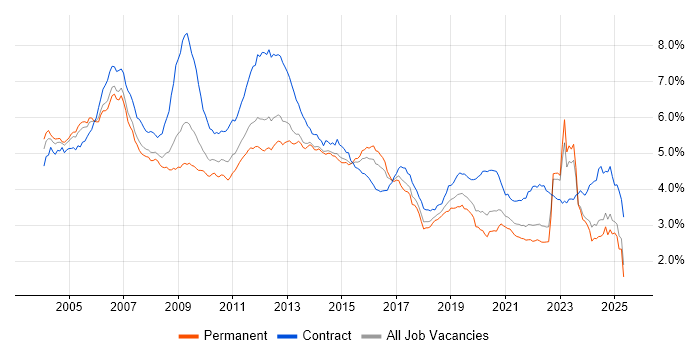
Job vacancy trend for Telecoms in the UK excluding London

Telecoms
Salary Trend in the UK excluding London

3-month moving average salary quoted in jobs citing Telecoms in the UK excluding London.

Salary trend for Telecoms in the UK excluding London

Telecoms
Salary Histogram in the UK excluding London

Salary distribution for jobs citing Telecoms in the UK excluding London over the 6 months to 18 August 2025.

Salary histogram for Telecoms in the UK excluding London

Telecoms
Job Locations in the UK excluding London

The table below looks at the demand and provides a guide to the median salaries quoted in IT jobs citing Telecoms within the UK excluding London region over the 6 months to 18 August 2025. The 'Rank Change' column provides an indication of the change in demand within each location based on the same 6 month period last year.

Location Rank Change
on Same Period
Last Year
Matching
Permanent
IT Job Ads
Median Salary
Past 6 Months
Median Salary
% Change
on Same Period
Last Year
Live
Jobs
North of England +68 349 £40,000 -15.79% 184
South East -37 284 £35,500 -21.11% 386
Midlands +16 283 £37,500 -18.92% 156
Yorkshire +107 210 £29,500 -41.00% 72
West Midlands +31 194 £28,500 -34.86% 122
North West -18 137 £45,000 +9.09% 90
South West +25 130 £42,500 +6.25% 79
East Midlands -4 88 £42,500 -15.00% 31
Scotland -10 82 £26,929 -46.14% 52
East of England -32 76 £45,000 -2.70% 96
Wales +30 56 £29,000 +0.87% 13
Northern Ireland +8 7 £45,000 +28.57% 6
North East +13 6 £30,000 -14.29% 29
Isle of Man - 3 £91,000 - 1
Telecoms
UK

Telecoms
Co-occurring Skills and Capabilities in the UK excluding London by Category

The follow tables expand on the table above by listing co-occurrences grouped by category. The same employment type, locality and period is covered with up to 20 co-occurrences shown in each of the following categories:

Application Platforms
1 18 (1.43%) SharePoint
2 10 (0.80%) Microsoft Exchange
3 5 (0.40%) IIS
4 4 (0.32%) CMS
5 1 (0.080%) Joomla!
5 1 (0.080%) OpenStack
5 1 (0.080%) Skype for Business
5 1 (0.080%) WordPress
Applications
1 231 (18.41%) Microsoft Office
2 58 (4.62%) Microsoft Excel
3 21 (1.67%) Microsoft PowerPoint
4 6 (0.48%) MS Visio
5 3 (0.24%) Chatbot
5 3 (0.24%) Microsoft Project
6 1 (0.080%) Adobe XD
6 1 (0.080%) AutoCAD
6 1 (0.080%) Photoshop
6 1 (0.080%) SOLIDWORKS
6 1 (0.080%) Spreadsheet
Business Applications
1 12 (0.96%) Dynamics AX
2 7 (0.56%) Dynamics NAV
3 6 (0.48%) SAP ERP
4 4 (0.32%) Sage X3
5 2 (0.16%) SAP PM
6 1 (0.080%) Dynamics GP
6 1 (0.080%) Salesforce CRM
Cloud Services
1 78 (6.22%) Microsoft 365
2 47 (3.75%) Azure
3 36 (2.87%) AWS
4 13 (1.04%) Power Platform
5 12 (0.96%) GCP
5 12 (0.96%) Serverless
6 8 (0.64%) AWS Lambda
6 8 (0.64%) Dynamics 365
6 8 (0.64%) OneDrive
7 7 (0.56%) Cloud Computing
7 7 (0.56%) SaaS
8 5 (0.40%) Azure Sentinel
9 3 (0.24%) PaaS
10 2 (0.16%) Amazon CloudWatch
10 2 (0.16%) AWS CloudTrail
10 2 (0.16%) AWS IoT
10 2 (0.16%) Google Workspace
10 2 (0.16%) OCI
10 2 (0.16%) PowerApps
11 1 (0.080%) Entra ID
Communications & Networking
1 252 (20.08%) Broadband
2 177 (14.10%) Wi-Fi
3 173 (13.78%) Ethernet
4 108 (8.61%) VPN
5 101 (8.05%) TCP/IP
6 84 (6.69%) VoIP
7 73 (5.82%) Firewall
8 45 (3.59%) DNS
9 42 (3.35%) LAN
9 42 (3.35%) WAN
10 39 (3.11%) 5G
10 39 (3.11%) DHCP
10 39 (3.11%) Network Security
11 38 (3.03%) VLAN
12 36 (2.87%) Wireless
13 35 (2.79%) 4G
14 24 (1.91%) Internet
15 22 (1.75%) IP Telephony
16 12 (0.96%) SD-WAN
17 11 (0.88%) MPLS
Database & Business Intelligence
1 11 (0.88%) Power BI
2 10 (0.80%) Amazon RDS
3 7 (0.56%) SQL Server
4 6 (0.48%) PostgreSQL
4 6 (0.48%) Tableau
5 4 (0.32%) Big Data
6 3 (0.24%) Amazon QuickSight
6 3 (0.24%) GIS
6 3 (0.24%) MongoDB
6 3 (0.24%) MySQL
7 2 (0.16%) NoSQL
7 2 (0.16%) Oracle Exadata
8 1 (0.080%) Apache Cassandra
8 1 (0.080%) CouchDB
8 1 (0.080%) Power Query
8 1 (0.080%) QlikView
8 1 (0.080%) Relational Database
8 1 (0.080%) SQLite
Development Applications
1 62 (4.94%) Cucumber
1 62 (4.94%) Robot Framework
2 10 (0.80%) Git
3 6 (0.48%) Jenkins
4 3 (0.24%) GitLab
5 2 (0.16%) Burp Suite
5 2 (0.16%) JIRA
5 2 (0.16%) Metasploit
5 2 (0.16%) Subversion
6 1 (0.080%) Bitbucket
6 1 (0.080%) CMake
6 1 (0.080%) Gatling
6 1 (0.080%) Gradle
6 1 (0.080%) JMeter
6 1 (0.080%) LabVIEW
6 1 (0.080%) LoadRunner
6 1 (0.080%) Maven
6 1 (0.080%) WiX
General
1 532 (42.39%) Social Skills
2 245 (19.52%) Finance
3 216 (17.21%) Presentation Skills
4 139 (11.08%) Automotive
5 130 (10.36%) Retail
6 118 (9.40%) Marketing
7 100 (7.97%) Public Sector
8 98 (7.81%) Manufacturing
9 95 (7.57%) Military
10 92 (7.33%) Law
11 91 (7.25%) Electronics
11 91 (7.25%) Inclusion and Diversity
12 84 (6.69%) Analytical Skills
13 65 (5.18%) Games
14 39 (3.11%) Organisational Skills
15 24 (1.91%) Legal
16 15 (1.20%) Back Office
17 12 (0.96%) Aerospace
18 10 (0.80%) Influencing Skills
19 8 (0.64%) Billing
Job Titles
1 218 (17.37%) Senior
2 216 (17.21%) Business Manager
3 215 (17.13%) Business Development Manager
3 215 (17.13%) Development Manager
4 149 (11.87%) Systems Engineer
5 89 (7.09%) Principal Engineer
6 86 (6.85%) Principal Systems Engineer
7 80 (6.37%) Analyst
8 63 (5.02%) Test Engineer
9 62 (4.94%) Test Automation Engineer
10 59 (4.70%) IT Support
10 59 (4.70%) Senior Systems Engineer
10 59 (4.70%) Support Engineer
11 56 (4.46%) Technical Support
12 45 (3.59%) Support Analyst
13 44 (3.51%) Lead
14 42 (3.35%) Senior Manager
15 41 (3.27%) Project Manager
16 40 (3.19%) Senior Business Manager
16 40 (3.19%) Senior Development Manager
Libraries, Frameworks & Software Standards
1 12 (0.96%) Node.js
2 9 (0.72%) Spring Boot
3 5 (0.40%) Kafka
3 5 (0.40%) ModSecurity
4 4 (0.32%) FreeSWITCH
4 4 (0.32%) HTML
4 4 (0.32%) RabbitMQ
4 4 (0.32%) REST
4 4 (0.32%) Spring
5 3 (0.24%) 802.1X
5 3 (0.24%) CSS
5 3 (0.24%) RESTful
6 2 (0.16%) ADO
6 2 (0.16%) AngularJS
6 2 (0.16%) FastAPI
6 2 (0.16%) GraphQL
6 2 (0.16%) React
7 1 (0.080%) DOM
7 1 (0.080%) Qt
7 1 (0.080%) STL
Miscellaneous
1 206 (16.41%) Social Media
2 72 (5.74%) Driving Licence
3 64 (5.10%) Linux Command Line
4 53 (4.22%) Self-Motivation
5 28 (2.23%) Analytical Mindset
6 26 (2.07%) Robotics
7 25 (1.99%) Blockchain
8 24 (1.91%) Management Information System
9 19 (1.51%) CCTV
10 14 (1.12%) IoT
11 13 (1.04%) Private Cloud
12 9 (0.72%) Handset
12 9 (0.72%) Renewable Energy
13 8 (0.64%) Embedded Systems
13 8 (0.64%) Virtual Team
14 7 (0.56%) Algorithms
14 7 (0.56%) Data Centre
15 6 (0.48%) Cyber Threat
15 6 (0.48%) Hybrid Cloud
15 6 (0.48%) Public Cloud
Operating Systems
1 151 (12.03%) Windows
2 107 (8.53%) Linux
3 58 (4.62%) Windows Server
4 30 (2.39%) Windows 10
5 13 (1.04%) Mac OS
6 7 (0.56%) Apple iOS
6 7 (0.56%) Unix
6 7 (0.56%) Windows Server 2019
7 1 (0.080%) Android
7 1 (0.080%) Embedded Linux
7 1 (0.080%) Robot Operating System
Processes & Methodologies
1 251 (20.00%) Problem-Solving
2 250 (19.92%) Business Development
3 236 (18.80%) Contract Negotiation
4 232 (18.49%) CRM
5 216 (17.21%) B2B
6 198 (15.78%) B2B Sales
7 196 (15.62%) Mentoring
8 191 (15.22%) Lead Generation
9 190 (15.14%) Customer Service
10 170 (13.55%) Performance Metrics
11 150 (11.95%) Cybersecurity
12 143 (11.39%) Systems Engineering
13 120 (9.56%) Coaching
14 86 (6.85%) Business Intelligence
14 86 (6.85%) DevOps
15 77 (6.14%) Service Delivery
16 76 (6.06%) Collaborative Working
16 76 (6.06%) Digital Marketing
16 76 (6.06%) Programme Management
17 67 (5.34%) System Testing
Programming Languages
1 94 (7.49%) Python
2 85 (6.77%) PowerShell
3 75 (5.98%) Bash
4 67 (5.34%) JavaScript
5 23 (1.83%) SQL
6 15 (1.20%) Java
7 14 (1.12%) C
8 11 (0.88%) C++
8 11 (0.88%) Perl
8 11 (0.88%) R
9 8 (0.64%) PHP
10 5 (0.40%) Assembly Language
10 5 (0.40%) Shell Script
11 4 (0.32%) MATLAB
11 4 (0.32%) TypeScript
12 3 (0.24%) C#
13 1 (0.080%) Rust
13 1 (0.080%) VBA
Qualifications
1 309 (24.62%) Degree
2 98 (7.81%) Security Cleared
3 47 (3.75%) BPSS Clearance
4 41 (3.27%) SC Cleared
5 34 (2.71%) Cisco Certification
6 26 (2.07%) CISSP
7 25 (1.99%) CEH
7 25 (1.99%) CompTIA Security+
7 25 (1.99%) Master's Degree
8 23 (1.83%) DV Cleared
9 21 (1.67%) CCNA
10 15 (1.20%) CCNP
11 13 (1.04%) Computer Science Degree
12 12 (0.96%) CISA
12 12 (0.96%) ISACA
13 11 (0.88%) JNCIA
14 10 (0.80%) Azure Certification
14 10 (0.80%) HNC
15 8 (0.64%) AWS Certification
16 7 (0.56%) Microsoft Certification
Quality Assurance & Compliance
1 72 (5.74%) QA
2 41 (3.27%) ISO/IEC 27001
3 29 (2.31%) NIST
4 26 (2.07%) PCI DSS
5 25 (1.99%) ITGC
6 11 (0.88%) ISO 9001
7 9 (0.72%) SLA
8 7 (0.56%) Cyber Essentials
9 6 (0.48%) Accessibility
10 5 (0.40%) GDPR
11 4 (0.32%) NCSC
12 2 (0.16%) Actionable Recommendations
12 2 (0.16%) COSHH
12 2 (0.16%) Data Quality
12 2 (0.16%) ISO 14001
12 2 (0.16%) JTAG
12 2 (0.16%) PMO
13 1 (0.080%) ECSS
13 1 (0.080%) ISO 13485
13 1 (0.080%) NEBOSH
System Software
1 43 (3.43%) Active Directory
2 17 (1.35%) Firmware
3 12 (0.96%) Docker
3 12 (0.96%) Hyper-V
4 11 (0.88%) VMware Infrastructure
5 5 (0.40%) Embedded Firmware
5 5 (0.40%) Virtual Machines
5 5 (0.40%) VMware ESXi
6 1 (0.080%) vSphere
Systems Management
1 15 (1.20%) Kubernetes
2 11 (0.88%) Microsoft Intune
3 9 (0.72%) Ansible
4 5 (0.40%) Autotask
4 5 (0.40%) Cisco CUCM
4 5 (0.40%) PaperCut
4 5 (0.40%) Terraform
4 5 (0.40%) vCenter Server
5 4 (0.32%) Puppet
6 2 (0.16%) Nmap
7 1 (0.080%) AirWatch
Vendors
1 299 (23.82%) Microsoft
2 167 (13.31%) Salesforce
3 98 (7.81%) SAP
4 60 (4.78%) BT
5 35 (2.79%) Cisco
6 21 (1.67%) Oracle
7 17 (1.35%) VMware
8 16 (1.27%) Apple
9 11 (0.88%) Sage
10 10 (0.80%) Datto
11 7 (0.56%) Juniper
12 6 (0.48%) Google
13 5 (0.40%) Avaya
13 5 (0.40%) Dell
13 5 (0.40%) HubSpot
13 5 (0.40%) SonicWALL
13 5 (0.40%) Sophos
13 5 (0.40%) Veeam
14 4 (0.32%) Freshdesk
15 3 (0.24%) PayPal