Bash Jobs in the UK excluding London

Bash Shell
UK > UK excluding London

The table below provides summary statistics for permanent job vacancies advertised in the UK excluding London requiring Bash skills. It includes a benchmarking guide to the annual salaries offered in vacancies that cited Bash over the 6 months leading up to 26 July 2024, comparing them to the same period in the previous two years.

6 months to
26 Jul 2024
Same period 2023 Same period 2022
Rank 239 142 210
Rank change year-on-year -97 +68 -44
Permanent jobs citing Bash 691 1,185 1,425
As % of all permanent jobs advertised in the UK excluding London 1.06% 2.46% 1.82%
As % of the Programming Languages category 3.79% 6.75% 4.18%
Number of salaries quoted 416 593 805
10th Percentile £39,500 £40,000 £36,250
25th Percentile £45,000 £47,000 £42,500
Median annual salary (50th Percentile) £57,500 £61,180 £57,500
Median % change year-on-year -6.01% +6.40% -
75th Percentile £67,968 £77,500 £75,000
90th Percentile £81,250 £87,500 £82,500
UK median annual salary £60,000 £70,000 £70,000
% change year-on-year -14.29% - +12.00%

All Programming Languages
UK excluding London

Bash falls under the Programming Languages category. For comparison with the information above, the following table provides summary statistics for all permanent job vacancies requiring coding skills in the UK excluding London.

Permanent vacancies with a requirement for coding skills 18,228 17,552 34,089
As % of all permanent jobs advertised in the UK excluding London 27.93% 36.46% 43.53%
Number of salaries quoted 12,662 11,914 21,248
10th Percentile £33,250 £35,000 £33,000
25th Percentile £42,500 £42,500 £41,250
Median annual salary (50th Percentile) £55,000 £55,000 £53,850
Median % change year-on-year - +2.14% +7.70%
75th Percentile £67,500 £71,231 £68,750
90th Percentile £80,000 £82,548 £82,500
UK median annual salary £60,000 £65,000 £62,500
% change year-on-year -7.69% +4.00% +8.70%

Bash
Job Vacancy Trend in the UK excluding London

Job postings citing Bash as a proportion of all IT jobs advertised in the UK excluding London.
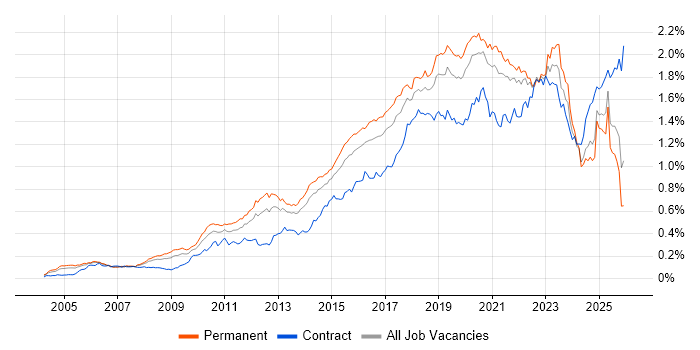
Job vacancy trend for Bash in the UK excluding London

Bash
Salary Trend in the UK excluding London

3-month moving average salary quoted in jobs citing Bash in the UK excluding London.

Salary trend for Bash in the UK excluding London

Bash
Salary Histogram in the UK excluding London

Salary distribution for jobs citing Bash in the UK excluding London over the 6 months to 26 July 2024.

Salary histogram for Bash in the UK excluding London

Bash
Job Locations in the UK excluding London

The table below looks at the demand and provides a guide to the median salaries quoted in IT jobs citing Bash within the UK excluding London region over the 6 months to 26 July 2024. The 'Rank Change' column provides an indication of the change in demand within each location based on the same 6 month period last year.

Location Rank Change
on Same Period
Last Year
Matching
Permanent
IT Job Ads
Median Salary
Past 6 Months
Median Salary
% Change
on Same Period
Last Year
Live
Jobs
South East -16 242 £55,000 -8.33% 18
South West -13 213 £58,000 -7.20% 20
North of England -156 85 £57,500 -8.00% 18
East of England +22 55 £60,000 +17.07% 5
North West -109 48 £65,000 -7.14% 11
Scotland -101 43 £55,000 -21.43% 8
Midlands -63 38 £60,000 +1.69% 9
Yorkshire -68 25 £49,274 -19.46% 5
West Midlands -25 21 £63,500 +6.72% 5
East Midlands -48 17 £57,500 +4.55% 4
Northern Ireland -4 12 £70,000 -6.67% 11
North East -8 12 £49,637 -41.60% 2
Wales -32 3 £45,000 -25.00% 3
Bash
UK

Bash
Co-occurring Skills and Capabilities in the UK excluding London by Category

The follow tables expand on the table above by listing co-occurrences grouped by category. The same employment type, locality and period is covered with up to 20 co-occurrences shown in each of the following categories:

Application Platforms
1 29 (4.20%) Apache
1 29 (4.20%) Apache Spark
2 24 (3.47%) nginx
3 22 (3.18%) SharePoint
4 20 (2.89%) Jupyter
5 13 (1.88%) OpenStack
6 11 (1.59%) Microsoft Exchange
7 8 (1.16%) Confluence
8 6 (0.87%) Tomcat
9 4 (0.58%) JBoss
9 4 (0.58%) Oracle Workflow
10 3 (0.43%) IIS
11 1 (0.14%) Apache Airflow
11 1 (0.14%) Moodle
Applications
1 12 (1.74%) Microsoft Excel
2 5 (0.72%) MS Visio
3 2 (0.29%) Abaqus
3 2 (0.29%) Microsoft PowerPoint
4 1 (0.14%) Microsoft Office
4 1 (0.14%) Microsoft Project
Business Applications
1 4 (0.58%) NEC Housing
Cloud Services
1 274 (39.65%) Azure
2 191 (27.64%) AWS
3 96 (13.89%) Entra ID
4 56 (8.10%) OpenShift
5 53 (7.67%) Azure DevOps
5 53 (7.67%) SaaS
6 43 (6.22%) GCP
7 39 (5.64%) Amazon S3
7 39 (5.64%) GitHub
8 34 (4.92%) Cloud Computing
9 30 (4.34%) Microsoft 365
10 27 (3.91%) IaaS
11 19 (2.75%) AWS CloudFormation
11 19 (2.75%) GitHub Actions
12 17 (2.46%) Serverless
13 16 (2.32%) MinIO
14 15 (2.17%) PaaS
15 11 (1.59%) Amazon EC2
15 11 (1.59%) Datadog
15 11 (1.59%) Nutanix
Communications & Networking
1 70 (10.13%) Broadband
2 68 (9.84%) 5G
3 63 (9.12%) Firewall
4 60 (8.68%) DNS
5 43 (6.22%) TCP/IP
6 37 (5.35%) DHCP
7 29 (4.20%) LAN
8 28 (4.05%) WAN
9 27 (3.91%) Network Security
10 24 (3.47%) HTTP
11 16 (2.32%) SAN
12 13 (1.88%) VPN
12 13 (1.88%) VSAN
13 8 (1.16%) SSL
13 8 (1.16%) Wireshark
14 7 (1.01%) Wireless
15 6 (0.87%) Fibre Channel
15 6 (0.87%) NAS
16 5 (0.72%) Intranet
16 5 (0.72%) WLAN
Database & Business Intelligence
1 28 (4.05%) MongoDB
2 25 (3.62%) Big Data
3 24 (3.47%) MySQL
4 23 (3.33%) SQL Server
5 22 (3.18%) Hadoop
6 18 (2.60%) PostgreSQL
7 17 (2.46%) Presto
8 14 (2.03%) Elasticsearch
8 14 (2.03%) Relational Database
9 8 (1.16%) Azkaban
9 8 (1.16%) Spark SQL
10 7 (1.01%) Amazon RDS
10 7 (1.01%) MariaDB
11 6 (0.87%) InfluxDB
12 5 (0.72%) Enterprise Data Warehouse
12 5 (0.72%) Ingres
12 5 (0.72%) NoSQL
12 5 (0.72%) Redis
13 4 (0.58%) Azure SQL Database
13 4 (0.58%) Data Mining
Development Applications
1 91 (13.17%) Jenkins
2 87 (12.59%) Git
3 41 (5.93%) JIRA
4 25 (3.62%) GitLab
5 17 (2.46%) Robot Framework
6 16 (2.32%) Atlassian Bamboo
7 15 (2.17%) Visual Studio
8 14 (2.03%) Bitbucket
9 10 (1.45%) CMake
10 9 (1.30%) JMeter
10 9 (1.30%) Team Foundation Server
10 9 (1.30%) TestRail
11 8 (1.16%) RStudio
11 8 (1.16%) SonarQube
11 8 (1.16%) Subversion
12 7 (1.01%) Artifactory
12 7 (1.01%) Maven
12 7 (1.01%) Selenium
13 6 (0.87%) Eclipse
14 5 (0.72%) TeamCity
General
1 141 (20.41%) Social Skills
2 131 (18.96%) Analytical Skills
3 76 (11.00%) Inclusion and Diversity
4 70 (10.13%) Finance
5 47 (6.80%) Aerospace
6 19 (2.75%) Marketing
7 18 (2.60%) Retail
8 14 (2.03%) Electronics
8 14 (2.03%) Manufacturing
8 14 (2.03%) Public Sector
9 13 (1.88%) Organisational Skills
10 8 (1.16%) Games
11 7 (1.01%) Documentation Skills
12 5 (0.72%) Aviation
12 5 (0.72%) Billing
12 5 (0.72%) Legal
12 5 (0.72%) Military
12 5 (0.72%) Swedish Language
12 5 (0.72%) Telecoms
13 3 (0.43%) Law
Job Titles
1 181 (26.19%) Senior
2 168 (24.31%) Software Engineer
3 77 (11.14%) Infrastructure Engineer
4 72 (10.42%) DevOps Engineer
5 70 (10.13%) Senior Software Engineer
6 68 (9.84%) Linux Specialist
7 67 (9.70%) Technical Specialist
8 58 (8.39%) Embedded Engineer
9 57 (8.25%) Embedded Software Engineer
10 54 (7.81%) Cloud Engineer
11 49 (7.09%) Administrator
12 42 (6.08%) Systems Engineer
13 41 (5.93%) Senior Infrastructure Engineer
14 38 (5.50%) Platform Engineer
14 38 (5.50%) Senior Data Warehouse Specialist
14 38 (5.50%) Senior Linux Specialist
14 38 (5.50%) Senior Technical Specialist
14 38 (5.50%) Senior Unix Technical Specialist
15 32 (4.63%) Linux Engineer
16 28 (4.05%) Data Engineer
Libraries, Frameworks & Software Standards
1 31 (4.49%) HTML
2 27 (3.91%) Elastic Stack
3 21 (3.04%) RabbitMQ
4 19 (2.75%) XML
4 19 (2.75%) YAML
5 17 (2.46%) Kafka
6 16 (2.32%) ActiveMQ
6 16 (2.32%) Apache NiFi
7 13 (1.88%) ARM Templates
7 13 (1.88%) EDI
7 13 (1.88%) HTML5
8 12 (1.74%) Node.js
9 11 (1.59%) Qt
9 11 (1.59%) Web Services
10 10 (1.45%) OpenMP
11 9 (1.30%) OpenCL
11 9 (1.30%) REST
11 9 (1.30%) VTK
11 9 (1.30%) WinForms
11 9 (1.30%) WPF
Miscellaneous
1 67 (9.70%) Social Media
2 44 (6.37%) Algorithms
3 37 (5.35%) Linux Command Line
4 31 (4.49%) Hybrid Cloud
5 30 (4.34%) Self-Motivation
6 19 (2.75%) Data Centre
7 18 (2.60%) IoT
8 17 (2.46%) CUDA
9 16 (2.32%) Management Information System
10 14 (2.03%) Video\Live Streaming
11 13 (1.88%) PKI
12 12 (1.74%) GNSS
13 11 (1.59%) Public Cloud
14 9 (1.30%) Onboarding
15 8 (1.16%) Robotics
16 7 (1.01%) Cloud Native
17 6 (0.87%) Distributed Systems
17 6 (0.87%) Life Science
17 6 (0.87%) NHS
17 6 (0.87%) Product Ownership
Operating Systems
1 465 (67.29%) Linux
2 176 (25.47%) Windows
3 92 (13.31%) Ubuntu
4 64 (9.26%) Embedded Linux
4 64 (9.26%) Red Hat Enterprise Linux
5 56 (8.10%) Unix
6 48 (6.95%) CentOS
7 37 (5.35%) Windows Server
8 32 (4.63%) Windows Server 2016
8 32 (4.63%) Windows Server 2019
9 29 (4.20%) Windows Server 2012
10 19 (2.75%) Debian
11 5 (0.72%) Windows 10
12 4 (0.58%) CoreOS
12 4 (0.58%) SUSE
13 3 (0.43%) Amazon Linux
13 3 (0.43%) Mac OS
13 3 (0.43%) Rocky
13 3 (0.43%) Windows Server 2008
14 2 (0.29%) SUSE Linux Enterprise Server
Processes & Methodologies
1 220 (31.84%) DevOps
2 194 (28.08%) Software Engineering
3 179 (25.90%) Cybersecurity
4 172 (24.89%) Problem-Solving
5 154 (22.29%) CI/CD
6 121 (17.51%) Containerisation
7 119 (17.22%) Artificial Intelligence
8 114 (16.50%) Agile
8 114 (16.50%) Infrastructure as Code
9 95 (13.75%) Computer Science
10 82 (11.87%) Infrastructure Engineering
11 77 (11.14%) SDLC
12 73 (10.56%) CRM
13 71 (10.27%) IT Strategy
13 71 (10.27%) Mentoring
14 70 (10.13%) Configuration Management
14 70 (10.13%) Technology Strategy
15 65 (9.41%) Software Testing
16 60 (8.68%) Open Source
17 57 (8.25%) Physics
Programming Languages
1 503 (72.79%) Python
2 254 (36.76%) PowerShell
3 135 (19.54%) C
4 87 (12.59%) C++
5 85 (12.30%) SQL
6 75 (10.85%) Perl
7 66 (9.55%) Java
8 54 (7.81%) Embedded C
9 46 (6.66%) Fortran
9 46 (6.66%) Rust
10 32 (4.63%) Shell Script
11 30 (4.34%) Bicep
12 22 (3.18%) Go
13 21 (3.04%) JavaScript
14 20 (2.89%) C#
14 20 (2.89%) Ruby
15 11 (1.59%) C-shell
16 10 (1.45%) PHP
17 8 (1.16%) Groovy
17 8 (1.16%) R
Qualifications
1 225 (32.56%) Security Cleared
2 138 (19.97%) Degree
3 81 (11.72%) DV Cleared
4 59 (8.54%) SC Cleared
5 45 (6.51%) PhD
6 44 (6.37%) Master's Degree
7 38 (5.50%) Computer Science Degree
8 12 (1.74%) AWS Certification
9 7 (1.01%) CCNA
9 7 (1.01%) Cisco Certification
9 7 (1.01%) CompTIA Security+
10 6 (0.87%) CISSP
10 6 (0.87%) HND
11 5 (0.72%) BPSS Clearance
12 4 (0.58%) CTC Cleared
13 3 (0.43%) CEH
13 3 (0.43%) CISA
13 3 (0.43%) GIAC
13 3 (0.43%) Network+ Certification
13 3 (0.43%) OSCP
Quality Assurance & Compliance
1 23 (3.33%) Data Quality
2 22 (3.18%) ISO/IEC 27001
3 19 (2.75%) PMO
4 12 (1.74%) QA
5 8 (1.16%) PCI DSS
6 7 (1.01%) Cyber Essentials
7 6 (0.87%) JTAG
8 5 (0.72%) HIPAA
8 5 (0.72%) SLA
8 5 (0.72%) Solvency II
9 4 (0.58%) GDPR
9 4 (0.58%) Sarbanes-Oxley
10 3 (0.43%) NIST
11 2 (0.29%) ISO/IEC 27002 (supersedes ISO/IEC 17799)
12 1 (0.14%) Disclosure Scotland
12 1 (0.14%) ISO/IEC 15288
System Software
1 157 (22.72%) Docker
2 132 (19.10%) Active Directory
3 87 (12.59%) VMware Infrastructure
4 43 (6.22%) Hyper-V
5 39 (5.64%) Virtual Machines
6 21 (3.04%) vSphere
7 20 (2.89%) Firmware
8 7 (1.01%) VMware ESXi
9 6 (0.87%) Slurm Workload Manager
9 6 (0.87%) Virtual Servers
10 5 (0.72%) Citrix Hypervisor
11 4 (0.58%) Embedded Firmware
11 4 (0.58%) NFS
11 4 (0.58%) Virtual Desktop
11 4 (0.58%) VMware NSX
11 4 (0.58%) VMware Server
12 3 (0.43%) Ceph
13 2 (0.29%) KVM
13 2 (0.29%) Lustre
14 1 (0.14%) Dovecot
Systems Management
1 176 (25.47%) Kubernetes
2 142 (20.55%) Ansible
3 113 (16.35%) Terraform
4 77 (11.14%) Microsoft Intune
5 76 (11.00%) Puppet
6 67 (9.70%) Jamf Pro
7 39 (5.64%) Grafana
8 27 (3.91%) Prometheus
9 21 (3.04%) Progress Chef
10 20 (2.89%) vCenter Server
11 16 (2.32%) HAProxy
12 13 (1.88%) Active Directory Federation Services
12 13 (1.88%) Nagios
13 8 (1.16%) Single Sign-On
14 6 (0.87%) Docker Swarm
14 6 (0.87%) logstash
15 5 (0.72%) Fluentd
15 5 (0.72%) Podman
15 5 (0.72%) Red Hat Spacewalk
15 5 (0.72%) SELinux
Vendors
1 224 (32.42%) Microsoft
2 102 (14.76%) VMware
3 76 (11.00%) Red Hat
4 71 (10.27%) CyberArk
5 67 (9.70%) Tanium
6 39 (5.64%) Oracle
7 23 (3.33%) Splunk
8 19 (2.75%) ServiceNow
9 16 (2.32%) Cisco
10 12 (1.74%) Google
10 12 (1.74%) IBM
11 11 (1.59%) Fortinet
12 8 (1.16%) Atlassian
12 8 (1.16%) Juniper
13 7 (1.01%) New Relic
13 7 (1.01%) Palo Alto
14 5 (0.72%) EMC
14 5 (0.72%) LogicMonitor
14 5 (0.72%) PagerDuty
14 5 (0.72%) Veracode