Mentoring Jobs in the UK excluding London

Mentorship
UK > UK excluding London

The table below provides summary statistics for permanent job vacancies advertised in the UK excluding London requiring Mentoring skills. It includes a benchmarking guide to the annual salaries offered in vacancies that cited Mentoring over the 6 months leading up to 8 December 2024, comparing them to the same period in the previous two years.

6 months to
8 Dec 2024
Same period 2023 Same period 2022
Rank 20 30 19
Rank change year-on-year +10 -11 +11
Permanent jobs citing Mentoring 3,386 2,321 6,973
As % of all permanent jobs advertised in the UK excluding London 6.95% 7.39% 10.60%
As % of the Processes & Methodologies category 7.99% 7.83% 11.10%
Number of salaries quoted 1,281 1,455 3,042
10th Percentile £35,000 £36,250 £35,764
25th Percentile £46,306 £46,521 £46,264
Median annual salary (50th Percentile) £60,000 £60,000 £60,000
Median % change year-on-year - - +4.35%
75th Percentile £75,000 £75,000 £75,781
90th Percentile £85,800 £87,500 £86,250
UK median annual salary £65,000 £67,500 £67,500
% change year-on-year -3.70% - +8.00%

All Process and Methodology Skills
UK excluding London

Mentoring falls under the Processes and Methodologies category. For comparison with the information above, the following table provides summary statistics for all permanent job vacancies requiring process or methodology skills in the UK excluding London.

Permanent vacancies with a requirement for process or methodology skills 42,383 29,635 62,838
As % of all permanent jobs advertised in the UK excluding London 86.98% 94.33% 95.55%
Number of salaries quoted 18,099 20,187 35,874
10th Percentile £31,500 £28,500 £30,831
25th Percentile £41,250 £38,750 £40,000
Median annual salary (50th Percentile) £54,714 £52,500 £53,500
Median % change year-on-year +4.22% -1.87% +7.00%
75th Percentile £68,750 £67,500 £69,763
90th Percentile £82,500 £81,250 £83,750
UK median annual salary £60,000 £60,000 £61,000
% change year-on-year - -1.64% +1.67%

Mentoring
Job Vacancy Trend in the UK excluding London

Job postings citing Mentoring as a proportion of all IT jobs advertised in the UK excluding London.
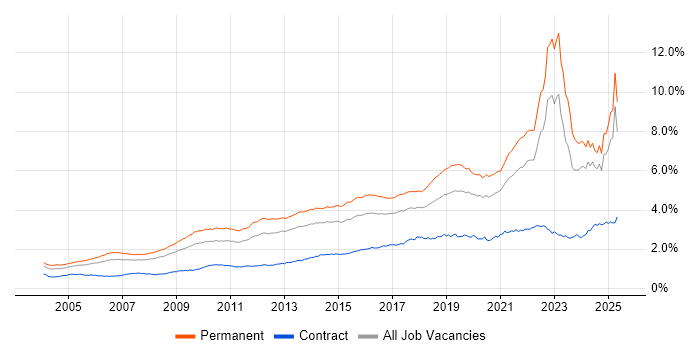
Job vacancy trend for Mentoring in the UK excluding London

Mentoring
Salary Trend in the UK excluding London

3-month moving average salary quoted in jobs citing Mentoring in the UK excluding London.

Salary trend for Mentoring in the UK excluding London

Mentoring
Salary Histogram in the UK excluding London

Salary distribution for jobs citing Mentoring in the UK excluding London over the 6 months to 8 December 2024.

Salary histogram for Mentoring in the UK excluding London

Mentoring
Job Locations in the UK excluding London

The table below looks at the demand and provides a guide to the median salaries quoted in IT jobs citing Mentoring within the UK excluding London region over the 6 months to 8 December 2024. The 'Rank Change' column provides an indication of the change in demand within each location based on the same 6 month period last year.

Location Rank Change
on Same Period
Last Year
Matching
Permanent
IT Job Ads
Median Salary
Past 6 Months
Median Salary
% Change
on Same Period
Last Year
Live
Jobs
North of England +18 1,153 £58,465 -6.46% 314
Midlands +26 746 £60,000 +4.35% 154
South East +8 628 £65,000 +1.79% 179
North West +8 622 £60,000 +4.73% 182
West Midlands +43 536 £60,000 +4.35% 92
Yorkshire +13 371 £58,309 -11.55% 87
South West -3 357 £60,000 - 122
Scotland -17 246 £60,000 -14.29% 72
East Midlands +1 210 £60,000 +3.90% 62
East of England -8 173 £58,000 -14.07% 72
North East +20 160 £57,965 -10.82% 45
Wales -21 54 £65,000 +13.71% 26
Northern Ireland -2 34 £63,750 +27.50% 20
Mentoring
UK

Mentoring
Co-occurring Skills and Capabilities in the UK excluding London by Category

The follow tables expand on the table above by listing co-occurrences grouped by category. The same employment type, locality and period is covered with up to 20 co-occurrences shown in each of the following categories:

Application Platforms
1 84 (2.48%) Oracle Application Server
2 46 (1.36%) SharePoint
3 44 (1.30%) Microsoft Exchange
4 40 (1.18%) Apache
5 33 (0.97%) CMS
6 31 (0.92%) IIS
7 22 (0.65%) Confluence
8 19 (0.56%) Apache Spark
9 16 (0.47%) Umbraco
10 15 (0.44%) Apache Airflow
11 13 (0.38%) nginx
12 11 (0.32%) SAS
12 11 (0.32%) Tuxedo
13 10 (0.30%) Sitecore CMS
14 7 (0.21%) Apache Solr
14 7 (0.21%) Camunda
15 5 (0.15%) OpenStack
15 5 (0.15%) WildFly
16 4 (0.12%) Strapi
16 4 (0.12%) WordPress
Applications
1 104 (3.07%) Microsoft Office
2 60 (1.77%) Microsoft Excel
3 17 (0.50%) Microsoft PowerPoint
4 12 (0.35%) Microsoft Project
5 8 (0.24%) OrCAD
6 7 (0.21%) Adobe XD
6 7 (0.21%) AutoCAD
7 6 (0.18%) Adobe Premiere
7 6 (0.18%) Sketch
8 5 (0.15%) PTC Creo
9 4 (0.12%) MS Visio
10 2 (0.059%) GNU Octave
10 2 (0.059%) Spreadsheet
10 2 (0.059%) UserZoom
11 1 (0.030%) Adobe Creative Suite
11 1 (0.030%) Moqups
11 1 (0.030%) ProjectWise
11 1 (0.030%) Revit
11 1 (0.030%) TargetLink
11 1 (0.030%) Trello
Business Applications
1 96 (2.84%) Oracle EBS
2 12 (0.35%) Oracle ERP
2 12 (0.35%) PeopleSoft HCM
3 11 (0.32%) Dynamics CRM
4 7 (0.21%) SystmOne
5 6 (0.18%) Magento
6 5 (0.15%) Salesforce CRM
6 5 (0.15%) SAP S/4HANA
6 5 (0.15%) Shopify
6 5 (0.15%) Teamcenter
7 3 (0.089%) NetSuite
7 3 (0.089%) Ripple
7 3 (0.089%) Ripple XRP
8 2 (0.059%) Sparx Enterprise Architect
8 2 (0.059%) Sprinklr
9 1 (0.030%) Dynamics GP
9 1 (0.030%) Payment Gateway
9 1 (0.030%) Sage X3
9 1 (0.030%) SAP MDG
9 1 (0.030%) TIBCO iProcess
Cloud Services
1 617 (18.22%) Azure
2 524 (15.48%) AWS
3 162 (4.78%) SaaS
4 142 (4.19%) Power Platform
5 138 (4.08%) GCP
6 130 (3.84%) Microsoft 365
7 124 (3.66%) GitHub
8 122 (3.60%) Azure DevOps
9 83 (2.45%) Amazon S3
10 78 (2.30%) IBM Cloud
11 71 (2.10%) OCI
12 69 (2.04%) GitHub Actions
13 65 (1.92%) Entra ID
14 58 (1.71%) Serverless
15 56 (1.65%) Amazon EKS
16 54 (1.59%) Route 53
17 50 (1.48%) Amazon ECR
18 38 (1.12%) PaaS
19 36 (1.06%) IaaS
20 34 (1.00%) AWS CloudFormation
Communications & Networking
1 241 (7.12%) Internet
2 239 (7.06%) Network Security
3 204 (6.02%) WLAN
4 128 (3.78%) Firewall
5 68 (2.01%) WAN
6 67 (1.98%) Intrusion Detection
7 50 (1.48%) Broadband
7 50 (1.48%) LAN
8 45 (1.33%) SAN
9 41 (1.21%) DNS
10 37 (1.09%) NAS
10 37 (1.09%) Wi-Fi
11 36 (1.06%) VPN
12 33 (0.97%) OSPF
13 29 (0.86%) TCP/IP
14 28 (0.83%) MPLS
15 24 (0.71%) Fibre Channel
16 23 (0.68%) BGP
16 23 (0.68%) SD-WAN
17 21 (0.62%) NGFW
Database & Business Intelligence
1 144 (4.25%) Data Warehouse
2 136 (4.02%) NoSQL
2 136 (4.02%) Relational Database
3 132 (3.90%) SQL Server
4 119 (3.51%) Power BI
5 108 (3.19%) MySQL
6 105 (3.10%) MongoDB
7 102 (3.01%) RDBMS
8 92 (2.72%) PostgreSQL
9 85 (2.51%) Enterprise Data Warehouse
10 73 (2.16%) Amazon RDS
11 46 (1.36%) Tableau
12 40 (1.18%) Azure SQL Database
13 38 (1.12%) Elasticsearch
14 33 (0.97%) Data Lake
15 28 (0.83%) DynamoDB
16 23 (0.68%) SQL Server Integration Services
17 21 (0.62%) Amazon Aurora
18 20 (0.59%) Oracle Database
19 19 (0.56%) SQL Server Reporting Services
Development Applications
1 138 (4.08%) Git
2 62 (1.83%) Jenkins
3 61 (1.80%) JIRA
4 60 (1.77%) GitLab
5 50 (1.48%) Selenium
6 30 (0.89%) CircleCI
7 26 (0.77%) SonarQube
8 25 (0.74%) Subversion
9 22 (0.65%) Maven
10 17 (0.50%) Postman
11 15 (0.44%) Gatling
12 13 (0.38%) Visual Studio
13 12 (0.35%) Cypress.io
14 11 (0.32%) CMake
15 10 (0.30%) Eclipse
15 10 (0.30%) Eclipse RCP
15 10 (0.30%) JMeter
16 9 (0.27%) Bitbucket
17 8 (0.24%) RStudio
17 8 (0.24%) SoapUI
General
1 1,098 (32.43%) Social Skills
2 595 (17.57%) Finance
3 476 (14.06%) Analytical Skills
4 436 (12.88%) Inclusion and Diversity
5 303 (8.95%) Public Sector
6 297 (8.77%) Retail
7 233 (6.88%) Presentation Skills
8 192 (5.67%) Manufacturing
9 177 (5.23%) Influencing Skills
10 163 (4.81%) Organisational Skills
11 147 (4.34%) Legal
12 118 (3.48%) Pharmaceutical
13 113 (3.34%) Military
14 107 (3.16%) Marketing
15 94 (2.78%) Telecoms
16 92 (2.72%) Law
17 58 (1.71%) Banking
18 48 (1.42%) Electronics
19 42 (1.24%) Aerospace
20 38 (1.12%) Games
Job Titles
1 898 (26.52%) Senior
2 637 (18.81%) Lead
3 333 (9.83%) Developer
4 234 (6.91%) IT Support
5 230 (6.79%) Support Engineer
6 223 (6.59%) Software Engineer
7 211 (6.23%) IT Engineer
8 208 (6.14%) IT Support Engineer
9 197 (5.82%) Architect
10 196 (5.79%) DevOps Engineer
11 167 (4.93%) Senior Manager
12 139 (4.11%) Audit Manager
13 129 (3.81%) Senior DevOps
13 129 (3.81%) Senior DevOps Engineer
14 116 (3.43%) Team Leader
15 105 (3.10%) Senior Developer
16 103 (3.04%) Senior Software Engineer
17 96 (2.84%) Analyst
18 85 (2.51%) IT Manager
19 76 (2.24%) Systems Engineer
Libraries, Frameworks & Software Standards
1 267 (7.89%) .NET
2 198 (5.85%) React
3 181 (5.35%) HTML
4 139 (4.11%) CSS
5 125 (3.69%) AngularJS
6 122 (3.60%) Node.js
7 91 (2.69%) RESTful
8 87 (2.57%) REST
9 70 (2.07%) ASP.NET
10 64 (1.89%) .NET Core
10 64 (1.89%) Spring
11 56 (1.65%) Vue
12 49 (1.45%) Kafka
12 49 (1.45%) Web Services
13 48 (1.42%) Spring Boot
14 45 (1.33%) .NET Framework
15 35 (1.03%) GraphQL
16 33 (0.97%) XML
17 32 (0.95%) SOAP
18 28 (0.83%) Laravel
Miscellaneous
1 345 (10.19%) Onboarding
2 222 (6.56%) Driving Licence
3 172 (5.08%) Management Information System
4 149 (4.40%) Self-Motivation
5 128 (3.78%) Hybrid Cloud
6 100 (2.95%) e-Learning
7 92 (2.72%) Product Ownership
8 85 (2.51%) Blockchain
9 83 (2.45%) Public Cloud
10 78 (2.30%) Cyberattack
11 69 (2.04%) Data Centre
12 55 (1.62%) Greenfield Project
13 51 (1.51%) Distributed Systems
14 48 (1.42%) Algorithms
15 47 (1.39%) IoT
16 44 (1.30%) Embedded Systems
17 41 (1.21%) Cloud Native
18 38 (1.12%) FPGA
18 38 (1.12%) Legacy Systems
19 37 (1.09%) Cyber Threat
Operating Systems
1 449 (13.26%) Windows
2 428 (12.64%) Linux
3 114 (3.37%) Windows Server
4 50 (1.48%) Unix
5 30 (0.89%) Android
6 25 (0.74%) Apple iOS
7 22 (0.65%) Red Hat Enterprise Linux
8 15 (0.44%) Windows 10
9 13 (0.38%) VMS
10 8 (0.24%) Windows Server 2012
11 7 (0.21%) Windows Server 2016
11 7 (0.21%) Windows Server 2019
12 5 (0.15%) CentOS
12 5 (0.15%) Ubuntu
13 4 (0.12%) Data ONTAP
13 4 (0.12%) Debian
13 4 (0.12%) Embedded Linux
14 3 (0.089%) Mac OS
14 3 (0.089%) Oracle Linux
14 3 (0.089%) zOS
Processes & Methodologies
1 1,235 (36.47%) Coaching
2 1,131 (33.40%) Problem-Solving
3 1,116 (32.96%) Agile
4 708 (20.91%) Software Engineering
5 624 (18.43%) DevOps
6 447 (13.20%) ITIL
7 395 (11.67%) Computer Science
8 341 (10.07%) Customer Service
9 331 (9.78%) Project Management
10 321 (9.48%) CI/CD
11 320 (9.45%) Analytics
12 310 (9.16%) Data Analysis
13 308 (9.10%) Continuous Improvement
14 298 (8.80%) Mathematics
15 292 (8.62%) Roadmaps
16 291 (8.59%) Stakeholder Management
17 274 (8.09%) Asset Management
18 258 (7.62%) Cybersecurity
18 258 (7.62%) Test Automation
19 255 (7.53%) Creative Thinking
Programming Languages
1 408 (12.05%) Python
2 403 (11.90%) SQL
3 293 (8.65%) C#
4 272 (8.03%) JavaScript
5 240 (7.09%) Java
6 122 (3.60%) TypeScript
7 93 (2.75%) PowerShell
8 83 (2.45%) PHP
9 79 (2.33%) Bash
10 73 (2.16%) C++
11 71 (2.10%) R
12 53 (1.57%) C
13 47 (1.39%) Shell Script
14 35 (1.03%) Go
15 29 (0.86%) SystemVerilog
16 26 (0.77%) Assembly Language
16 26 (0.77%) Tcl
17 22 (0.65%) Ruby
17 22 (0.65%) Scala
18 15 (0.44%) VB.NET
Qualifications
1 891 (26.31%) Degree
2 308 (9.10%) Computer Science Degree
3 286 (8.45%) Security Cleared
4 233 (6.88%) Cisco Certification
5 227 (6.70%) Microsoft Certification
6 219 (6.47%) CCNP
7 215 (6.35%) CCNA
8 211 (6.23%) LPIC
9 203 (6.00%) MCP
10 202 (5.97%) HNC
10 202 (5.97%) MCSE
11 124 (3.66%) SC Cleared
12 109 (3.22%) DBS Check
13 74 (2.19%) DV Cleared
14 58 (1.71%) ACCA
15 52 (1.54%) BPSS Clearance
16 45 (1.33%) Azure Certification
17 34 (1.00%) Master's Degree
18 31 (0.92%) CISSP
19 27 (0.80%) ITIL Certification
Quality Assurance & Compliance
1 277 (8.18%) QA
2 113 (3.34%) Accessibility
3 103 (3.04%) GMP
4 73 (2.16%) IFRS
5 69 (2.04%) GAAP
6 56 (1.65%) SLA
7 50 (1.48%) Data Quality
8 41 (1.21%) NIST
9 39 (1.15%) ISO/IEC 27001
10 25 (0.74%) PMO
11 24 (0.71%) GDPR
12 22 (0.65%) NCSC
13 18 (0.53%) SOC 2
14 16 (0.47%) PCI DSS
14 16 (0.47%) WCAG
15 14 (0.41%) Cyber Essentials
16 10 (0.30%) Cyber Essentials PLUS
17 9 (0.27%) IFRS 9
18 8 (0.24%) ISO 9001
19 7 (0.21%) NIST 800
System Software
1 199 (5.88%) Docker
2 102 (3.01%) Active Directory
3 56 (1.65%) VMware Infrastructure
4 41 (1.21%) Firmware
5 38 (1.12%) Hyper-V
6 31 (0.92%) Virtual Machines
7 25 (0.74%) VMware ESXi
8 18 (0.53%) Embedded Firmware
9 11 (0.32%) Virtual Desktop
10 10 (0.30%) VMware Server
10 10 (0.30%) vSphere
11 7 (0.21%) Virtual Servers
12 4 (0.12%) Ceph
13 2 (0.059%) XenApp
14 1 (0.030%) KVM
Systems Management
1 242 (7.15%) Kubernetes
2 197 (5.82%) Terraform
3 114 (3.37%) Ansible
4 67 (1.98%) Prometheus
5 37 (1.09%) Microsoft Intune
6 21 (0.62%) Puppet
7 18 (0.53%) Progress Chef
8 16 (0.47%) vCenter Server
9 13 (0.38%) Grafana
9 13 (0.38%) Single Sign-On
10 11 (0.32%) Active Directory Federation Services
11 8 (0.24%) Failover Clustering
12 6 (0.18%) CA Endevor
12 6 (0.18%) Packer
13 5 (0.15%) SCCM
13 5 (0.15%) WSUS
14 4 (0.12%) Nagios
14 4 (0.12%) N-central
15 3 (0.089%) Fortio
15 3 (0.089%) Kiali
Vendors
1 579 (17.10%) Microsoft
2 247 (7.29%) Cisco
3 143 (4.22%) Oracle
4 100 (2.95%) Red Hat
5 93 (2.75%) VMware
6 87 (2.57%) IBM
7 61 (1.80%) Dynatrace
8 59 (1.74%) Google
9 53 (1.57%) Databricks
10 42 (1.24%) ServiceNow
11 40 (1.18%) Salesforce
12 35 (1.03%) SAP
13 27 (0.80%) Xilinx
14 23 (0.68%) Planview
15 22 (0.65%) Fortinet
16 21 (0.62%) Aruba
16 21 (0.62%) Juniper
16 21 (0.62%) Veeam
17 17 (0.50%) Adobe
17 17 (0.50%) EMC