C# Jobs in the UK excluding London

C#
UK > UK excluding London

The table below provides summary statistics for permanent job vacancies advertised in the UK excluding London requiring C# skills. It includes a benchmarking guide to the annual salaries offered in vacancies that cited C# over the 6 months leading up to 26 July 2024, comparing them to the same period in the previous two years.

6 months to
26 Jul 2024
Same period 2023 Same period 2022
Rank 20 22 15
Rank change year-on-year +2 -7 -6
Permanent jobs citing C# 4,938 4,381 9,021
As % of all permanent jobs advertised in the UK excluding London 7.57% 9.10% 11.52%
As % of the Programming Languages category 27.09% 24.96% 26.46%
Number of salaries quoted 3,921 3,368 5,869
10th Percentile £35,000 £36,733 £33,450
25th Percentile £42,500 £45,000 £41,250
Median annual salary (50th Percentile) £55,000 £55,000 £52,500
Median % change year-on-year - +4.76% +5.00%
75th Percentile £65,000 £70,000 £65,720
90th Percentile £75,000 £81,250 £77,000
UK median annual salary £57,500 £62,500 £59,500
% change year-on-year -8.00% +5.04% +8.18%

All Programming Languages
UK excluding London

C# falls under the Programming Languages category. For comparison with the information above, the following table provides summary statistics for all permanent job vacancies requiring coding skills in the UK excluding London.

Permanent vacancies with a requirement for coding skills 18,228 17,552 34,089
As % of all permanent jobs advertised in the UK excluding London 27.93% 36.46% 43.53%
Number of salaries quoted 12,662 11,914 21,248
10th Percentile £33,250 £35,000 £33,000
25th Percentile £42,500 £42,500 £41,250
Median annual salary (50th Percentile) £55,000 £55,000 £53,850
Median % change year-on-year - +2.14% +7.70%
75th Percentile £67,500 £71,231 £68,750
90th Percentile £80,000 £82,548 £82,500
UK median annual salary £60,000 £65,000 £62,500
% change year-on-year -7.69% +4.00% +8.70%

C#
Job Vacancy Trend in the UK excluding London

Job postings citing C# as a proportion of all IT jobs advertised in the UK excluding London.
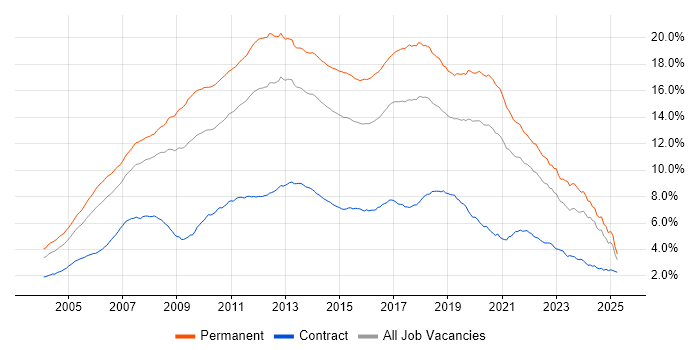
Job vacancy trend for C# in the UK excluding London

C#
Salary Trend in the UK excluding London

3-month moving average salary quoted in jobs citing C# in the UK excluding London.

Salary trend for C# in the UK excluding London

C#
Salary Histogram in the UK excluding London

Salary distribution for jobs citing C# in the UK excluding London over the 6 months to 26 July 2024.

Salary histogram for C# in the UK excluding London

C#
Job Locations in the UK excluding London

The table below looks at the demand and provides a guide to the median salaries quoted in IT jobs citing C# within the UK excluding London region over the 6 months to 26 July 2024. The 'Rank Change' column provides an indication of the change in demand within each location based on the same 6 month period last year.

Location Rank Change
on Same Period
Last Year
Matching
Permanent
IT Job Ads
Median Salary
Past 6 Months
Median Salary
% Change
on Same Period
Last Year
Live
Jobs
South East -2 1,339 £60,000 - 175
North of England +15 1,305 £52,500 -4.55% 209
Midlands +8 893 £52,500 -4.55% 146
North West +15 716 £52,500 -4.55% 110
South West +6 517 £50,000 -9.09% 102
Yorkshire +14 457 £52,500 -4.55% 68
West Midlands +16 455 £52,500 -4.55% 81
East Midlands +7 436 £50,000 -9.09% 65
Scotland -27 333 £55,000 +4.76% 57
East of England +10 316 £55,000 -4.35% 93
Wales +9 177 £50,000 +11.11% 11
North East +10 132 £60,000 +14.29% 33
Northern Ireland -15 57 £55,000 +10.00% 42
Channel Islands - 1 £57,500 -
C#
UK

C#
Co-occurring Skills and Capabilities in the UK excluding London by Category

The follow tables expand on the table above by listing co-occurrences grouped by category. The same employment type, locality and period is covered with up to 20 co-occurrences shown in each of the following categories:

Application Platforms
1 167 (3.38%) ArcGIS
2 155 (3.14%) GeoServer
3 117 (2.37%) IIS
4 106 (2.15%) CMS
5 81 (1.64%) Umbraco
6 65 (1.32%) SharePoint
7 52 (1.05%) Confluence
8 41 (0.83%) Microsoft Exchange
9 34 (0.69%) Sitecore CMS
10 30 (0.61%) Kentico
11 28 (0.57%) Headless CMS
12 26 (0.53%) Apache
13 18 (0.36%) NServiceBus
14 11 (0.22%) Apache Solr
15 7 (0.14%) Kinematics
16 6 (0.12%) Apache Spark
16 6 (0.12%) BizTalk Server
16 6 (0.12%) WinCC
17 4 (0.081%) nginx
18 3 (0.061%) ThingWorx
Applications
1 43 (0.87%) Microsoft Office
2 33 (0.67%) Microsoft Excel
3 9 (0.18%) MS Visio
4 8 (0.16%) Photoshop
4 8 (0.16%) Simulink
5 6 (0.12%) Adobe XD
5 6 (0.12%) OrCAD
6 4 (0.081%) Adobe Illustrator
6 4 (0.081%) Fusion 360
7 3 (0.061%) AutoCAD
7 3 (0.061%) Autodesk Inventor
7 3 (0.061%) Revit
7 3 (0.061%) S-PLUS
8 1 (0.020%) Blender
8 1 (0.020%) Doxygen
8 1 (0.020%) GNU Octave
8 1 (0.020%) InfoPath
8 1 (0.020%) Mathematica
8 1 (0.020%) Microsoft PowerPoint
8 1 (0.020%) SOLIDWORKS
Business Applications
1 107 (2.17%) Dynamics CRM
2 14 (0.28%) Payment Gateway
3 12 (0.24%) Oracle Receivables
4 10 (0.20%) Sage 200
5 6 (0.12%) Sage 50
6 5 (0.10%) Dynamics AX
6 5 (0.10%) Salesforce CRM
7 4 (0.081%) SDL Web 8
8 3 (0.061%) SAP ERP
8 3 (0.061%) SystmOne
9 2 (0.041%) Dynamics NAV
9 2 (0.041%) Epicor Tropos
9 2 (0.041%) iTrent
9 2 (0.041%) Oracle EBS
9 2 (0.041%) SAP MII
9 2 (0.041%) SAP S/4HANA
10 1 (0.020%) DELMIA
10 1 (0.020%) Scribe Insight
10 1 (0.020%) Teamcenter
10 1 (0.020%) Visualfiles
Cloud Services
1 2,419 (48.99%) Azure
2 720 (14.58%) AWS
3 616 (12.47%) Azure DevOps
4 267 (5.41%) Power Platform
5 254 (5.14%) IBM Cloud
6 242 (4.90%) SaaS
7 235 (4.76%) Serverless
8 188 (3.81%) Azure Service Bus
9 178 (3.60%) Azure Functions
10 170 (3.44%) Dynamics 365
11 169 (3.42%) Azure Logic Apps
12 127 (2.57%) Azure API Management
13 111 (2.25%) Power Automate
14 101 (2.05%) PowerApps
15 88 (1.78%) GitHub
16 72 (1.46%) Microsoft 365
17 52 (1.05%) Azure Cosmos DB
18 39 (0.79%) GCP
19 35 (0.71%) AWS Lambda
20 33 (0.67%) PaaS
Communications & Networking
1 72 (1.46%) Internet
2 53 (1.07%) DNS
3 47 (0.95%) Firewall
4 36 (0.73%) TCP/IP
5 25 (0.51%) DHCP
6 24 (0.49%) Network Security
7 21 (0.43%) SSL
8 20 (0.41%) Ethernet
9 16 (0.32%) Modbus
10 15 (0.30%) Wireless
11 13 (0.26%) RS-232
12 12 (0.24%) Bluetooth
13 10 (0.20%) HTTP
14 9 (0.18%) Intranet
14 9 (0.18%) VPN
14 9 (0.18%) Wi-Fi
15 7 (0.14%) 4G
15 7 (0.14%) GPRS
15 7 (0.14%) RFID
16 5 (0.10%) RS-485
Database & Business Intelligence
1 1,181 (23.92%) SQL Server
2 478 (9.68%) PostgreSQL
3 416 (8.42%) NoSQL
4 392 (7.94%) MongoDB
5 253 (5.12%) Relational Database
6 231 (4.68%) DB2
7 165 (3.34%) GIS
8 155 (3.14%) QGIS
9 138 (2.79%) MySQL
10 130 (2.63%) Power BI
11 97 (1.96%) Azure SQL Database
12 83 (1.68%) Elasticsearch
13 73 (1.48%) SQL Server Integration Services
14 61 (1.24%) SQL Server Reporting Services
15 44 (0.89%) Redis
16 38 (0.77%) Data Warehouse
16 38 (0.77%) DynamoDB
17 23 (0.47%) Big Data
18 20 (0.41%) MS Access
19 19 (0.38%) SQL Server Analysis Services
Development Applications
1 540 (10.94%) Git
2 361 (7.31%) Visual Studio
3 136 (2.75%) Selenium
4 130 (2.63%) JIRA
5 92 (1.86%) Team Foundation Server
6 87 (1.76%) Jenkins
7 67 (1.36%) Cypress.io
8 65 (1.32%) NUnit
9 51 (1.03%) GitLab
9 51 (1.03%) Octopus Deploy
10 48 (0.97%) TeamCity
11 44 (0.89%) Bitbucket
12 42 (0.85%) Jasmine
13 40 (0.81%) Postman
14 35 (0.71%) LabVIEW
15 34 (0.69%) SoapUI
16 29 (0.59%) CircleCI
17 28 (0.57%) Karma Test Runner
17 28 (0.57%) Sourcetree
18 25 (0.51%) MSBuild
General
1 821 (16.63%) Social Skills
2 424 (8.59%) Finance
3 358 (7.25%) Public Sector
4 279 (5.65%) Analytical Skills
5 226 (4.58%) Inclusion and Diversity
6 164 (3.32%) Law
7 160 (3.24%) Manufacturing
8 125 (2.53%) Games
9 121 (2.45%) Retail
10 119 (2.41%) Marketing
11 100 (2.03%) Electronics
12 91 (1.84%) Organisational Skills
13 73 (1.48%) Legal
14 52 (1.05%) Automotive
15 49 (0.99%) Advertising
16 46 (0.93%) Presentation Skills
17 45 (0.91%) Aerospace
18 42 (0.85%) Tech for Good
19 34 (0.69%) Banking
20 32 (0.65%) Military
Job Titles
1 2,935 (59.44%) Developer
2 1,266 (25.64%) .NET Developer
3 963 (19.50%) Senior
4 929 (18.81%) Software Engineer
5 871 (17.64%) C# Developer
6 839 (16.99%) Software Developer
7 573 (11.60%) Senior Developer
8 560 (11.34%) C# .NET Developer
9 382 (7.74%) Lead
10 337 (6.82%) Full Stack Developer
11 288 (5.83%) C# Software Developer
12 287 (5.81%) Senior Software Engineer
13 254 (5.14%) Senior .NET Developer
14 216 (4.37%) Azure Developer
15 198 (4.01%) .NET Software Developer
16 187 (3.79%) Lead Developer
17 177 (3.58%) Senior C# Developer
18 176 (3.56%) C# Software Engineer
19 170 (3.44%) Full Stack Engineer
20 162 (3.28%) Senior Software Developer
Libraries, Frameworks & Software Standards
1 3,591 (72.72%) .NET
2 1,233 (24.97%) ASP.NET
3 1,225 (24.81%) CSS
4 1,185 (24.00%) React
5 1,179 (23.88%) HTML
6 1,127 (22.82%) AngularJS
7 1,062 (21.51%) .NET Core
8 825 (16.71%) .NET Framework
9 641 (12.98%) ASP.NET Web API
10 603 (12.21%) Vue
11 529 (10.71%) Entity Framework
12 480 (9.72%) REST
13 467 (9.46%) Web Services
14 394 (7.98%) jQuery
15 383 (7.76%) Twitter Bootstrap
16 360 (7.29%) ASP.NET MVC
17 359 (7.27%) RESTful
18 318 (6.44%) ASP.NET Core
19 309 (6.26%) HTML5
20 269 (5.45%) Blazor
Miscellaneous
1 307 (6.22%) Algorithms
2 257 (5.20%) Hybrid Cloud
3 256 (5.18%) Blockchain
4 253 (5.12%) Data Structures
5 149 (3.02%) Product Ownership
6 142 (2.88%) Self-Motivation
7 134 (2.71%) Mobile App
8 124 (2.51%) e-Learning
9 123 (2.49%) Greenfield Project
10 81 (1.64%) Enterprise Software
11 72 (1.46%) Cloud Native
12 61 (1.24%) Virtual Reality
13 57 (1.15%) Onboarding
14 56 (1.13%) Distributed Systems
15 46 (0.93%) Public Cloud
16 43 (0.87%) NHS
17 40 (0.81%) IoT
17 40 (0.81%) Social Media
18 36 (0.73%) Legacy Systems
19 32 (0.65%) Virtual Team
Operating Systems
1 568 (11.50%) Windows
2 434 (8.79%) Linux
3 308 (6.24%) Android
4 276 (5.59%) Apple iOS
5 38 (0.77%) Windows Server
6 21 (0.43%) AIX
7 19 (0.38%) Windows Server 2019
8 16 (0.32%) Windows Server 2016
9 13 (0.26%) Windows 10
9 13 (0.26%) Windows 7
10 10 (0.20%) Mac OS
11 7 (0.14%) Embedded Linux
11 7 (0.14%) VMS
12 4 (0.081%) Ubuntu
13 3 (0.061%) Unix
13 3 (0.061%) VxWorks
13 3 (0.061%) Windows Embedded Compact
14 2 (0.041%) Debian
14 2 (0.041%) FreeRTOS
14 2 (0.041%) Windows Mobile
Processes & Methodologies
1 1,924 (38.96%) Agile
2 1,417 (28.70%) Software Engineering
3 1,321 (26.75%) Full Stack Development
4 1,142 (23.13%) DevOps
5 932 (18.87%) MVC
6 773 (15.65%) Problem-Solving
7 677 (13.71%) Web Development
8 587 (11.89%) Microservices
9 532 (10.77%) Design Patterns
10 527 (10.67%) Artificial Intelligence
11 525 (10.63%) OO
12 521 (10.55%) Computer Science
13 496 (10.04%) CI/CD
14 452 (9.15%) SOLID
15 438 (8.87%) Mentoring
16 391 (7.92%) Scrum
17 377 (7.63%) OOP
18 367 (7.43%) User Experience
19 366 (7.41%) TDD
20 319 (6.46%) SDLC
Programming Languages
1 2,041 (41.33%) JavaScript
2 1,633 (33.07%) SQL
3 689 (13.95%) Python
4 609 (12.33%) TypeScript
5 436 (8.83%) C++
6 391 (7.92%) Java
7 313 (6.34%) C
8 186 (3.77%) VB.NET
9 181 (3.67%) T-SQL
10 168 (3.40%) VB
11 143 (2.90%) PowerShell
12 86 (1.74%) PHP
13 63 (1.28%) XAML
14 40 (0.81%) Bicep
15 38 (0.77%) MATLAB
16 32 (0.65%) Fortran
17 31 (0.63%) VBScript
18 30 (0.61%) VB6
19 25 (0.51%) Go
20 20 (0.41%) Bash
Qualifications
1 824 (16.69%) Degree
2 379 (7.68%) Security Cleared
3 258 (5.22%) SC Cleared
4 246 (4.98%) Computer Science Degree
5 58 (1.17%) Master's Degree
6 55 (1.11%) DV Cleared
7 48 (0.97%) Microsoft Certification
8 35 (0.71%) BPSS Clearance
9 32 (0.65%) DBS Check
10 28 (0.57%) Azure Certification
11 20 (0.41%) PhD
12 16 (0.32%) ISTQB
12 16 (0.32%) ITIL Foundation Certificate
13 10 (0.20%) ITIL Certification
14 8 (0.16%) CIPD
14 8 (0.16%) Numerate Degree
15 7 (0.14%) AWS Certification
15 7 (0.14%) HND
16 6 (0.12%) HNC
16 6 (0.12%) MCSE
Quality Assurance & Compliance
1 224 (4.54%) QA
2 47 (0.95%) Accessibility
3 39 (0.79%) GDPR
4 37 (0.75%) WCAG
5 11 (0.22%) ISO/IEC 27001
6 10 (0.20%) HIPAA
6 10 (0.20%) IEC 61131
6 10 (0.20%) ISO 13485
6 10 (0.20%) SLA
7 7 (0.14%) MISRA
8 5 (0.10%) Data Quality
9 4 (0.081%) DICOM
9 4 (0.081%) HL7
9 4 (0.081%) JTAG
9 4 (0.081%) PMO
10 3 (0.061%) MISRA C
11 2 (0.041%) IEC 62304
11 2 (0.041%) PCI DSS
12 1 (0.020%) AQAP
12 1 (0.020%) Cyber Essentials
System Software
1 355 (7.19%) Docker
2 46 (0.93%) Active Directory
3 39 (0.79%) Firmware
4 34 (0.69%) Virtual Machines
5 33 (0.67%) VMware Infrastructure
6 18 (0.36%) Virtual Desktop
7 13 (0.26%) Microsoft App-V
8 12 (0.24%) Embedded Firmware
9 5 (0.10%) VMware ESXi
10 4 (0.081%) Hyper-V
10 4 (0.081%) vSphere
11 3 (0.061%) VirtualBox
12 2 (0.041%) VMware Server
Systems Management
1 329 (6.66%) Kubernetes
2 81 (1.64%) Terraform
3 30 (0.61%) Ansible
4 29 (0.59%) SCCM
4 29 (0.59%) WSUS
5 20 (0.41%) Active Directory Federation Services
6 16 (0.32%) Microsoft Intune
6 16 (0.32%) SCOM
7 9 (0.18%) MIIS
8 7 (0.14%) Packer
9 6 (0.12%) Progress Chef
10 5 (0.10%) Grafana
11 4 (0.081%) Prometheus
12 2 (0.041%) linkerd
13 1 (0.020%) Kibana
13 1 (0.020%) Single Sign-On
Vendors
1 1,027 (20.80%) Microsoft
2 254 (5.14%) IBM
2 254 (5.14%) Red Hat
3 163 (3.30%) ESRI
4 108 (2.19%) Oracle
5 79 (1.60%) Xamarin
6 48 (0.97%) Google
7 42 (0.85%) Sitecore
8 35 (0.71%) Optimizely
9 33 (0.67%) VMware
10 31 (0.63%) Facebook
11 29 (0.59%) SAP
12 22 (0.45%) Apple
12 22 (0.45%) Databricks
13 20 (0.41%) ServiceNow
14 19 (0.38%) Autodesk
15 18 (0.36%) Adobe
16 17 (0.34%) Atlassian
16 17 (0.34%) YouTube
17 16 (0.32%) F5