QA Jobs in the UK excluding London

Quality Assurance (QA)
UK > UK excluding London

The table below provides summary statistics for permanent job vacancies advertised in the UK excluding London requiring QA skills. It includes a benchmarking guide to the annual salaries offered in vacancies that cited QA over the 6 months leading up to 1 May 2025, comparing them to the same period in the previous two years.

6 months to
1 May 2025
Same period 2024 Same period 2023
Rank 95 70 17
Rank change year-on-year -25 -53 +42
Permanent jobs citing QA 1,037 2,568 6,855
As % of all permanent jobs advertised in the UK excluding London 2.82% 3.65% 11.17%
As % of the Quality Assurance & Compliance category 16.61% 26.82% 53.43%
Number of salaries quoted 522 1,601 1,304
10th Percentile £32,500 £27,000 £31,250
25th Percentile £42,500 £36,250 £41,250
Median annual salary (50th Percentile) £52,761 £47,500 £52,500
Median % change year-on-year +11.08% -9.52% +5.00%
75th Percentile £65,000 £62,500 £67,500
90th Percentile £81,250 £75,000 £81,250
UK median annual salary £57,500 £52,500 £60,000
% change year-on-year +9.52% -12.50% +4.35%

All Quality Assurance and Compliance Skills
UK excluding London

QA falls under the Quality Assurance and Compliance category. For comparison with the information above, the following table provides summary statistics for all permanent job vacancies requiring quality assurance or compliance skills in the UK excluding London.

Permanent vacancies with a requirement for quality assurance or compliance skills 6,243 9,574 12,831
As % of all permanent jobs advertised in the UK excluding London 16.95% 13.62% 20.90%
Number of salaries quoted 3,050 6,349 4,736
10th Percentile £29,750 £25,750 £28,500
25th Percentile £40,000 £32,500 £37,500
Median annual salary (50th Percentile) £55,000 £47,500 £50,000
Median % change year-on-year +15.79% -5.00% +5.04%
75th Percentile £67,500 £62,500 £66,250
90th Percentile £80,000 £77,500 £79,750
UK median annual salary £60,000 £52,500 £57,500
% change year-on-year +14.29% -8.70% +4.55%

QA
Job Vacancy Trend in the UK excluding London

Job postings citing QA as a proportion of all IT jobs advertised in the UK excluding London.
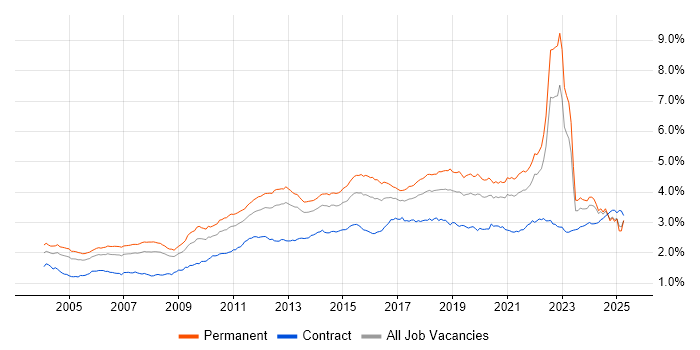
Job vacancy trend for QA in the UK excluding London

QA
Salary Trend in the UK excluding London

3-month moving average salary quoted in jobs citing QA in the UK excluding London.

Salary trend for QA in the UK excluding London

QA
Salary Histogram in the UK excluding London

Salary distribution for jobs citing QA in the UK excluding London over the 6 months to 1 May 2025.

Salary histogram for QA in the UK excluding London

QA
Job Locations in the UK excluding London

The table below looks at the demand and provides a guide to the median salaries quoted in IT jobs citing QA within the UK excluding London region over the 6 months to 1 May 2025. The 'Rank Change' column provides an indication of the change in demand within each location based on the same 6 month period last year.

Location Rank Change
on Same Period
Last Year
Matching
Permanent
IT Job Ads
Median Salary
Past 6 Months
Median Salary
% Change
on Same Period
Last Year
Live
Jobs
North of England -34 289 £52,500 +10.53% 302
South East -26 286 £50,000 +5.26% 363
Midlands -41 168 £53,688 +11.27% 167
North West -67 135 £52,500 +10.53% 194
East of England +15 115 £49,000 +8.89% 119
South West -30 95 £60,000 +26.32% 154
North East +49 94 £55,000 +4.76% 42
West Midlands -52 88 £53,688 +7.38% 93
East Midlands -11 80 £54,388 +14.50% 69
Yorkshire -14 60 £50,000 +5.26% 72
Scotland +3 49 £55,000 +22.22% 56
Wales -1 26 £52,562 +16.80% 33
Northern Ireland +4 18 £81,250 +20.37% 26
QA
UK

QA
Co-occurring Skills and Capabilities in the UK excluding London by Category

The follow tables expand on the table above by listing co-occurrences grouped by category. The same employment type, locality and period is covered with up to 20 co-occurrences shown in each of the following categories:

Application Platforms
1 21 (2.03%) Confluence
1 21 (2.03%) SharePoint
2 11 (1.06%) IBM Domino
3 10 (0.96%) WordPress
4 5 (0.48%) IIS
5 3 (0.29%) Apache
5 3 (0.29%) CMS
6 2 (0.19%) Apache Solr
6 2 (0.19%) ArcGIS
6 2 (0.19%) BizTalk Server
6 2 (0.19%) Oracle SOA Suite
7 1 (0.096%) Apache Spark
7 1 (0.096%) FactoryTalk
7 1 (0.096%) Microsoft Exchange
7 1 (0.096%) Moodle
7 1 (0.096%) Totara
7 1 (0.096%) WinCC
Applications
1 36 (3.47%) Microsoft Excel
2 27 (2.60%) Microsoft Office
3 14 (1.35%) Microsoft PowerPoint
4 13 (1.25%) Microsoft Project
5 12 (1.16%) Chatbot
6 5 (0.48%) MS Visio
7 4 (0.39%) Spreadsheet
8 3 (0.29%) Blender
8 3 (0.29%) Maya
8 3 (0.29%) Productboard
8 3 (0.29%) Trello
9 2 (0.19%) Adobe Creative Suite
9 2 (0.19%) Adobe Illustrator
10 1 (0.096%) 3ds Max
10 1 (0.096%) AutoCAD
10 1 (0.096%) Pro Tools
10 1 (0.096%) SOLIDWORKS
10 1 (0.096%) ZBrush
Business Applications
1 16 (1.54%) TrackWise
2 13 (1.25%) Dynamics CRM
3 4 (0.39%) ResourceLink
4 3 (0.29%) Fidessa
5 2 (0.19%) Magento
5 2 (0.19%) Oracle Applications
6 1 (0.096%) Oracle Assets
6 1 (0.096%) Payment Gateway
6 1 (0.096%) SAP Business One
6 1 (0.096%) SAP QM
6 1 (0.096%) SAP S/4HANA
6 1 (0.096%) Siebel CRM
6 1 (0.096%) Sprinklr
Cloud Services
1 165 (15.91%) Azure
2 118 (11.38%) AWS
3 66 (6.36%) SaaS
4 58 (5.59%) Power Platform
5 46 (4.44%) Azure DevOps
6 36 (3.47%) GCP
7 25 (2.41%) Microsoft 365
8 24 (2.31%) Dynamics 365
9 22 (2.12%) Power Automate
10 21 (2.03%) Snowflake
11 17 (1.64%) Cloud Computing
11 17 (1.64%) GitHub
11 17 (1.64%) PowerApps
12 16 (1.54%) Amazon S3
13 12 (1.16%) Amazon EC2
13 12 (1.16%) Serverless
14 10 (0.96%) Veeva
15 8 (0.77%) Amazon CloudWatch
16 7 (0.68%) AWS Lambda
16 7 (0.68%) Virtual Private Cloud
Communications & Networking
1 66 (6.36%) TCP/IP
2 65 (6.27%) VPN
3 17 (1.64%) VoIP
4 12 (1.16%) Firewall
5 10 (0.96%) VLAN
6 7 (0.68%) DNS
7 6 (0.58%) Bluetooth
7 6 (0.58%) IPv6
7 6 (0.58%) Reverse Proxy
8 5 (0.48%) SD-WAN
8 5 (0.48%) WAN
9 4 (0.39%) BGP
10 3 (0.29%) Broadband
11 2 (0.19%) ATM
11 2 (0.19%) Internet
11 2 (0.19%) OSPF
11 2 (0.19%) Radio Access Network
11 2 (0.19%) SAN
11 2 (0.19%) Wi-Fi
11 2 (0.19%) Wireless
Database & Business Intelligence
1 43 (4.15%) Power BI
2 36 (3.47%) Metadata
3 31 (2.99%) Data Warehouse
4 27 (2.60%) MySQL
4 27 (2.60%) SQL Server
5 23 (2.22%) NoSQL
6 21 (2.03%) Data Lake
6 21 (2.03%) PostgreSQL
7 14 (1.35%) Metadata Repository
8 12 (1.16%) MongoDB
9 10 (0.96%) Relational Database
10 9 (0.87%) Azure SQL Database
10 9 (0.87%) Elasticsearch
11 6 (0.58%) Redis
11 6 (0.58%) Tableau
12 5 (0.48%) DynamoDB
13 4 (0.39%) Ataccama
13 4 (0.39%) Oracle Reports
14 3 (0.29%) SQL Server Analysis Services
14 3 (0.29%) SQL Server Reporting Services
Development Applications
1 82 (7.91%) Cucumber
2 69 (6.65%) Selenium
3 65 (6.27%) JIRA
4 62 (5.98%) Robot Framework
5 50 (4.82%) Postman
6 43 (4.15%) Git
7 27 (2.60%) Jenkins
8 24 (2.31%) Cypress.io
9 23 (2.22%) GitLab
9 23 (2.22%) JMeter
10 20 (1.93%) Appium
11 15 (1.45%) SpecFlow
12 12 (1.16%) TestRail
13 10 (0.96%) JUnit
13 10 (0.96%) LoadRunner
13 10 (0.96%) Visual Studio
14 9 (0.87%) WebDriver
15 8 (0.77%) Maven
16 7 (0.68%) SoapUI
16 7 (0.68%) TestComplete
General
1 424 (40.89%) Social Skills
2 252 (24.30%) Analytical Skills
3 202 (19.48%) Finance
4 184 (17.74%) Inclusion and Diversity
5 151 (14.56%) Manufacturing
6 111 (10.70%) Marketing
7 72 (6.94%) Telecoms
8 56 (5.40%) Law
9 52 (5.01%) Pharmaceutical
10 46 (4.44%) Retail
11 45 (4.34%) Organisational Skills
12 34 (3.28%) Games
13 32 (3.09%) Banking
13 32 (3.09%) Legal
14 22 (2.12%) Public Sector
15 17 (1.64%) Presentation Skills
16 16 (1.54%) Electronics
16 16 (1.54%) Police
17 13 (1.25%) Documentation Skills
18 12 (1.16%) Local Government
Job Titles
1 218 (21.02%) Senior
2 121 (11.67%) Developer
3 117 (11.28%) Analyst
4 97 (9.35%) Development Manager
5 92 (8.87%) Lead
5 92 (8.87%) Product Manager
6 90 (8.68%) Test Engineer
7 82 (7.91%) Product Development Manager
8 69 (6.65%) Test Automation Engineer
9 52 (5.01%) Software Engineer
10 46 (4.44%) QA Engineer
11 39 (3.76%) Project Manager
12 35 (3.38%) Tester
13 34 (3.28%) Business Analyst
14 33 (3.18%) Test Analyst
15 31 (2.99%) QA Analyst
15 31 (2.99%) QA Manager
16 26 (2.51%) QA Officer
17 25 (2.41%) Quality Manager
18 23 (2.22%) Senior Software Engineer
Libraries, Frameworks & Software Standards
1 108 (10.41%) .NET
2 63 (6.08%) React
3 45 (4.34%) AngularJS
4 37 (3.57%) REST
5 27 (2.60%) HTML
6 23 (2.22%) Playwright
7 21 (2.03%) .NET Core
7 21 (2.03%) CSS
7 21 (2.03%) Node.js
8 19 (1.83%) RESTful
9 15 (1.45%) ASP.NET
9 15 (1.45%) JSON
10 14 (1.35%) Blazor
10 14 (1.35%) Web Services
11 12 (1.16%) Kafka
12 11 (1.06%) Vue
13 10 (0.96%) RabbitMQ
13 10 (0.96%) SOAP
14 9 (0.87%) .NET Framework
14 9 (0.87%) Entity Framework
Miscellaneous
1 84 (8.10%) FMCG
2 64 (6.17%) Product Ownership
3 62 (5.98%) Linux Command Line
4 35 (3.38%) Onboarding
5 34 (3.28%) Mobile App
6 25 (2.41%) Data Structures
7 24 (2.31%) Virtual Team
8 19 (1.83%) Life Science
9 18 (1.74%) Algorithms
10 14 (1.35%) Management Information System
11 13 (1.25%) Analytical Mindset
12 10 (0.96%) Data Centre
12 10 (0.96%) Robotics
13 9 (0.87%) Legacy Systems
14 8 (0.77%) Driving Licence
14 8 (0.77%) Embedded Systems
14 8 (0.77%) Renewable Energy
14 8 (0.77%) Self-Motivation
15 7 (0.68%) Enterprise Software
16 6 (0.58%) IoT
Operating Systems
1 98 (9.45%) Linux
2 92 (8.87%) Windows
3 28 (2.70%) Apple iOS
4 22 (2.12%) Android
5 7 (0.68%) Unix
6 6 (0.58%) Windows Server
7 3 (0.29%) Windows Server 2008
7 3 (0.29%) Windows Server 2012
7 3 (0.29%) Windows Server 2019
8 2 (0.19%) VMS
8 2 (0.19%) Windows Vista
9 1 (0.096%) Ubuntu
Processes & Methodologies
1 372 (35.87%) Problem-Solving
2 284 (27.39%) Agile
3 248 (23.92%) Mentoring
4 215 (20.73%) Test Automation
5 212 (20.44%) DevOps
6 210 (20.25%) Project Management
7 137 (13.21%) Software Engineering
8 121 (11.67%) Coaching
9 113 (10.90%) Software Testing
10 112 (10.80%) Continuous Improvement
11 98 (9.45%) Test Management
12 96 (9.26%) CI/CD
13 95 (9.16%) Product Strategy
14 91 (8.78%) User Experience
15 87 (8.39%) Commercialisation
16 82 (7.91%) Competitor Analysis
17 81 (7.81%) CAD
17 81 (7.81%) Stakeholder Management
18 80 (7.71%) System Testing
19 79 (7.62%) Design for Manufacturing
Programming Languages
1 183 (17.65%) JavaScript
2 143 (13.79%) Python
3 139 (13.40%) C#
3 139 (13.40%) SQL
4 81 (7.81%) Java
5 70 (6.75%) PowerShell
6 69 (6.65%) Bash
7 53 (5.11%) TypeScript
8 37 (3.57%) PHP
9 11 (1.06%) Kotlin
10 9 (0.87%) C
11 8 (0.77%) Go
11 8 (0.77%) VB.NET
12 7 (0.68%) C++
12 7 (0.68%) Groovy
12 7 (0.68%) Swift
13 6 (0.58%) Shell Script
14 5 (0.48%) Ruby
14 5 (0.48%) T-SQL
15 4 (0.39%) PL/SQL
Qualifications
1 417 (40.21%) Degree
2 40 (3.86%) ISTQB
3 38 (3.66%) Security Cleared
4 35 (3.38%) Computer Science Degree
5 19 (1.83%) BPSS Clearance
6 18 (1.74%) PMP
6 18 (1.74%) SC Cleared
7 16 (1.54%) Chartered Engineer
8 15 (1.45%) DBS Check
9 14 (1.35%) Master's Degree
9 14 (1.35%) PMI Certification
10 11 (1.06%) ISTQB Foundation Certification
11 9 (0.87%) Azure Certification
12 7 (0.68%) AWS Certification
12 7 (0.68%) ITIL Certification
13 6 (0.58%) DV Cleared
14 5 (0.48%) AWS Certified DevOps Engineer
15 4 (0.39%) CBAP
15 4 (0.39%) CCNP
15 4 (0.39%) PhD
Quality Assurance & Compliance
1 55 (5.30%) GMP
2 48 (4.63%) Data Quality
3 31 (2.99%) Accessibility
4 15 (1.45%) PMO
5 14 (1.35%) GDPR
6 8 (0.77%) California Consumer Privacy Act
6 8 (0.77%) GLP
7 6 (0.58%) ISO 14001
7 6 (0.58%) ISO 9001
7 6 (0.58%) ISO/IEC 27001
8 5 (0.48%) Good Clinical Practice
8 5 (0.48%) ISO/IEC 20000
8 5 (0.48%) ITGC
9 4 (0.39%) GxP
10 3 (0.29%) PCI DSS
11 2 (0.19%) CDISC
11 2 (0.19%) Dublin Core
11 2 (0.19%) IEC 62304
11 2 (0.19%) ISO 13485
11 2 (0.19%) Software Quality Assurance
System Software
1 28 (2.70%) Docker
2 10 (0.96%) Firmware
3 6 (0.58%) Embedded Firmware
4 3 (0.29%) LXC
5 1 (0.096%) Squid
Systems Management
1 25 (2.41%) Kubernetes
2 15 (1.45%) Terraform
3 11 (1.06%) Ansible
4 7 (0.68%) Grafana
5 5 (0.48%) Prometheus
5 5 (0.48%) Puppet
6 2 (0.19%) Argo
6 2 (0.19%) Iperf
6 2 (0.19%) Kustomize
6 2 (0.19%) Packer
6 2 (0.19%) Salt
7 1 (0.096%) Functional Safety
7 1 (0.096%) HP Quality Center
7 1 (0.096%) Kibana
Vendors
1 108 (10.41%) Microsoft
2 34 (3.28%) SAP
3 26 (2.51%) Oracle
4 22 (2.12%) Salesforce
5 17 (1.64%) Siemens
6 15 (1.45%) Google
7 12 (1.16%) ServiceNow
8 11 (1.06%) Cisco
9 9 (0.87%) Databricks
10 8 (0.77%) UiPath
10 8 (0.77%) VMware
11 7 (0.68%) ANSYS
12 6 (0.58%) Atlassian
12 6 (0.58%) SolarWinds
13 4 (0.39%) Avaya
13 4 (0.39%) Sage
13 4 (0.39%) Veracode
13 4 (0.39%) Zscaler
14 3 (0.29%) IBM
14 3 (0.29%) Informatica