Law Jobs in the UK excluding London

Law
UK > UK excluding London

The table below looks at the prevalence of the term Law in permanent job vacancies in the UK excluding London. Included is a benchmarking guide to the salaries offered in vacancies that cited Law over the 6 months leading up to 26 July 2024, comparing them to the same period in the previous two years.

6 months to
26 Jul 2024
Same period 2023 Same period 2022
Rank 36 130 98
Rank change year-on-year +94 -32 +5
Permanent jobs citing Law 3,411 1,268 2,729
As % of all permanent jobs advertised in the UK excluding London 5.23% 2.63% 3.48%
As % of the General category 9.68% 4.01% 5.39%
Number of salaries quoted 1,197 1,075 1,306
10th Percentile £26,750 £29,850 £26,375
25th Percentile £32,500 £36,250 £36,250
Median annual salary (50th Percentile) £45,000 £50,000 £47,500
Median % change year-on-year -10.00% +5.26% +2.15%
75th Percentile £62,500 £61,250 £61,250
90th Percentile £72,500 £73,750 £75,000
UK median annual salary £50,750 £52,500 £52,500
% change year-on-year -3.33% - +5.00%

All General Skills
UK excluding London

Law falls under the General Skills category. For comparison with the information above, the following table provides summary statistics for all permanent job vacancies requiring common skills in the UK excluding London.

Permanent vacancies with a requirement for common skills 35,229 31,627 50,647
As % of all permanent jobs advertised in the UK excluding London 53.97% 65.69% 64.67%
Number of salaries quoted 20,712 17,348 26,425
10th Percentile £26,250 £28,250 £28,750
25th Percentile £35,000 £37,500 £37,500
Median annual salary (50th Percentile) £47,557 £52,500 £50,000
Median % change year-on-year -9.42% +5.00% +5.26%
75th Percentile £62,500 £67,500 £65,720
90th Percentile £76,250 £81,250 £80,000
UK median annual salary £54,000 £60,000 £60,000
% change year-on-year -10.00% - +6.19%

Law
Job Vacancy Trend in the UK excluding London

Job postings citing Law as a proportion of all IT jobs advertised in the UK excluding London.
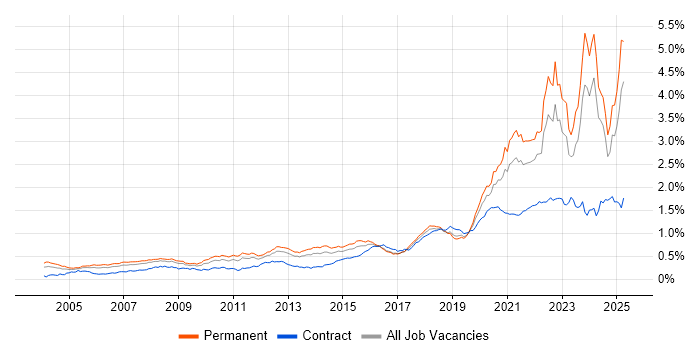
Job vacancy trend for Law in the UK excluding London

Law
Salary Trend in the UK excluding London

3-month moving average salary quoted in jobs citing Law in the UK excluding London.

Salary trend for Law in the UK excluding London

Law
Salary Histogram in the UK excluding London

Salary distribution for jobs citing Law in the UK excluding London over the 6 months to 26 July 2024.

Salary histogram for Law in the UK excluding London

Law
Job Locations in the UK excluding London

The table below looks at the demand and provides a guide to the median salaries quoted in IT jobs citing Law within the UK excluding London region over the 6 months to 26 July 2024. The 'Rank Change' column provides an indication of the change in demand within each location based on the same 6 month period last year.

Location Rank Change
on Same Period
Last Year
Matching
Permanent
IT Job Ads
Median Salary
Past 6 Months
Median Salary
% Change
on Same Period
Last Year
Live
Jobs
Scotland +165 1,741 £45,000 -16.67% 11
North of England +39 539 £50,000 - 90
Midlands -12 387 £40,000 -11.11% 45
South West +125 372 £45,000 -4.26% 36
North West +36 305 £47,500 -9.52% 49
South East +21 224 £50,000 -9.09% 105
West Midlands -23 214 £40,000 -15.79% 30
Yorkshire +39 194 £55,000 +15.79% 34
East Midlands +1 150 £40,000 -11.11% 15
East of England +31 118 £27,750 -47.14% 17
North East 0 39 £50,000 - 9
Wales +34 22 £40,000 +23.65% 15
Northern Ireland +7 9 £57,276 +14.55% 40
Channel Islands -2 3 £61,000 +35.56%
Isle of Man - 1 - -
Law
UK

Law
Co-occurring Skills and Capabilities in the UK excluding London by Category

The follow tables expand on the table above by listing co-occurrences grouped by category. The same employment type, locality and period is covered with up to 20 co-occurrences shown in each of the following categories:

Application Platforms
1 325 (9.53%) Apache Spark
2 98 (2.87%) FileNet
3 75 (2.20%) SharePoint
4 70 (2.05%) Apache Airflow
5 63 (1.85%) Confluence
6 59 (1.73%) Microsoft Exchange
7 57 (1.67%) Apache
8 32 (0.94%) Cloud Foundry
9 21 (0.62%) GemFire
10 20 (0.59%) Skype for Business
11 15 (0.44%) SAS
12 13 (0.38%) IIS
13 11 (0.32%) CICS
14 9 (0.26%) CMS
14 9 (0.26%) Exchange Server 2013
15 7 (0.21%) BizTalk Server
15 7 (0.21%) Tomcat
16 6 (0.18%) SharePoint Server
17 5 (0.15%) WebSphere
17 5 (0.15%) WordPress
Applications
1 139 (4.08%) Microsoft Office
2 107 (3.14%) Microsoft Excel
3 93 (2.73%) Microsoft PowerPoint
4 28 (0.82%) MS Visio
5 15 (0.44%) Sketch
6 9 (0.26%) Chatbot
7 7 (0.21%) UserZoom
8 6 (0.18%) Microsoft Project
9 4 (0.12%) Adobe Illustrator
10 3 (0.088%) AutoCAD
10 3 (0.088%) InVision
10 3 (0.088%) SketchUp
10 3 (0.088%) SOLIDWORKS
11 2 (0.059%) Gliffy
12 1 (0.029%) Adobe Creative Suite
12 1 (0.029%) Adobe Premiere
12 1 (0.029%) Camtasia
12 1 (0.029%) Photoshop
Business Applications
1 43 (1.26%) Dynamics CRM
2 19 (0.56%) Dynamics AX
3 17 (0.50%) Oracle Payables
3 17 (0.50%) Oracle Receivables
4 14 (0.41%) Oracle Assets
4 14 (0.41%) Oracle General Ledger
5 12 (0.35%) Oracle Cash Management
6 10 (0.29%) Visualfiles
7 8 (0.23%) SAP S/4HANA
8 7 (0.21%) SAP ERP
8 7 (0.21%) SAP HCM
8 7 (0.21%) SAP HR
9 6 (0.18%) Endur
10 5 (0.15%) Oracle ERP
10 5 (0.15%) Workday HCM
11 4 (0.12%) Oracle EBS
11 4 (0.12%) SAP Payroll
12 3 (0.088%) Primavera
13 2 (0.059%) Dynamics NAV
13 2 (0.059%) Oracle Financials
Cloud Services
1 778 (22.81%) AWS
2 367 (10.76%) Azure
3 202 (5.92%) Microsoft 365
4 162 (4.75%) Power Platform
5 137 (4.02%) Dynamics 365
6 117 (3.43%) Datadog
7 104 (3.05%) Amazon S3
8 74 (2.17%) PowerApps
9 71 (2.08%) Power Automate
10 69 (2.02%) Figma
11 68 (1.99%) Entra ID
12 64 (1.88%) GCP
13 55 (1.61%) Amazon CloudWatch
14 51 (1.50%) GitHub
15 50 (1.47%) Amazon ECS
16 49 (1.44%) OneDrive
16 49 (1.44%) SurveyMonkey
17 43 (1.26%) SaaS
18 41 (1.20%) Serverless
19 37 (1.08%) Amazon EKS
Communications & Networking
1 71 (2.08%) Firewall
2 61 (1.79%) Kerberos
3 54 (1.58%) LAN
4 39 (1.14%) SAN
5 33 (0.97%) WAN
6 26 (0.76%) Network Security
7 24 (0.70%) Skype
8 22 (0.64%) Wi-Fi
9 17 (0.50%) NAS
10 15 (0.44%) Internet
10 15 (0.44%) Intrusion Detection
11 14 (0.41%) DNS
11 14 (0.41%) VPN
12 13 (0.38%) TCP/IP
13 12 (0.35%) DHCP
14 11 (0.32%) VLAN
15 7 (0.21%) VoIP
16 6 (0.18%) DSL
16 6 (0.18%) Intranet
17 5 (0.15%) DKIM
Database & Business Intelligence
1 447 (13.10%) NoSQL
2 277 (8.12%) Big Data
3 135 (3.96%) Apache Cassandra
4 124 (3.64%) Elasticsearch
5 121 (3.55%) Hadoop
6 89 (2.61%) SQL Server
7 79 (2.32%) Relational Database
8 78 (2.29%) Power BI
9 74 (2.17%) Apache Hive
10 68 (1.99%) Data Lake
11 60 (1.76%) HBase
12 48 (1.41%) MongoDB
13 46 (1.35%) Tableau
14 44 (1.29%) Metadata
15 43 (1.26%) MySQL
16 42 (1.23%) Qlik Sense
17 39 (1.14%) QlikView
18 38 (1.11%) CockroachDB
19 29 (0.85%) Data Warehouse
19 29 (0.85%) Electronic Patient Records
Development Applications
1 200 (5.86%) Jenkins
2 192 (5.63%) JUnit
3 133 (3.90%) Git
4 112 (3.28%) Jasmine
5 91 (2.67%) JIRA
6 88 (2.58%) Cypress.io
7 84 (2.46%) Selenium
8 64 (1.88%) WebDriver
9 60 (1.76%) Bitbucket
9 60 (1.76%) Bitbucket Server
9 60 (1.76%) Karma Test Runner
9 60 (1.76%) Protractor
10 45 (1.32%) Mockito
11 44 (1.29%) Artifactory
12 43 (1.26%) Maven
13 37 (1.08%) Cucumber
14 29 (0.85%) Visual Studio
15 28 (0.82%) JMeter
16 27 (0.79%) GitLab
17 25 (0.73%) Android Studio
General
1 2,139 (62.71%) Finance
2 1,984 (58.16%) Inclusion and Diversity
3 964 (28.26%) Marketing
4 706 (20.70%) Social Skills
5 698 (20.46%) Legal
6 543 (15.92%) Banking
7 505 (14.81%) Investment Banking
8 358 (10.50%) Analytical Skills
9 148 (4.34%) Financial Institution
10 117 (3.43%) Influencing Skills
11 74 (2.17%) Presentation Skills
12 45 (1.32%) Organisational Skills
13 42 (1.23%) Front Office
14 41 (1.20%) Manufacturing
15 40 (1.17%) Telecoms
16 37 (1.08%) Games
17 30 (0.88%) Social Science
18 27 (0.79%) Retail
19 24 (0.70%) Documentation Skills
19 24 (0.70%) Prime Brokerage
Job Titles
1 1,319 (38.67%) Software Engineer
2 630 (18.47%) Lead
3 531 (15.57%) Java Engineer
4 529 (15.51%) Java Software Engineer
5 429 (12.58%) Lead Software Engineer
6 358 (10.50%) Senior
7 324 (9.50%) Developer
8 313 (9.18%) Analyst
9 242 (7.09%) Big Data Engineer
9 242 (7.09%) Big Data Software Engineer
10 219 (6.42%) Python Engineer
11 215 (6.30%) Python Software Engineer
12 208 (6.10%) Full Stack Engineer
13 205 (6.01%) Full Stack Software Engineer
14 200 (5.86%) AWS Engineer
15 196 (5.75%) Lead Java Engineer
16 192 (5.63%) AWS Software Engineer
17 178 (5.22%) Data Engineer
18 136 (3.99%) Engineering Manager
18 136 (3.99%) Software Engineering Manager
Libraries, Frameworks & Software Standards
1 470 (13.78%) Spring
2 399 (11.70%) React
3 281 (8.24%) Kafka
4 273 (8.00%) HTML
5 261 (7.65%) AngularJS
6 246 (7.21%) CSS
7 216 (6.33%) J2EE
8 199 (5.83%) Spring Boot
9 196 (5.75%) Node.js
10 195 (5.72%) JSON
11 191 (5.60%) Hibernate
12 167 (4.90%) Twitter Bootstrap
13 162 (4.75%) JMS
14 154 (4.51%) .NET
15 136 (3.99%) jQuery
16 123 (3.61%) Web Services
17 119 (3.49%) RESTful
18 115 (3.37%) GraphQL
18 115 (3.37%) PySpark
19 100 (2.93%) Spring Integration
Miscellaneous
1 641 (18.79%) Cloud Native
2 572 (16.77%) Algorithms
3 163 (4.78%) Management Information System
4 150 (4.40%) Onboarding
5 138 (4.05%) Public Cloud
6 111 (3.25%) Product Ownership
7 108 (3.17%) Market Risk
8 101 (2.96%) Data Structures
9 91 (2.67%) Reference Data
10 82 (2.40%) Self-Motivation
11 69 (2.02%) Credit Risk
12 68 (1.99%) Foreign Exchange (FX)
13 48 (1.41%) Enterprise Cloud
14 47 (1.38%) Distributed Applications
15 46 (1.35%) Housing Association
16 43 (1.26%) Mobile App
17 36 (1.06%) Replication
18 32 (0.94%) Distributed Systems
19 30 (0.88%) Legacy Code
19 30 (0.88%) Legacy Systems
Operating Systems
1 225 (6.60%) Windows
2 99 (2.90%) Unix
3 93 (2.73%) Linux
4 91 (2.67%) Windows Server
5 58 (1.70%) Windows 10
6 54 (1.58%) Android
7 29 (0.85%) Apple iOS
8 12 (0.35%) VMS
9 8 (0.23%) Windows Server 2012
10 7 (0.21%) Windows Server 2016
11 6 (0.18%) CentOS
11 6 (0.18%) Windows Server 2019
12 5 (0.15%) Mac OS
13 4 (0.12%) Windows 7
14 3 (0.088%) Windows 8
14 3 (0.088%) Windows Server 2008
15 1 (0.029%) Red Hat Enterprise Linux
Processes & Methodologies
1 1,741 (51.04%) Agile
2 1,628 (47.73%) Software Engineering
3 1,391 (40.78%) SDLC
4 1,308 (38.35%) CI/CD
5 1,246 (36.53%) Operational Stability
6 1,013 (29.70%) Artificial Intelligence
7 993 (29.11%) Machine Learning
8 890 (26.09%) Community of Practice
9 692 (20.29%) Continuous Improvement
10 656 (19.23%) Visualisation
11 575 (16.86%) Problem-Solving
12 560 (16.42%) Risk Management
13 423 (12.40%) Decision-Making
14 318 (9.32%) Continuous Delivery
15 311 (9.12%) Computer Science
16 308 (9.03%) Microservices
17 302 (8.85%) Information Architecture
18 265 (7.77%) Full Stack Development
19 261 (7.65%) Architectural Design
20 243 (7.12%) Mentoring
Programming Languages
1 1,074 (31.49%) Java
2 897 (26.30%) SQL
3 605 (17.74%) Python
4 337 (9.88%) JavaScript
5 189 (5.54%) TypeScript
6 188 (5.51%) Scala
7 164 (4.81%) C#
8 89 (2.61%) PL/SQL
9 48 (1.41%) Go
10 46 (1.35%) R
11 44 (1.29%) Prolog
11 44 (1.29%) SPARQL
12 41 (1.20%) PowerShell
13 39 (1.14%) T-SQL
14 37 (1.08%) Groovy
15 27 (0.79%) Kotlin
15 27 (0.79%) PHP
16 20 (0.59%) C++
17 18 (0.53%) Shell Script
18 16 (0.47%) C
Qualifications
1 437 (12.81%) Degree
2 106 (3.11%) Master's Degree
3 60 (1.76%) Computer Science Degree
4 58 (1.70%) Security Cleared
5 46 (1.35%) PhD
6 31 (0.91%) Microsoft Certification
7 29 (0.85%) HNC
8 28 (0.82%) HND
9 21 (0.62%) CISSP
10 18 (0.53%) MBA
11 16 (0.47%) CISM
12 14 (0.41%) SC Cleared
13 11 (0.32%) Azure Certification
14 9 (0.26%) CIPD
14 9 (0.26%) CISA
14 9 (0.26%) CRISC
15 7 (0.21%) AWS Certification
15 7 (0.21%) ITIL Foundation Certificate
16 6 (0.18%) AWS Certified Cloud Practitioner
16 6 (0.18%) SANS
Quality Assurance & Compliance
1 77 (2.26%) SLA
2 53 (1.55%) GDPR
3 52 (1.52%) QA
4 45 (1.32%) Accessibility
5 34 (1.00%) Data Quality
5 34 (1.00%) ISO/IEC 27001
6 25 (0.73%) NIST
7 17 (0.50%) Cyber Essentials
8 13 (0.38%) ISO 9001
9 12 (0.35%) PCI DSS
10 10 (0.29%) PMO
11 9 (0.26%) Cyber Essentials PLUS
12 7 (0.21%) Actionable Recommendations
12 7 (0.21%) GRC
12 7 (0.21%) IFRS
13 6 (0.18%) ITGC
13 6 (0.18%) Sarbanes-Oxley
14 5 (0.15%) GMP
14 5 (0.15%) ISO 14001
14 5 (0.15%) NCSC
System Software
1 196 (5.75%) Active Directory
2 60 (1.76%) HDFS
3 46 (1.35%) Docker
4 33 (0.97%) VMware Infrastructure
5 18 (0.53%) Hyper-V
6 17 (0.50%) VMware ESXi
7 11 (0.32%) Time Sharing Option
8 5 (0.15%) Terminal Services
8 5 (0.15%) VMware Workstation
8 5 (0.15%) XenApp
9 3 (0.088%) Citrix Hypervisor
10 2 (0.059%) Apache ZooKeeper
10 2 (0.059%) Microsoft App-V
10 2 (0.059%) Virtual Machines
10 2 (0.059%) VMware NSX
10 2 (0.059%) vSphere
11 1 (0.029%) Snort
11 1 (0.029%) Virtual Desktop
11 1 (0.029%) XenDesktop
Systems Management
1 268 (7.86%) Kubernetes
2 190 (5.57%) Terraform
3 150 (4.40%) Grafana
4 88 (2.58%) Prometheus
5 26 (0.76%) ITRS Geneos
6 21 (0.62%) HAProxy
6 21 (0.62%) Kibana
6 21 (0.62%) Zipkin
7 17 (0.50%) vCenter Server
8 15 (0.44%) Microsoft Intune
9 13 (0.38%) Graphite
10 10 (0.29%) Microsoft Clustering
11 9 (0.26%) Nessus
12 7 (0.21%) Ansible
12 7 (0.21%) SCCM
13 4 (0.12%) Progress Chef
14 2 (0.059%) SysTrack
15 1 (0.029%) Argo
15 1 (0.029%) FTK
15 1 (0.029%) Single Sign-On
Vendors
1 475 (13.93%) Microsoft
2 327 (9.59%) Oracle
3 163 (4.78%) Splunk
4 162 (4.75%) Databricks
5 137 (4.02%) Dynatrace
6 71 (2.08%) Alteryx
7 63 (1.85%) Informatica
8 62 (1.82%) Google
9 58 (1.70%) VMware
10 49 (1.44%) SAP
11 41 (1.20%) Citrix
12 37 (1.08%) Qualtrics
13 36 (1.06%) Cisco
14 30 (0.88%) Cloudera
15 19 (0.56%) ServiceNow
15 19 (0.56%) Veeam
16 18 (0.53%) iManage
17 15 (0.44%) UiPath
18 13 (0.38%) Remedy
19 10 (0.29%) SaltStack