Data Quality Jobs in the UK excluding London

Data Quality
UK > UK excluding London

The following table provides summary statistics for permanent job vacancies advertised in the UK excluding London with a requirement for Data Quality skills. Included is a benchmarking guide to the salaries offered in vacancies that have cited Data Quality over the 6 months to 27 April 2024 with a comparison to the same period in the previous 2 years.

6 months to
27 Apr 2024
Same period 2023 Same period 2022
Rank 235 296 320
Rank change year-on-year +61 +24 -32
Permanent jobs citing Data Quality 864 681 776
As % of all permanent jobs advertised in the UK excluding London 1.23% 1.10% 1.10%
As % of the Quality Assurance & Compliance category 9.05% 5.24% 6.47%
Number of salaries quoted 475 387 464
10th Percentile £32,050 £35,500 £32,325
25th Percentile £38,250 £44,269 £41,063
Median annual salary (50th Percentile) £55,000 £55,000 £51,500
Median % change year-on-year - +6.80% +10.75%
75th Percentile £75,625 £68,750 £63,750
90th Percentile £90,000 £85,000 £77,500
UK median annual salary £65,000 £62,500 £60,000
% change year-on-year +4.00% +4.17% +9.09%

All Quality Assurance and Compliance Skills
UK excluding London

Data Quality is in the Quality Assurance and Compliance category. The following table is for comparison with the above and provides summary statistics for all permanent job vacancies advertised in the UK excluding London with a requirement for quality assurance or compliance skills.

Permanent vacancies with a requirement for quality assurance or compliance skills 9,548 12,989 11,996
As % of all permanent jobs advertised in the UK excluding London 13.63% 21.02% 16.99%
Number of salaries quoted 6,334 4,763 6,935
10th Percentile £25,750 £28,500 £26,750
25th Percentile £32,500 £37,500 £35,750
Median annual salary (50th Percentile) £47,500 £50,000 £47,500
Median % change year-on-year -5.00% +5.26% -
75th Percentile £62,500 £66,250 £62,500
90th Percentile £77,500 £80,000 £75,000
UK median annual salary £52,500 £57,500 £55,000
% change year-on-year -8.70% +4.55% +4.76%

Data Quality
Job Vacancy Trend in the UK excluding London

Job postings citing Data Quality as a proportion of all IT jobs advertised in the UK excluding London.
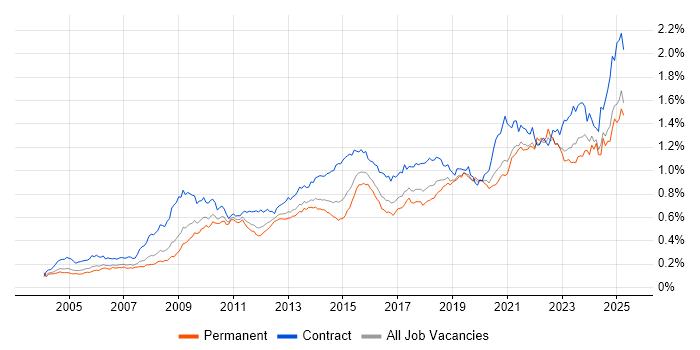
Job vacancy trend for Data Quality in the UK excluding London

Data Quality
Salary Trend in the UK excluding London

3-month moving average salary quoted in jobs citing Data Quality in the UK excluding London.

Salary trend for Data Quality in the UK excluding London

Data Quality
Salary Histogram in the UK excluding London

Salary distribution for jobs citing Data Quality in the UK excluding London over the 6 months to 27 April 2024.

Salary histogram for Data Quality in the UK excluding London

Data Quality
Job Locations in the UK excluding London

The table below looks at the demand and provides a guide to the median salaries quoted in IT jobs citing Data Quality within the UK excluding London region over the 6 months to 27 April 2024. The 'Rank Change' column provides an indication of the change in demand within each location based on the same 6 month period last year.

Location Rank Change
on Same Period
Last Year
Matching
Permanent
IT Job Ads
Median Salary
Past 6 Months
Median Salary
% Change
on Same Period
Last Year
Live
Jobs
North of England +137 292 £65,000 +23.81% 57
South East +76 224 £62,500 +4.17% 42
North West +97 162 £75,000 +42.86% 41
Midlands -29 132 £42,125 -15.75% 27
West Midlands -37 95 £55,000 +10.00% 15
South West -7 81 £57,500 -4.37% 15
Yorkshire +95 79 £50,000 -6.54% 13
Scotland -29 68 £51,500 -6.36% 11
East of England +31 53 £43,000 -31.20% 14
North East +29 51 £68,250 +30.00% 5
East Midlands +11 37 £35,000 -17.65% 11
Wales +14 15 £45,000 -25.00% 5
Data Quality
UK

Data Quality
Co-occurring Skills and Capabilities in the UK excluding London by Category

The follow tables expand on the table above by listing co-occurrences grouped by category. The same employment type, locality and period is covered with up to 20 co-occurrences shown in each of the following categories:

Application Platforms
1 70 (8.10%) SharePoint
2 42 (4.86%) Apache Spark
3 16 (1.85%) Apache Airflow
4 10 (1.16%) Confluence
5 7 (0.81%) SAS
6 5 (0.58%) Oracle Application Server
7 4 (0.46%) Apache
7 4 (0.46%) Oracle Workflow
8 3 (0.35%) Jupyter
9 2 (0.23%) ArcGIS
10 1 (0.12%) IBM Domino
Applications
1 132 (15.28%) Microsoft Excel
2 30 (3.47%) Microsoft Office
3 21 (2.43%) Microsoft PowerPoint
4 9 (1.04%) MS Visio
5 8 (0.93%) Spreadsheet
6 1 (0.12%) SPSS
Business Applications
1 7 (0.81%) SAP GTS
2 6 (0.69%) Dynamics CRM
2 6 (0.69%) SAP S/4HANA
3 4 (0.46%) NEC Housing
4 2 (0.23%) Remedy ITSM
5 1 (0.12%) HFM
5 1 (0.12%) Oracle Applications
5 1 (0.12%) Salesforce CRM
5 1 (0.12%) SAP EWM
5 1 (0.12%) SAP MDG
5 1 (0.12%) SAP MM
5 1 (0.12%) SAP Payroll
5 1 (0.12%) SAP SD
5 1 (0.12%) SAP WM
Cloud Services
1 289 (33.45%) Azure
2 191 (22.11%) Power Platform
3 189 (21.88%) AWS
4 134 (15.51%) GCP
5 62 (7.18%) Snowflake
6 56 (6.48%) Azure DevOps
7 37 (4.28%) Azure Data Factory
8 32 (3.70%) Matillion
9 30 (3.47%) Azure Cosmos DB
10 25 (2.89%) SaaS
11 21 (2.43%) Collibra
12 18 (2.08%) Azure Synapse Analytics
12 18 (2.08%) dbt
12 18 (2.08%) Dynamics 365
13 17 (1.97%) Nutanix
14 15 (1.74%) Amazon Kinesis
14 15 (1.74%) IaaS
15 14 (1.62%) Amazon S3
16 13 (1.50%) PowerApps
17 11 (1.27%) Microsoft 365
Communications & Networking
1 15 (1.74%) DNS
2 12 (1.39%) WPA
3 3 (0.35%) Internet
4 2 (0.23%) Intranet
5 1 (0.12%) 3GPP
5 1 (0.12%) 5G
5 1 (0.12%) Skype
5 1 (0.12%) WebEx
Database & Business Intelligence
1 242 (28.01%) Data Warehouse
2 187 (21.64%) Power BI
3 130 (15.05%) SQL Server
4 112 (12.96%) BigQuery
5 108 (12.50%) Looker
6 88 (10.19%) Data Lake
7 71 (8.22%) Metadata
8 60 (6.94%) Tableau
9 44 (5.09%) Data Vault
10 38 (4.40%) Star Schema
11 33 (3.82%) Delta Lake
12 32 (3.70%) SQL Server Integration Services
13 30 (3.47%) Elasticsearch
14 21 (2.43%) Relational Database
15 20 (2.31%) Big Data
16 17 (1.97%) Amazon Redshift
17 16 (1.85%) PostgreSQL
18 15 (1.74%) SQL Server Analysis Services
18 15 (1.74%) SQL Server Reporting Services
19 13 (1.50%) Data Mining
Development Applications
1 107 (12.38%) JIRA
2 31 (3.59%) GitLab
3 15 (1.74%) Git
4 10 (1.16%) Jenkins
5 6 (0.69%) RStudio
6 5 (0.58%) Spinnaker
6 5 (0.58%) SQL Server Management Studio (SSMS)
7 4 (0.46%) Toad
8 3 (0.35%) ERwin
9 2 (0.23%) Zephyr
10 1 (0.12%) CA Release Automation
10 1 (0.12%) Cucumber
10 1 (0.12%) IBM UrbanCode
10 1 (0.12%) Mocha
10 1 (0.12%) Oracle Forms
10 1 (0.12%) Selenium
10 1 (0.12%) SonarQube
10 1 (0.12%) Subversion
10 1 (0.12%) Team Foundation Server
10 1 (0.12%) Visual Studio Team System
General
1 285 (32.99%) Social Skills
2 271 (31.37%) Analytical Skills
3 269 (31.13%) Finance
4 111 (12.85%) Inclusion and Diversity
5 94 (10.88%) Banking
6 87 (10.07%) Legal
7 67 (7.75%) Marketing
8 63 (7.29%) Law
9 43 (4.98%) Retail
10 30 (3.47%) Public Sector
11 21 (2.43%) Influencing Skills
12 17 (1.97%) Games
13 15 (1.74%) Presentation Skills
14 14 (1.62%) Local Government
14 14 (1.62%) Organisational Skills
15 11 (1.27%) Back Office
15 11 (1.27%) Investment Banking
15 11 (1.27%) Pharmaceutical
16 10 (1.16%) Manufacturing
17 8 (0.93%) Telecoms
Job Titles
1 214 (24.77%) Data Engineer
2 152 (17.59%) Architect
3 143 (16.55%) Data Architect
4 121 (14.00%) Analyst
5 110 (12.73%) Senior
6 109 (12.62%) Lead
7 82 (9.49%) Data Analyst
8 75 (8.68%) Data Manager
9 40 (4.63%) Lead Data Engineer
10 34 (3.94%) Lead Software Engineer
10 34 (3.94%) Senior Software Engineer
10 34 (3.94%) Software Engineer
11 32 (3.70%) Developer
12 27 (3.13%) Security Engineer
13 25 (2.89%) Senior Data Engineer
14 22 (2.55%) Cybersecurity Engineer
15 20 (2.31%) AWS Engineer
15 20 (2.31%) Informatica Engineer
16 19 (2.20%) AWS Data Engineer
17 17 (1.97%) Administrator
Libraries, Frameworks & Software Standards
1 58 (6.71%) PySpark
2 7 (0.81%) EDI
3 6 (0.69%) .NET
3 6 (0.69%) XML
4 5 (0.58%) HTML
4 5 (0.58%) JSON
4 5 (0.58%) Kafka
5 3 (0.35%) AngularJS
5 3 (0.35%) Great Expectations
5 3 (0.35%) REST
5 3 (0.35%) SOAP
6 2 (0.23%) Handlebars
6 2 (0.23%) Matplotlib
6 2 (0.23%) Pandas
6 2 (0.23%) PostGIS
6 2 (0.23%) Seaborn
7 1 (0.12%) Node.js
7 1 (0.12%) NumPy
7 1 (0.12%) Visualforce
7 1 (0.12%) Web Services
Miscellaneous
1 148 (17.13%) Self-Motivation
2 80 (9.26%) Data Structures
3 74 (8.56%) Management Information System
4 37 (4.28%) Reinsurance
5 33 (3.82%) Public Cloud
6 19 (2.20%) IoT
7 18 (2.08%) Algorithms
7 18 (2.08%) Analytical Mindset
8 15 (1.74%) Cloud Native
8 15 (1.74%) Product Ownership
9 13 (1.50%) Client/Server
9 13 (1.50%) Online Games
10 11 (1.27%) Reference Data
11 10 (1.16%) Blog
12 9 (1.04%) Data Protection Act
12 9 (1.04%) Taxonomies
13 8 (0.93%) Legacy Systems
14 7 (0.81%) Enterprise Software
14 7 (0.81%) FMCG
14 7 (0.81%) Housing Association
Operating Systems
1 20 (2.31%) Windows
2 7 (0.81%) Linux
3 6 (0.69%) Unix
4 2 (0.23%) Windows Server
Processes & Methodologies
1 365 (42.25%) Data Modelling
2 357 (41.32%) Problem-Solving
3 343 (39.70%) Data Governance
4 334 (38.66%) ETL
5 289 (33.45%) Data Engineering
6 273 (31.60%) Analytics
7 241 (27.89%) Data Management
8 219 (25.35%) Business Intelligence
9 210 (24.31%) Agile
10 207 (23.96%) Mentoring
11 192 (22.22%) Data Architecture
12 190 (21.99%) Data Integration
13 152 (17.59%) Decision-Making
14 139 (16.09%) Data Analysis
15 132 (15.28%) Coaching
16 130 (15.05%) Data Science
17 121 (14.00%) Data Security
18 117 (13.54%) Machine Learning
19 116 (13.43%) Platform Engineering
20 102 (11.81%) Data Pipeline
Programming Languages
1 264 (30.56%) SQL
2 199 (23.03%) Python
3 62 (7.18%) Java
4 29 (3.36%) T-SQL
5 25 (2.89%) R
6 19 (2.20%) Bash
6 19 (2.20%) Scala
7 15 (1.74%) Perl
8 10 (1.16%) C#
9 9 (1.04%) VBA
10 5 (0.58%) PHP
11 4 (0.46%) JavaScript
11 4 (0.46%) Kotlin
11 4 (0.46%) PowerShell
12 3 (0.35%) Data Analysis Expressions
12 3 (0.35%) VB
12 3 (0.35%) X++
13 2 (0.23%) VB.NET
14 1 (0.12%) C++
14 1 (0.12%) VBScript
Qualifications
1 155 (17.94%) Degree
2 34 (3.94%) Computer Science Degree
3 27 (3.13%) Master's Degree
4 18 (2.08%) MBA
5 16 (1.85%) Numerate Degree
6 12 (1.39%) Security Cleared
7 11 (1.27%) SC Cleared
8 9 (1.04%) PhD
9 7 (0.81%) DBS Check
10 5 (0.58%) Microsoft Certification
11 4 (0.46%) MCP
11 4 (0.46%) PMI Certification
12 3 (0.35%) Azure Certification
13 2 (0.23%) DV Cleared
13 2 (0.23%) ECDL
13 2 (0.23%) HND
14 1 (0.12%) AWS Certification
14 1 (0.12%) CISM
14 1 (0.12%) ITIL Certification
14 1 (0.12%) Postgraduate
Quality Assurance & Compliance
1 195 (22.57%) GDPR
2 36 (4.17%) QA
3 29 (3.36%) Accessibility
4 12 (1.39%) California Consumer Privacy Act
5 2 (0.23%) GRC
5 2 (0.23%) HIPAA
5 2 (0.23%) PMO
6 1 (0.12%) Actionable Recommendations
6 1 (0.12%) Government Security Classifications
6 1 (0.12%) NCSC
System Software
1 17 (1.97%) VMware Infrastructure
2 16 (1.85%) Active Directory
3 15 (1.74%) Virtual Machines
4 2 (0.23%) HDFS
5 1 (0.12%) Docker
Systems Management
1 9 (1.04%) Terraform
2 3 (0.35%) Oracle Enterprise Manager
3 1 (0.12%) Kibana
3 1 (0.12%) Kubernetes
3 1 (0.12%) Nagios
3 1 (0.12%) Prometheus
3 1 (0.12%) Puppet
Vendors
1 131 (15.16%) Google
2 114 (13.19%) Microsoft
3 88 (10.19%) Databricks
4 67 (7.75%) Informatica
5 64 (7.41%) Oracle
6 29 (3.36%) SAP
7 20 (2.31%) Alteryx
8 19 (2.20%) VMware
9 13 (1.50%) Salesforce
10 11 (1.27%) Talend
11 9 (1.04%) Computacenter
12 6 (0.69%) Jitterbit
13 4 (0.46%) Civica
13 4 (0.46%) Cloudera
13 4 (0.46%) Facebook
13 4 (0.46%) NEC
13 4 (0.46%) ServiceNow
14 3 (0.35%) Adobe
14 3 (0.35%) IBM
14 3 (0.35%) TIBCO