Performance Tuning Jobs in the UK excluding London

Performance Tuning
UK > UK excluding London

The table below provides summary statistics for permanent job vacancies advertised in the UK excluding London requiring Performance Tuning skills. It includes a benchmarking guide to the annual salaries offered in vacancies that cited Performance Tuning over the 6 months leading up to 7 June 2025, comparing them to the same period in the previous two years.

6 months to
7 Jun 2025
Same period 2024 Same period 2023
Rank 415 286 430
Rank change year-on-year -129 +144 -43
Permanent jobs citing Performance Tuning 180 700 339
As % of all permanent jobs advertised in the UK excluding London 0.45% 0.90% 0.60%
As % of the Processes & Methodologies category 0.48% 1.11% 0.63%
Number of salaries quoted 125 283 228
10th Percentile £35,500 £41,250 £35,000
25th Percentile £47,500 £47,500 £40,000
Median annual salary (50th Percentile) £60,000 £57,500 £52,250
Median % change year-on-year +4.35% +10.05% -0.48%
75th Percentile £70,000 £63,750 £65,000
90th Percentile £84,500 £86,250 £73,250
UK median annual salary £62,500 £57,500 £60,000
% change year-on-year +8.70% -4.17% -4.00%

All Process and Methodology Skills
UK excluding London

Performance Tuning falls under the Processes and Methodologies category. For comparison with the information above, the following table provides summary statistics for all permanent job vacancies requiring process or methodology skills in the UK excluding London.

Permanent vacancies with a requirement for process or methodology skills 37,165 63,321 53,531
As % of all permanent jobs advertised in the UK excluding London 92.17% 81.50% 95.49%
Number of salaries quoted 17,900 43,040 28,510
10th Percentile £26,250 £27,500 £30,500
25th Percentile £36,250 £36,250 £40,000
Median annual salary (50th Percentile) £51,128 £50,000 £55,000
Median % change year-on-year +2.26% -9.09% +4.76%
75th Percentile £65,000 £65,000 £70,000
90th Percentile £77,500 £77,500 £82,500
UK median annual salary £56,000 £55,000 £60,800
% change year-on-year +1.82% -9.54% +1.33%

Performance Tuning
Job Vacancy Trend in the UK excluding London

Job postings citing Performance Tuning as a proportion of all IT jobs advertised in the UK excluding London.
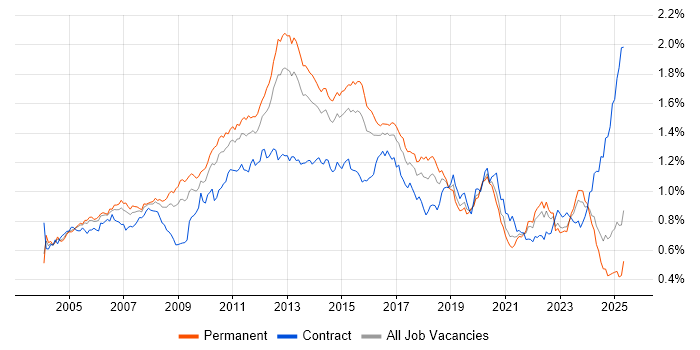
Job vacancy trend for Performance Tuning in the UK excluding London

Performance Tuning
Salary Trend in the UK excluding London

3-month moving average salary quoted in jobs citing Performance Tuning in the UK excluding London.

Salary trend for Performance Tuning in the UK excluding London

Performance Tuning
Salary Histogram in the UK excluding London

Salary distribution for jobs citing Performance Tuning in the UK excluding London over the 6 months to 7 June 2025.

Salary histogram for Performance Tuning in the UK excluding London

Performance Tuning
Job Locations in the UK excluding London

The table below looks at the demand and provides a guide to the median salaries quoted in IT jobs citing Performance Tuning within the UK excluding London region over the 6 months to 7 June 2025. The 'Rank Change' column provides an indication of the change in demand within each location based on the same 6 month period last year.

Location Rank Change
on Same Period
Last Year
Matching
Permanent
IT Job Ads
Median Salary
Past 6 Months
Median Salary
% Change
on Same Period
Last Year
Live
Jobs
South East +37 44 £65,000 +13.04% 173
Midlands +30 40 £52,500 -8.70% 31
North of England -22 39 £62,500 +8.70% 91
West Midlands +63 38 £52,500 -12.50% 22
Scotland -52 30 £50,000 -13.04% 28
North West -46 21 £65,000 +18.18% 55
South West +89 17 £55,000 -4.35% 34
Yorkshire +40 15 £60,000 +15.93% 28
East of England +30 6 £57,500 - 31
North East +20 3 £60,000 +4.35% 9
Northern Ireland +36 2 £69,000 - 5
East Midlands +11 2 £48,750 -15.22% 9
Wales -12 1 £60,000 +28.75% 9
Isle of Man - 1 £34,500 -
Performance Tuning
UK

Performance Tuning
Co-occurring Skills and Capabilities in the UK excluding London by Category

The follow tables expand on the table above by listing co-occurrences grouped by category. The same employment type, locality and period is covered with up to 20 co-occurrences shown in each of the following categories:

Application Platforms
1 13 (7.22%) Apache Spark
2 9 (5.00%) Microsoft Exchange
3 7 (3.89%) Apache
4 4 (2.22%) Confluence
4 4 (2.22%) IIS
5 3 (1.67%) GemFire
5 3 (1.67%) nginx
6 1 (0.56%) BizTalk Server
6 1 (0.56%) Cloud Foundry
6 1 (0.56%) SharePoint
Applications
1 16 (8.89%) Microsoft Excel
2 10 (5.56%) Microsoft Office
3 3 (1.67%) Mozilla Thunderbird
4 2 (1.11%) Chatbot
Business Applications
1 6 (3.33%) Oracle EBS
2 4 (2.22%) Oracle Applications
3 2 (1.11%) Dynamics CRM
3 2 (1.11%) SAP S/4HANA
Cloud Services
1 94 (52.22%) Azure
2 58 (32.22%) AWS
3 38 (21.11%) Power Platform
4 26 (14.44%) GCP
5 19 (10.56%) SaaS
6 14 (7.78%) Azure Monitor
7 12 (6.67%) GitHub
8 11 (6.11%) Amazon S3
8 11 (6.11%) Azure Data Factory
8 11 (6.11%) Azure DevOps
8 11 (6.11%) Google Workspace
9 8 (4.44%) Serverless
10 7 (3.89%) Datadog
11 6 (3.33%) Amazon EC2
11 6 (3.33%) Amazon ECS
11 6 (3.33%) AWS Lambda
11 6 (3.33%) Snowflake
12 5 (2.78%) Cloud Computing
12 5 (2.78%) Microsoft 365
13 4 (2.22%) Virtual Private Cloud
Communications & Networking
1 19 (10.56%) DNS
2 16 (8.89%) Firewall
3 15 (8.33%) DHCP
4 14 (7.78%) TCP/IP
5 11 (6.11%) BGP
5 11 (6.11%) OSPF
6 10 (5.56%) VLAN
6 10 (5.56%) WLAN
7 6 (3.33%) SAN
8 4 (2.22%) NAS
9 3 (1.67%) FTP
9 3 (1.67%) HTTP
9 3 (1.67%) IMAP
9 3 (1.67%) OpenLDAP
9 3 (1.67%) SMTP
9 3 (1.67%) SSH
9 3 (1.67%) WAN
10 2 (1.11%) LAN
10 2 (1.11%) VPN
11 1 (0.56%) MPLS
Database & Business Intelligence
1 66 (36.67%) SQL Server
2 38 (21.11%) Power BI
3 22 (12.22%) Data Warehouse
3 22 (12.22%) SQL Server Reporting Services
4 19 (10.56%) SQL Server Integration Services
5 16 (8.89%) PostgreSQL
6 14 (7.78%) Azure SQL Database
7 10 (5.56%) Big Data
8 9 (5.00%) Data Hub
8 9 (5.00%) Data Lake
8 9 (5.00%) NoSQL
8 9 (5.00%) Oracle Database
8 9 (5.00%) SQL CLR
8 9 (5.00%) SQL Server Analysis Services
9 7 (3.89%) MongoDB
10 6 (3.33%) Amazon RDS
10 6 (3.33%) MySQL
10 6 (3.33%) Oracle Exadata
11 5 (2.78%) RDBMS
11 5 (2.78%) Relational Database
Development Applications
1 26 (14.44%) Git
2 13 (7.22%) JIRA
3 11 (6.11%) Jenkins
4 10 (5.56%) Visual Studio
5 7 (3.89%) Maven
6 4 (2.22%) Subversion
7 3 (1.67%) Vagrant
8 2 (1.11%) Cypress.io
8 2 (1.11%) Fiddler
8 2 (1.11%) IDA Disassembler
8 2 (1.11%) Selenium
9 1 (0.56%) Artifactory
9 1 (0.56%) Gradle
9 1 (0.56%) Octopus Deploy
9 1 (0.56%) SQL Server Management Studio (SSMS)
9 1 (0.56%) TeamCity
General
1 65 (36.11%) Finance
2 61 (33.89%) Social Skills
3 42 (23.33%) Law
4 27 (15.00%) Analytical Skills
5 22 (12.22%) Banking
5 22 (12.22%) Retail
6 20 (11.11%) Inclusion and Diversity
7 16 (8.89%) Legal
8 10 (5.56%) Automotive
9 9 (5.00%) Back Office
10 6 (3.33%) Public Sector
10 6 (3.33%) Retail Banking
11 5 (2.78%) Advertising
11 5 (2.78%) Investment Banking
12 3 (1.67%) Front Office
12 3 (1.67%) Presentation Skills
13 2 (1.11%) Documentation Skills
13 2 (1.11%) Financial Institution
13 2 (1.11%) Marketing
14 1 (0.56%) Military
Job Titles
1 37 (20.56%) Developer
1 37 (20.56%) Senior
2 25 (13.89%) DBA
2 25 (13.89%) Software Engineer
3 24 (13.33%) Lead
4 15 (8.33%) Java Engineer
4 15 (8.33%) SQL DBA
4 15 (8.33%) SQL Developer
5 13 (7.22%) Senior Manager
6 12 (6.67%) Java Software Engineer
7 10 (5.56%) Analyst
7 10 (5.56%) IT Engineer
7 10 (5.56%) Senior Developer
7 10 (5.56%) Systems Engineer
8 9 (5.00%) Administrator
8 9 (5.00%) SQL Server DBA
9 8 (4.44%) Front-End Engineer (Client-Side Engineer)
10 7 (3.89%) Lead Developer
10 7 (3.89%) Senior SQL Developer
10 7 (3.89%) Software Developer
Libraries, Frameworks & Software Standards
1 23 (12.78%) .NET
2 19 (10.56%) AngularJS
3 17 (9.44%) Kafka
4 16 (8.89%) React
5 14 (7.78%) .NET Framework
6 13 (7.22%) Hugging Face
6 13 (7.22%) LangChain
6 13 (7.22%) PyTorch
6 13 (7.22%) Spring
6 13 (7.22%) TensorFlow
7 12 (6.67%) RESTful
8 10 (5.56%) .NET Core
8 10 (5.56%) Entity Framework
8 10 (5.56%) Middleware
9 9 (5.00%) HTML
10 6 (3.33%) ASP.NET MVC
10 6 (3.33%) Oracle Fusion
10 6 (3.33%) Oracle GoldenGate
10 6 (3.33%) Pandas
10 6 (3.33%) REST
Miscellaneous
1 16 (8.89%) Algorithms
1 16 (8.89%) Cloud Native
2 15 (8.33%) Management Information System
3 13 (7.22%) Data Structures
4 10 (5.56%) Private Cloud
4 10 (5.56%) Smartphone
5 9 (5.00%) Replication
6 6 (3.33%) Equities
6 6 (3.33%) Public Cloud
7 5 (2.78%) Data Centre
7 5 (2.78%) Hybrid Cloud
8 4 (2.22%) Enterprise Storage
8 4 (2.22%) Team-Oriented Environment
9 3 (1.67%) Credit Derivative
9 3 (1.67%) Derivative
9 3 (1.67%) Fixed Income
9 3 (1.67%) Foreign Exchange (FX)
9 3 (1.67%) Hedge funds
9 3 (1.67%) Linux Command Line
9 3 (1.67%) Mainframe
Operating Systems
1 43 (23.89%) Linux
2 31 (17.22%) Windows
3 21 (11.67%) Windows Server
4 14 (7.78%) Ubuntu
5 12 (6.67%) Windows Server 2019
6 11 (6.11%) Windows Server 2016
7 10 (5.56%) Mac OS X
7 10 (5.56%) Windows 10
8 9 (5.00%) Unix
9 7 (3.89%) Red Hat Enterprise Linux
10 3 (1.67%) Amazon Linux
10 3 (1.67%) VMS
11 1 (0.56%) Windows Server 2012
Processes & Methodologies
1 55 (30.56%) Problem-Solving
2 47 (26.11%) Agile
3 41 (22.78%) Software Engineering
4 40 (22.22%) Computer Science
5 39 (21.67%) High Availability
6 38 (21.11%) Business Intelligence
7 33 (18.33%) CI/CD
8 32 (17.78%) Mentoring
9 28 (15.56%) Continuous Improvement
10 27 (15.00%) Machine Learning
11 25 (13.89%) Artificial Intelligence
12 24 (13.33%) Data Privacy
12 24 (13.33%) DevOps
13 23 (12.78%) Data Modelling
13 23 (12.78%) Migration
14 22 (12.22%) Root Cause Analysis
15 20 (11.11%) Coaching
15 20 (11.11%) Disaster Recovery
15 20 (11.11%) Incident Management
15 20 (11.11%) Observability
Programming Languages
1 109 (60.56%) SQL
2 34 (18.89%) Python
3 31 (17.22%) C#
4 29 (16.11%) PowerShell
5 24 (13.33%) Java
6 22 (12.22%) T-SQL
7 15 (8.33%) JavaScript
8 14 (7.78%) Bash
9 12 (6.67%) PL/SQL
10 7 (3.89%) Data Analysis Expressions
11 5 (2.78%) Shell Script
12 4 (2.22%) Perl
13 3 (1.67%) C++
13 3 (1.67%) Groovy
13 3 (1.67%) Scala
14 2 (1.11%) C
15 1 (0.56%) Go
15 1 (0.56%) SAPscript
15 1 (0.56%) TypeScript
15 1 (0.56%) VC++
Qualifications
1 52 (28.89%) Degree
2 34 (18.89%) Computer Science Degree
3 13 (7.22%) Master's Degree
3 13 (7.22%) Microsoft Certification
3 13 (7.22%) Security Cleared
4 12 (6.67%) Azure Certification
5 11 (6.11%) MCSE
6 10 (5.56%) AWS Certification
6 10 (5.56%) HNC
6 10 (5.56%) HND
7 9 (5.00%) SC Cleared
8 6 (3.33%) AWS Certified Solutions Architect
8 6 (3.33%) Numerate Degree
9 5 (2.78%) OCA
9 5 (2.78%) OCP
9 5 (2.78%) Oracle Certification
10 4 (2.22%) VMware Certified Professional (VCP)
11 3 (1.67%) Cisco Certification
12 2 (1.11%) CCNP
12 2 (1.11%) DV Cleared
Quality Assurance & Compliance
1 11 (6.11%) GDPR
2 9 (5.00%) Accessibility
2 9 (5.00%) ISO 9001
3 6 (3.33%) Data Quality
4 5 (2.78%) ISO/IEC 27001
5 2 (1.11%) HIPAA
5 2 (1.11%) SOC 2
6 1 (0.56%) Cyber Essentials
6 1 (0.56%) NCSC
6 1 (0.56%) NIST
6 1 (0.56%) QA
6 1 (0.56%) SLA
System Software
1 16 (8.89%) Active Directory
1 16 (8.89%) VMware Infrastructure
2 15 (8.33%) Docker
3 5 (2.78%) Virtual Machines
4 4 (2.22%) vSphere
5 3 (1.67%) DFS Replication
5 3 (1.67%) Dovecot
5 3 (1.67%) Postfix
5 3 (1.67%) Squid
5 3 (1.67%) VMware ESXi
6 2 (1.11%) Hyper-V
7 1 (0.56%) Firmware
7 1 (0.56%) Virtual Servers
Systems Management
1 25 (13.89%) Grafana
1 25 (13.89%) Prometheus
2 15 (8.33%) Kubernetes
3 14 (7.78%) Terraform
4 10 (5.56%) Ansible
5 7 (3.89%) Oracle RMAN
6 5 (2.78%) Failover Clustering
7 4 (2.22%) Nessus
7 4 (2.22%) vCenter Server
8 3 (1.67%) Progress Chef
8 3 (1.67%) Proxmox
8 3 (1.67%) Puppet
9 2 (1.11%) Microsoft Intune
9 2 (1.11%) SCOM
10 1 (0.56%) Nagios
10 1 (0.56%) NetApp OnCommand
10 1 (0.56%) OpenVAS
10 1 (0.56%) QRadar
10 1 (0.56%) Single Sign-On
10 1 (0.56%) VxRail
Vendors
1 53 (29.44%) Microsoft
2 25 (13.89%) Oracle
3 21 (11.67%) VMware
4 19 (10.56%) Google
5 13 (7.22%) Cisco
5 13 (7.22%) OpenAI
6 11 (6.11%) Dell
6 11 (6.11%) Fortinet
7 10 (5.56%) Apple
7 10 (5.56%) Ubiquiti
8 9 (5.00%) Databricks
9 6 (3.33%) Red Hat
10 5 (2.78%) ServiceNow
10 5 (2.78%) Telerik
11 4 (2.22%) NetApp
11 4 (2.22%) SAP
11 4 (2.22%) Splunk
12 3 (1.67%) Nimble Storage
12 3 (1.67%) Solace
12 3 (1.67%) SolarWinds