Product Ownership Jobs in the UK excluding London

Product Ownership
UK > UK excluding London

The table below looks at the prevalence of the term Product Ownership in permanent job vacancies in the UK excluding London. Included is a benchmarking guide to the salaries offered in vacancies that cited Product Ownership over the 6 months leading up to 30 May 2025, comparing them to the same period in the previous two years.

6 months to
30 May 2025
Same period 2024 Same period 2023
Rank 130 158 91
Rank change year-on-year +28 -67 -36
Permanent jobs citing Product Ownership 958 1,337 2,073
As % of all permanent jobs advertised in the UK excluding London 2.43% 1.79% 3.57%
As % of the Miscellaneous category 7.13% 5.47% 8.45%
Number of salaries quoted 425 819 1,152
10th Percentile £47,231 £40,000 £42,500
25th Percentile £56,176 £46,581 £48,688
Median annual salary (50th Percentile) £65,000 £57,965 £60,249
Median % change year-on-year +12.14% -3.79% +9.54%
75th Percentile £78,750 £70,000 £77,500
90th Percentile £98,474 £80,000 £91,110
UK median annual salary £70,000 £62,000 £65,000
% change year-on-year +12.90% -4.62% +4.00%

All Generic Skills
UK excluding London

Product Ownership falls under the General and Transferable Skills category. For comparison with the information above, the following table provides summary statistics for all permanent job vacancies requiring generic IT skills in the UK excluding London.

Permanent vacancies with a requirement for generic IT skills 13,443 24,459 24,546
As % of all permanent jobs advertised in the UK excluding London 34.14% 32.80% 42.31%
Number of salaries quoted 5,886 15,283 10,904
10th Percentile £28,500 £26,250 £31,250
25th Percentile £36,925 £35,000 £41,125
Median annual salary (50th Percentile) £55,000 £50,000 £55,000
Median % change year-on-year +10.00% -9.09% +4.76%
75th Percentile £68,000 £65,000 £70,000
90th Percentile £80,000 £78,750 £85,000
UK median annual salary £60,000 £55,000 £65,000
% change year-on-year +9.09% -15.38% +4.00%

Product Ownership
Job Vacancy Trend in the UK excluding London

Job postings citing Product Ownership as a proportion of all IT jobs advertised in the UK excluding London.
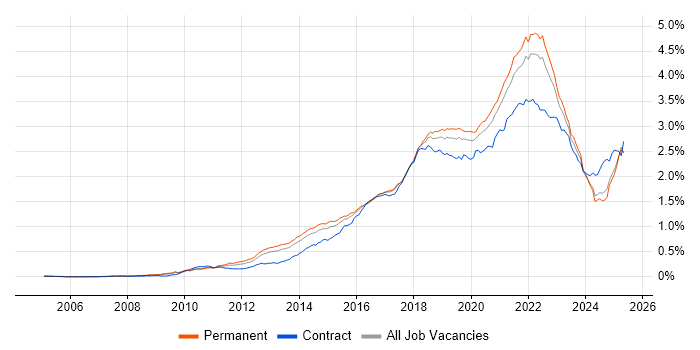
Job vacancy trend for Product Ownership in the UK excluding London

Product Ownership
Salary Trend in the UK excluding London

3-month moving average salary quoted in jobs citing Product Ownership in the UK excluding London.

Salary trend for Product Ownership in the UK excluding London

Product Ownership
Salary Histogram in the UK excluding London

Salary distribution for jobs citing Product Ownership in the UK excluding London over the 6 months to 30 May 2025.

Salary histogram for Product Ownership in the UK excluding London

Product Ownership
Job Locations in the UK excluding London

The table below looks at the demand and provides a guide to the median salaries quoted in IT jobs citing Product Ownership within the UK excluding London region over the 6 months to 30 May 2025. The 'Rank Change' column provides an indication of the change in demand within each location based on the same 6 month period last year.

Location Rank Change
on Same Period
Last Year
Matching
Permanent
IT Job Ads
Median Salary
Past 6 Months
Median Salary
% Change
on Same Period
Last Year
Live
Jobs
North of England +48 390 £65,000 +12.14% 832
North West +42 294 £57,560 -0.70% 398
South East +11 194 £65,000 +1.56% 1,011
Midlands +15 132 £62,500 +9.65% 696
Scotland +41 118 £70,750 +28.64% 156
Yorkshire +41 87 £77,500 +30.20% 338
West Midlands -17 76 £60,000 +4.35% 378
East of England +43 59 £62,500 +26.26% 495
East Midlands +48 56 £65,000 +30.00% 269
South West -2 55 £65,000 +13.04% 403
North East +24 9 £50,000 -13.74% 97
Wales +24 7 £59,857 +14.01% 93
Northern Ireland +43 4 - - 43
Product Ownership
UK

Product Ownership
Co-occurring Skills and Capabilities in the UK excluding London by Category

The follow tables expand on the table above by listing co-occurrences grouped by category. The same employment type, locality and period is covered with up to 20 co-occurrences shown in each of the following categories:

Application Platforms
1 202 (21.09%) Confluence
2 20 (2.09%) SharePoint
3 18 (1.88%) CMS
4 7 (0.73%) Kentico
5 6 (0.63%) Microsoft Exchange
6 5 (0.52%) Apache Spark
7 4 (0.42%) Apache
7 4 (0.42%) SAS
8 2 (0.21%) CICS
8 2 (0.21%) Sitecore CMS
9 1 (0.10%) ThingWorx
9 1 (0.10%) Umbraco
9 1 (0.10%) WebSphere
Applications
1 39 (4.07%) Microsoft Office
2 13 (1.36%) Microsoft Excel
3 10 (1.04%) Microsoft PowerPoint
4 5 (0.52%) MS Visio
5 3 (0.31%) Trello
6 2 (0.21%) Chatbot
6 2 (0.21%) Photoshop
7 1 (0.10%) Microsoft Project
Business Applications
1 65 (6.78%) Sparx Enterprise Architect
1 65 (6.78%) Teamcenter
2 8 (0.84%) Salesforce CRM
3 5 (0.52%) Dynamics CRM
4 2 (0.21%) Siebel CRM
5 1 (0.10%) Payment Gateway
5 1 (0.10%) Sage 200
Cloud Services
1 365 (38.10%) Azure
2 313 (32.67%) AWS
3 198 (20.67%) GCP
4 62 (6.47%) SaaS
5 34 (3.55%) Miro
6 25 (2.61%) Azure DevOps
7 22 (2.30%) Asana
7 22 (2.30%) Power Platform
8 16 (1.67%) Azure Data Factory
9 14 (1.46%) Cloud Computing
9 14 (1.46%) Microsoft 365
9 14 (1.46%) Serverless
10 13 (1.36%) Entra ID
11 12 (1.25%) GitHub
12 11 (1.15%) Google Analytics
13 10 (1.04%) Azure Synapse Analytics
13 10 (1.04%) Dynamics 365
13 10 (1.04%) PowerApps
14 9 (0.94%) Azure Logic Apps
14 9 (0.94%) Figma
Communications & Networking
1 43 (4.49%) Broadband
2 10 (1.04%) TCP/IP
3 8 (0.84%) Internet
3 8 (0.84%) Modbus
4 6 (0.63%) HTTP
5 3 (0.31%) Intranet
5 3 (0.31%) Network Security
5 3 (0.31%) SSL
6 2 (0.21%) Firewall
7 1 (0.10%) BGP
7 1 (0.10%) VPN
Database & Business Intelligence
1 263 (27.45%) SQL Server
2 31 (3.24%) NoSQL
3 27 (2.82%) Data Lake
4 18 (1.88%) Power BI
5 16 (1.67%) Azure SQL Database
6 15 (1.57%) Data Warehouse
6 15 (1.57%) PostgreSQL
7 13 (1.36%) Big Data
8 12 (1.25%) Relational Database
9 11 (1.15%) MongoDB
10 8 (0.84%) MySQL
11 7 (0.73%) BigQuery
12 6 (0.63%) Microsoft Analysis Services
12 6 (0.63%) RDBMS
13 4 (0.42%) Apache Hive
13 4 (0.42%) Hadoop
13 4 (0.42%) Power Query
13 4 (0.42%) PowerPivot
14 2 (0.21%) Amazon Aurora
14 2 (0.21%) CockroachDB
Development Applications
1 343 (35.80%) JIRA
2 257 (26.83%) Cucumber
3 254 (26.51%) Maven
4 252 (26.30%) Selenium
5 251 (26.20%) Sonatype Nexus
6 250 (26.10%) GitLab
7 247 (25.78%) SonarQube
8 246 (25.68%) Bitbucket
9 65 (6.78%) Rational DOORS
10 26 (2.71%) Git
11 16 (1.67%) Jenkins
12 8 (0.84%) Cypress.io
13 7 (0.73%) Oracle Forms
14 6 (0.63%) webpack
15 4 (0.42%) Balsamiq
15 4 (0.42%) JUnit
15 4 (0.42%) Postman
16 3 (0.31%) Visual Studio
16 3 (0.31%) Xcode
16 3 (0.31%) XCTest
General
1 487 (50.84%) Finance
2 359 (37.47%) Banking
3 262 (27.35%) Inclusion and Diversity
4 242 (25.26%) Social Skills
5 111 (11.59%) Retail
6 92 (9.60%) Investment Banking
7 90 (9.39%) Corporate Banking
8 67 (6.99%) Law
9 55 (5.74%) Marketing
10 52 (5.43%) Analytical Skills
11 50 (5.22%) Influencing Skills
12 25 (2.61%) Games
13 21 (2.19%) Advertising
14 19 (1.98%) Presentation Skills
15 18 (1.88%) Financial Institution
16 17 (1.77%) Automotive
16 17 (1.77%) Organisational Skills
17 11 (1.15%) Legal
18 10 (1.04%) Documentation Skills
19 8 (0.84%) Publishing
Job Titles
1 295 (30.79%) Software Engineer
2 122 (12.73%) Lead
3 85 (8.87%) Senior
4 82 (8.56%) Product Owner
5 69 (7.20%) Developer
6 66 (6.89%) Analyst
7 65 (6.78%) Platform Engineer
7 65 (6.78%) Systems Engineer
8 54 (5.64%) Product Manager
9 47 (4.91%) Architect
10 33 (3.44%) Solutions Architect
11 31 (3.24%) Engineering Manager
12 28 (2.92%) Software Developer
13 25 (2.61%) Senior Manager
14 24 (2.51%) Lead Software Engineer
15 23 (2.40%) Product Analyst
16 22 (2.30%) ServiceNow Manager
17 21 (2.19%) Senior Service Manager
18 20 (2.09%) Account Manager
18 20 (2.09%) Business Analyst
Libraries, Frameworks & Software Standards
1 303 (31.63%) React
2 273 (28.50%) Kafka
3 265 (27.66%) CSS
4 264 (27.56%) HTML
4 264 (27.56%) Spring Boot
5 260 (27.14%) Spring
6 246 (25.68%) JPA
6 246 (25.68%) Redux
7 160 (16.70%) Hibernate
8 118 (12.32%) REST
9 109 (11.38%) RESTful
10 96 (10.02%) Jest
11 90 (9.39%) CSS3
11 90 (9.39%) HTML5
11 90 (9.39%) Sass
12 36 (3.76%) .NET
13 32 (3.34%) AngularJS
14 24 (2.51%) Node.js
15 10 (1.04%) JSON
16 9 (0.94%) Web Services
Miscellaneous
1 248 (25.89%) Enterprise Software
2 43 (4.49%) Video\Live Streaming
3 40 (4.18%) Management Information System
4 31 (3.24%) Distributed Systems
5 29 (3.03%) Cloud Native
6 26 (2.71%) Marketing Technology
7 23 (2.40%) Mobile App
8 21 (2.19%) Over-the-Top Content
8 21 (2.19%) Self-Motivation
9 20 (2.09%) Digital Media
9 20 (2.09%) PMI
10 19 (1.98%) FMCG
11 16 (1.67%) Public Cloud
12 11 (1.15%) Private Cloud
13 9 (0.94%) Virtual Team
14 8 (0.84%) Device Driver
14 8 (0.84%) Online Banking
15 7 (0.73%) Data Centre
15 7 (0.73%) Security Posture
16 6 (0.63%) e-Learning
Operating Systems
1 26 (2.71%) Linux
2 22 (2.30%) Android
3 14 (1.46%) Apple iOS
4 13 (1.36%) Windows
5 9 (0.94%) Embedded Linux
6 7 (0.73%) Red Hat Enterprise Linux
7 4 (0.42%) Windows Server
8 1 (0.10%) Unix
8 1 (0.10%) VMS
8 1 (0.10%) Windows 10
Processes & Methodologies
1 716 (74.74%) Agile
2 388 (40.50%) DevOps
3 368 (38.41%) Software Engineering
4 341 (35.59%) CI/CD
5 323 (33.72%) Microservices
6 299 (31.21%) SDLC
7 296 (30.90%) Test Automation
8 292 (30.48%) Continuous Improvement
9 287 (29.96%) Containerisation
10 277 (28.91%) Full-Stack Development
11 268 (27.97%) Roadmaps
12 251 (26.20%) Performance Optimisation
13 250 (26.10%) Front End Development
14 204 (21.29%) TDD
15 192 (20.04%) Mentoring
16 160 (16.70%) Clean Code
17 157 (16.39%) User Experience
18 140 (14.61%) Scrum
19 129 (13.47%) Strategic Thinking
20 126 (13.15%) Stakeholder Management
Programming Languages
1 321 (33.51%) SQL
2 317 (33.09%) JavaScript
3 303 (31.63%) Java
4 126 (13.15%) TypeScript
5 50 (5.22%) C#
6 39 (4.07%) Python
7 13 (1.36%) Kotlin
8 10 (1.04%) C++
9 9 (0.94%) C
9 9 (0.94%) PowerShell
10 6 (0.63%) Data Analysis Expressions
10 6 (0.63%) PL/SQL
11 5 (0.52%) Go
11 5 (0.52%) PHP
12 4 (0.42%) Perl
12 4 (0.42%) R
12 4 (0.42%) Swift
12 4 (0.42%) VB
13 2 (0.21%) Dart
13 2 (0.21%) Ruby
Qualifications
1 159 (16.60%) Degree
2 85 (8.87%) BPSS Clearance
3 65 (6.78%) TOGAF Certification
4 38 (3.97%) Computer Science Degree
5 26 (2.71%) PMI Certification
6 16 (1.67%) Security Cleared
7 11 (1.15%) Azure Certification
8 9 (0.94%) PMP
9 8 (0.84%) SC Cleared
10 6 (0.63%) CSPO
11 5 (0.52%) ISTQB
12 4 (0.42%) CCA
12 4 (0.42%) CISSP
12 4 (0.42%) Microsoft Certification
13 3 (0.31%) A+ Certification
13 3 (0.31%) AWS Certification
13 3 (0.31%) Master's Degree
13 3 (0.31%) Six Sigma Black Belt
13 3 (0.31%) Six Sigma Green Belt
13 3 (0.31%) Six Sigma Master Black Belt
Quality Assurance & Compliance
1 280 (29.23%) QA
2 95 (9.92%) Accessibility
3 10 (1.04%) Data Quality
4 6 (0.63%) ISO 20022
5 5 (0.52%) Automotive SPICE
5 5 (0.52%) ISO 26262
6 4 (0.42%) Basel II
6 4 (0.42%) Basel III
6 4 (0.42%) Dodd-Frank
6 4 (0.42%) GDPR
6 4 (0.42%) IFRS
6 4 (0.42%) IFRS 9
6 4 (0.42%) PCI DSS
7 3 (0.31%) NIST
7 3 (0.31%) PMBOK
7 3 (0.31%) PMO
8 2 (0.21%) IEC 62304
8 2 (0.21%) ISO 13485
8 2 (0.21%) SLA
9 1 (0.10%) ISO/IEC 27001
System Software
1 293 (30.58%) Docker
2 8 (0.84%) Embedded Firmware
2 8 (0.84%) Firmware
2 8 (0.84%) Virtual Machines
3 5 (0.52%) Active Directory
4 2 (0.21%) Virtual Desktop
4 2 (0.21%) VMware Infrastructure
5 1 (0.10%) RACF
Systems Management
1 291 (30.38%) Kubernetes
2 33 (3.44%) Terraform
3 5 (0.52%) Functional Safety
4 4 (0.42%) Grafana
5 2 (0.21%) Graylog
5 2 (0.21%) Prometheus
6 1 (0.10%) Ansible
6 1 (0.10%) FortiGate
6 1 (0.10%) HP ALM
6 1 (0.10%) Istio
6 1 (0.10%) Microsoft Intune
6 1 (0.10%) Puppet
6 1 (0.10%) SCCM
Vendors
1 246 (25.68%) Solace
2 108 (11.27%) Microsoft
3 65 (6.78%) Sparx
4 50 (5.22%) Salesforce
5 32 (3.34%) Google
6 31 (3.24%) ServiceNow
7 26 (2.71%) SAP
8 15 (1.57%) Oracle
9 14 (1.46%) Databricks
10 8 (0.84%) Bloomberg
11 7 (0.73%) Cisco
11 7 (0.73%) IBM
12 6 (0.63%) Apple
12 6 (0.63%) Atlassian
13 5 (0.52%) Splunk
13 5 (0.52%) Sybase
14 3 (0.31%) Adobe
14 3 (0.31%) Ping Identity
14 3 (0.31%) Sage
15 2 (0.21%) VMware