Enterprise Software Jobs in the UK excluding London

Enterprise Application Software
UK > UK excluding London

The table below looks at the prevalence of the term Enterprise Software in permanent job vacancies in the UK excluding London. Included is a benchmarking guide to the salaries offered in vacancies that cited Enterprise Software over the 6 months leading up to 26 July 2024, comparing them to the same period in the previous two years.

6 months to
26 Jul 2024
Same period 2023 Same period 2022
Rank 342 342 335
Rank change year-on-year 0 -7 -29
Permanent jobs citing Enterprise Software 420 412 801
As % of all permanent jobs advertised in the UK excluding London 0.64% 0.86% 1.02%
As % of the Miscellaneous category 2.08% 2.14% 2.35%
Number of salaries quoted 264 327 441
10th Percentile £36,250 £40,250 £32,750
25th Percentile £43,750 £47,250 £43,750
Median annual salary (50th Percentile) £55,000 £57,500 £57,500
Median % change year-on-year -4.35% - +9.52%
75th Percentile £71,000 £70,625 £76,250
90th Percentile £88,375 £88,750 £90,000
UK median annual salary £60,000 £65,000 £65,000
% change year-on-year -7.69% - -

All Generic Skills
UK excluding London

Enterprise Software falls under the General and Transferable Skills category. For comparison with the information above, the following table provides summary statistics for all permanent job vacancies requiring generic IT skills in the UK excluding London.

Permanent vacancies with a requirement for generic IT skills 20,220 19,230 34,139
As % of all permanent jobs advertised in the UK excluding London 30.98% 39.94% 43.59%
Number of salaries quoted 11,541 10,409 17,070
10th Percentile £27,500 £31,250 £30,000
25th Percentile £36,250 £40,625 £40,000
Median annual salary (50th Percentile) £50,000 £55,000 £52,500
Median % change year-on-year -9.09% +4.76% +5.00%
75th Percentile £65,000 £70,000 £69,375
90th Percentile £80,000 £85,000 £82,970
UK median annual salary £55,000 £64,000 £62,500
% change year-on-year -14.06% +2.40% +4.17%

Enterprise Software
Job Vacancy Trend in the UK excluding London

Job postings citing Enterprise Software as a proportion of all IT jobs advertised in the UK excluding London.
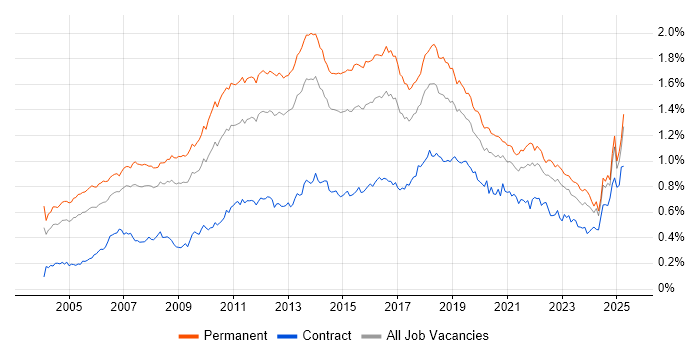
Job vacancy trend for Enterprise Software in the UK excluding London

Enterprise Software
Salary Trend in the UK excluding London

3-month moving average salary quoted in jobs citing Enterprise Software in the UK excluding London.

Salary trend for Enterprise Software in the UK excluding London

Enterprise Software
Salary Histogram in the UK excluding London

Salary distribution for jobs citing Enterprise Software in the UK excluding London over the 6 months to 26 July 2024.

Salary histogram for Enterprise Software in the UK excluding London

Enterprise Software
Job Locations in the UK excluding London

The table below looks at the demand and provides a guide to the median salaries quoted in IT jobs citing Enterprise Software within the UK excluding London region over the 6 months to 26 July 2024. The 'Rank Change' column provides an indication of the change in demand within each location based on the same 6 month period last year.

Location Rank Change
on Same Period
Last Year
Matching
Permanent
IT Job Ads
Median Salary
Past 6 Months
Median Salary
% Change
on Same Period
Last Year
Live
Jobs
South East -4 149 £53,000 -7.83% 20
North of England +1 92 £62,500 +8.70% 20
Midlands +12 81 £57,500 +9.52% 6
North West -19 57 £62,783 +0.45% 13
West Midlands +22 51 £70,000 -1.75% 3
East Midlands -18 30 £48,750 -2.50% 3
Scotland -45 30 £43,480 -13.04% 1
Yorkshire +53 29 £60,000 +9.09% 5
East of England -16 26 £56,250 -6.25% 6
Wales +41 20 £55,000 +22.22% 3
South West -5 19 £47,500 -17.39% 4
Northern Ireland +23 8 - - 7
North East - 6 £59,500 - 3
Enterprise Software
UK

Enterprise Software
Co-occurring Skills and Capabilities in the UK excluding London by Category

The follow tables expand on the table above by listing co-occurrences grouped by category. The same employment type, locality and period is covered with up to 20 co-occurrences shown in each of the following categories:

Application Platforms
1 40 (9.52%) WebLogic
2 21 (5.00%) Apache
3 13 (3.10%) SharePoint
4 10 (2.38%) Microsoft Exchange
5 9 (2.14%) Confluence
6 2 (0.48%) Oracle SOA Suite
7 1 (0.24%) IIS
Applications
1 8 (1.90%) Microsoft Excel
2 7 (1.67%) Siemens NX
3 5 (1.19%) Microsoft Office
3 5 (1.19%) MS Visio
4 3 (0.71%) InVision
4 3 (0.71%) Sketch
5 1 (0.24%) Chatbot
Business Applications
1 40 (9.52%) Sparx Enterprise Architect
2 36 (8.57%) Siebel CRM
3 8 (1.90%) Oracle EBS
3 8 (1.90%) Oracle ERP
3 8 (1.90%) PeopleSoft HCM
4 7 (1.67%) Teamcenter
5 5 (1.19%) Dynamics CRM
6 4 (0.95%) Primavera
6 4 (0.95%) SAP Hybris
7 3 (0.71%) SAP ERP
7 3 (0.71%) Workday HCM
8 2 (0.48%) Dynamics AX
8 2 (0.48%) Oracle Assets
8 2 (0.48%) Oracle EBS R12
8 2 (0.48%) Oracle Financials
8 2 (0.48%) Oracle General Ledger
8 2 (0.48%) Oracle Payables
8 2 (0.48%) Oracle Receivables
8 2 (0.48%) Temenos T24
8 2 (0.48%) Unit4 Business World
Cloud Services
1 117 (27.86%) Azure
2 109 (25.95%) AWS
3 40 (9.52%) Amazon EKS
3 40 (9.52%) Amazon SQS
4 34 (8.10%) SaaS
5 20 (4.76%) Power Platform
6 17 (4.05%) Entra ID
7 14 (3.33%) Azure DevOps
7 14 (3.33%) Dynamics 365
7 14 (3.33%) Microsoft 365
8 11 (2.62%) GitHub
9 9 (2.14%) OCI
10 7 (1.67%) AWS KMS
10 7 (1.67%) Azure Key Vault
10 7 (1.67%) Figma
10 7 (1.67%) Smartsheet
11 6 (1.43%) WhatsApp
12 5 (1.19%) Power Automate
12 5 (1.19%) PowerApps
12 5 (1.19%) Serverless
Communications & Networking
1 58 (13.81%) DNS
2 41 (9.76%) SSL
3 40 (9.52%) BGP
3 40 (9.52%) TCP/IP
4 8 (1.90%) Firewall
5 5 (1.19%) DHCP
5 5 (1.19%) Intrusion Detection
5 5 (1.19%) OpenLDAP
5 5 (1.19%) VPN
6 4 (0.95%) CTI
6 4 (0.95%) IPsec
6 4 (0.95%) Network Security
7 3 (0.71%) NAS
7 3 (0.71%) SAN
8 2 (0.48%) Intranet
8 2 (0.48%) LAN
8 2 (0.48%) WAN
9 1 (0.24%) Internet
9 1 (0.24%) SNMP
9 1 (0.24%) VLAN
Database & Business Intelligence
1 60 (14.29%) SQL Server
2 53 (12.62%) Relational Database
3 47 (11.19%) RDBMS
4 45 (10.71%) Amazon RDS
5 40 (9.52%) Oracle Database
6 36 (8.57%) Oracle BI EE
6 36 (8.57%) Siebel EIM
7 29 (6.90%) MongoDB
7 29 (6.90%) PostgreSQL
8 14 (3.33%) Power BI
9 8 (1.90%) MySQL
10 7 (1.67%) NoSQL
10 7 (1.67%) Tableau
11 6 (1.43%) SQLite
12 5 (1.19%) Data Lake
13 4 (0.95%) Amazon QuickSight
13 4 (0.95%) Azure SQL Database
14 3 (0.71%) Crystal Reports
14 3 (0.71%) Elasticsearch
15 2 (0.48%) OLAP
Development Applications
1 26 (6.19%) Git
2 22 (5.24%) JIRA
3 17 (4.05%) Jenkins
3 17 (4.05%) JUnit
4 12 (2.86%) TeamCity
5 10 (2.38%) SonarQube
5 10 (2.38%) Visual Studio
6 8 (1.90%) Cypress.io
6 8 (1.90%) GitLab
7 7 (1.67%) IntelliJ
7 7 (1.67%) Mockito
8 6 (1.43%) Octopus Deploy
9 5 (1.19%) Bugzilla
9 5 (1.19%) Zephyr
10 4 (0.95%) Appium
10 4 (0.95%) Gradle
11 3 (0.71%) Bitbucket
11 3 (0.71%) Maven
12 2 (0.48%) ReSharper
12 2 (0.48%) Selenium
General
1 131 (31.19%) Social Skills
2 69 (16.43%) Finance
3 55 (13.10%) Analytical Skills
4 36 (8.57%) Aerospace
5 26 (6.19%) Public Sector
6 22 (5.24%) Law
7 19 (4.52%) Manufacturing
8 16 (3.81%) Inclusion and Diversity
9 13 (3.10%) Legal
9 13 (3.10%) Retail
10 12 (2.86%) Organisational Skills
11 9 (2.14%) Back Office
11 9 (2.14%) Marketing
11 9 (2.14%) Telecoms
12 6 (1.43%) Advertising
12 6 (1.43%) Presentation Skills
13 5 (1.19%) Billing
13 5 (1.19%) Fire and Rescue
14 4 (0.95%) Local Government
14 4 (0.95%) Welsh Language
Job Titles
1 129 (30.71%) Developer
2 114 (27.14%) Senior
3 66 (15.71%) Senior Developer
4 58 (13.81%) Lead
5 53 (12.62%) Architect
6 43 (10.24%) Solutions Architect
7 40 (9.52%) Lead Architect
7 40 (9.52%) Lead Solutions Architect
8 36 (8.57%) Senior Siebel Developer
8 36 (8.57%) Siebel Developer
9 31 (7.38%) Analyst
10 25 (5.95%) Applications Manager
11 23 (5.48%) Consultant
11 23 (5.48%) Support Engineer
12 21 (5.00%) Software Developer
12 21 (5.00%) Software Support Engineer
13 20 (4.76%) Applications Support
13 20 (4.76%) IT Manager
14 16 (3.81%) Java Developer
14 16 (3.81%) Support Analyst
Libraries, Frameworks & Software Standards
1 80 (19.05%) .NET
2 48 (11.43%) Spring Boot
3 44 (10.48%) RabbitMQ
3 44 (10.48%) Web Services
4 40 (9.52%) REST
5 30 (7.14%) HTML
6 26 (6.19%) SOAP
7 21 (5.00%) .NET Framework
8 20 (4.76%) AngularJS
8 20 (4.76%) React
8 20 (4.76%) Spring
9 17 (4.05%) CSS
10 16 (3.81%) ASP.NET
10 16 (3.81%) Node.js
11 12 (2.86%) HTML5
11 12 (2.86%) RESTful
12 11 (2.62%) .NET Core
12 11 (2.62%) Oracle Fusion
13 10 (2.38%) ASP.NET Web API
13 10 (2.38%) Hibernate
Miscellaneous
1 47 (11.19%) Public Cloud
2 13 (3.10%) Greenfield Project
2 13 (3.10%) Mobile App
2 13 (3.10%) Product Ownership
3 12 (2.86%) Management Information System
4 11 (2.62%) Data Protection Act
4 11 (2.62%) Hybrid Cloud
4 11 (2.62%) PKI
5 9 (2.14%) Legacy Code
6 8 (1.90%) Linux Command Line
6 8 (1.90%) Self-Motivation
7 6 (1.43%) CMDB
7 6 (1.43%) Distributed Systems
8 5 (1.19%) Client/Server
9 4 (0.95%) Housing Association
9 4 (0.95%) IVR
9 4 (0.95%) Onboarding
9 4 (0.95%) PMI
10 3 (0.71%) Analytical Mindset
10 3 (0.71%) Data Centre
Operating Systems
1 77 (18.33%) Linux
2 40 (9.52%) Red Hat Enterprise Linux
3 25 (5.95%) Windows
4 21 (5.00%) AIX
5 7 (1.67%) Windows Server
6 6 (1.43%) Android
7 5 (1.19%) Windows 10
8 4 (0.95%) Oracle Linux
9 2 (0.48%) Apple iOS
10 1 (0.24%) Unix
10 1 (0.24%) Windows Server 2016
Processes & Methodologies
1 179 (42.62%) Agile
2 98 (23.33%) Problem-Solving
3 77 (18.33%) Collaborative Working
4 76 (18.10%) SDLC
5 71 (16.90%) Actionable Insight
6 70 (16.67%) ERP
7 65 (15.48%) Scrum
8 64 (15.24%) DevOps
8 64 (15.24%) Project Management
9 56 (13.33%) CRM
10 55 (13.10%) Roadmaps
11 51 (12.14%) CI/CD
12 50 (11.90%) Systems Engineering
13 49 (11.67%) Migration
14 46 (10.95%) Open Source
15 45 (10.71%) Data Migration
16 44 (10.48%) Kanban
17 43 (10.24%) TOGAF
18 42 (10.00%) ArchiMate
19 41 (9.76%) Load Balancing
Programming Languages
1 102 (24.29%) SQL
2 81 (19.29%) C#
3 61 (14.52%) Java
4 54 (12.86%) JavaScript
5 29 (6.90%) C
6 28 (6.67%) C++
7 27 (6.43%) VB
8 23 (5.48%) Python
9 19 (4.52%) TypeScript
10 14 (3.33%) PowerShell
11 9 (2.14%) Kotlin
11 9 (2.14%) PHP
12 8 (1.90%) T-SQL
13 6 (1.43%) Go
14 5 (1.19%) VB.NET
15 4 (0.95%) Bash
15 4 (0.95%) R
16 2 (0.48%) Apex Code
16 2 (0.48%) DataWeave
16 2 (0.48%) PL/SQL
Qualifications
1 100 (23.81%) Security Cleared
2 79 (18.81%) SC Cleared
3 51 (12.14%) Degree
4 43 (10.24%) Azure Certification
5 42 (10.00%) AWS Certification
6 40 (9.52%) AWS Certified Solutions Architect
7 13 (3.10%) Computer Science Degree
8 6 (1.43%) Master's Degree
9 4 (0.95%) Oracle Certification
9 4 (0.95%) PMI Certification
10 2 (0.48%) ACCA
10 2 (0.48%) ITIL Foundation Certificate
10 2 (0.48%) PRINCE2 Certification
10 2 (0.48%) PRINCE2 Practitioner
11 1 (0.24%) ISTQB
11 1 (0.24%) MCSA
11 1 (0.24%) MCSE
11 1 (0.24%) Microsoft Certification
11 1 (0.24%) Numerate Degree
11 1 (0.24%) PMP
Quality Assurance & Compliance
1 15 (3.57%) QA
2 9 (2.14%) Cyber Essentials
3 7 (1.67%) Data Quality
4 6 (1.43%) Accessibility
4 6 (1.43%) ISO/IEC 27001
4 6 (1.43%) PCI DSS
5 5 (1.19%) NIST
5 5 (1.19%) SLA
5 5 (1.19%) WCAG
6 2 (0.48%) DICOM
7 1 (0.24%) GDPR
7 1 (0.24%) HIPAA
System Software
1 41 (9.76%) Docker
2 37 (8.81%) Active Directory
3 4 (0.95%) VMware Infrastructure
4 2 (0.48%) Hyper-V
5 1 (0.24%) Firmware
Systems Management
1 23 (5.48%) Single Sign-On
2 13 (3.10%) Kubernetes
2 13 (3.10%) Terraform
3 7 (1.67%) Active Directory Federation Services
3 7 (1.67%) CA Single Sign-On
4 6 (1.43%) Progress Chef
5 4 (0.95%) HP Quality Center
6 3 (0.71%) WSUS
7 2 (0.48%) Ansible
7 2 (0.48%) Microsoft Intune
Vendors
1 115 (27.38%) Oracle
2 101 (24.05%) Microsoft
3 40 (9.52%) Sparx
4 36 (8.57%) Siebel
5 15 (3.57%) SAP
6 13 (3.10%) ServiceNow
7 11 (2.62%) CyberArk
8 10 (2.38%) Google
8 10 (2.38%) Salesforce
8 10 (2.38%) VMware
9 8 (1.90%) Hyperion
9 8 (1.90%) JD Edwards
9 8 (1.90%) PeopleSoft
10 7 (1.67%) CA
10 7 (1.67%) Facebook
10 7 (1.67%) Siemens
11 6 (1.43%) Apple
11 6 (1.43%) Atlassian
11 6 (1.43%) Cisco
11 6 (1.43%) HP