Performance Improvement Contracts in England

Performance Improvement
UK > England

The following table provides summary statistics for contract job vacancies advertised in England with a requirement for Performance Improvement skills. Included is a benchmarking guide to the contractor rates offered in vacancies that have cited Performance Improvement over the 6 months to 29 April 2024 with a comparison to the same period in the previous 2 years.

6 months to
29 Apr 2024
Same period 2023 Same period 2022
Rank 495 549 690
Rank change year-on-year +54 +141 -124
Contract jobs citing Performance Improvement 48 99 93
As % of all contract jobs advertised in England 0.13% 0.20% 0.13%
As % of the Processes & Methodologies category 0.15% 0.22% 0.14%
Number of daily rates quoted 35 72 46
10th Percentile £275 £273 £350
25th Percentile £375 £440 £408
Median daily rate (50th Percentile) £425 £540 £515
Median % change year-on-year -21.30% +4.85% +14.44%
75th Percentile £488 £650 £608
90th Percentile £649 £760 £700
UK median daily rate £425 £550 £615
% change year-on-year -22.73% -10.57% +44.71%
Number of hourly rates quoted 4 0 3
10th Percentile - - £20.87
25th Percentile £15.17 - £22.17
Median hourly rate £15.99 - £25.29
75th Percentile £16.80 - £25.88
90th Percentile - - £26.09
UK median hourly rate £15.99 - £25.29
% change year-on-year - - -0.68%

All Process and Methodology Skills
England

Performance Improvement is in the Processes and Methodologies category. The following table is for comparison with the above and provides summary statistics for all contract job vacancies advertised in England with a requirement for process or methodology skills.

Contract vacancies with a requirement for process or methodology skills 32,201 45,536 64,490
As % of all contract IT jobs advertised in England 86.52% 90.24% 90.77%
Number of daily rates quoted 21,119 31,974 45,794
10th Percentile £300 £325 £331
25th Percentile £413 £445 £425
Median daily rate (50th Percentile) £525 £550 £538
Median % change year-on-year -4.55% +2.33% +9.14%
75th Percentile £650 £675 £650
90th Percentile £750 £766 £750
UK median daily rate £525 £550 £525
% change year-on-year -4.55% +4.76% +7.69%
Number of hourly rates quoted 2,240 1,592 1,770
10th Percentile £12.91 £10.87 £12.50
25th Percentile £16.00 £16.25 £15.25
Median hourly rate £35.83 £37.50 £24.48
Median % change year-on-year -4.45% +53.20% +1.99%
75th Percentile £60.00 £65.00 £49.25
90th Percentile £72.50 £75.00 £63.75
UK median hourly rate £35.50 £37.30 £25.00
% change year-on-year -4.83% +49.20% -

Performance Improvement
Job Vacancy Trend in England

Job postings citing Performance Improvement as a proportion of all IT jobs advertised in England.
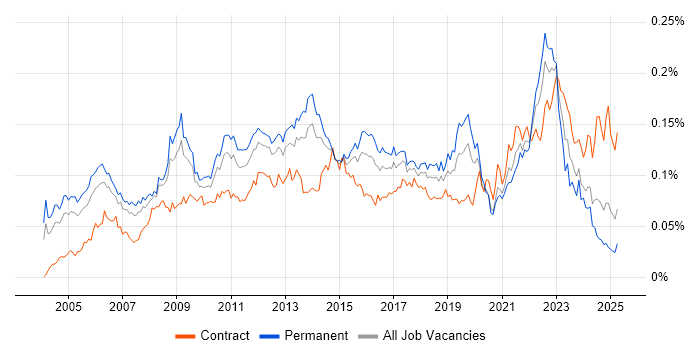
Job vacancy trend for Performance Improvement in England

Performance Improvement
Contractor Daily Rate Trend in England

3-month moving average daily rate quoted in jobs citing Performance Improvement in England.

Daily rate trend for Performance Improvement in England

Performance Improvement
Daily Rate Histogram in England

Daily rate distribution for jobs citing Performance Improvement in England over the 6 months to 29 April 2024.

Daily rate histogram for Performance Improvement in England

Performance Improvement
Contractor Hourly Rate Trend in England

3-month moving average hourly rates quoted in jobs citing Performance Improvement in England.

Hourly rate trend for Performance Improvement in England

Performance Improvement
Contract Job Locations in England

The table below looks at the demand and provides a guide to the median contractor rates quoted in IT jobs citing Performance Improvement within the England region over the 6 months to 29 April 2024. The 'Rank Change' column provides an indication of the change in demand within each location based on the same 6 month period last year.

Location Rank Change
on Same Period
Last Year
Matching
Contract
IT Job Ads
Median
Daily Rate
Past 6 Months
Median Daily Rate
% Change
on Same Period
Last Year
Live
Jobs
South East +18 19 £413 -10.81% 11
London +79 17 £443 -26.17% 32
South West - 5 £396 - 8
West Midlands +25 4 £406 +35.42% 5
Midlands +24 4 £406 +35.42% 11
Yorkshire +19 1 - - 6
North of England +15 1 - - 18
East of England +4 1 £500 -13.04% 2
Performance Improvement
UK

Performance Improvement
Co-occurring Skills and Capabilities in England by Category

The follow tables expand on the table above by listing co-occurrences grouped by category. The same employment type, locality and period is covered with up to 20 co-occurrences shown in each of the following categories:

Application Platforms
1 3 (6.25%) nginx
1 3 (6.25%) Tomcat
2 1 (2.08%) Apache Spark
Applications
1 9 (18.75%) Microsoft Excel
2 7 (14.58%) Microsoft Office
3 5 (10.42%) Microsoft PowerPoint
4 3 (6.25%) SPSS
Cloud Services
1 11 (22.92%) Power Platform
2 6 (12.50%) Azure
3 4 (8.33%) AWS
3 4 (8.33%) Azure Data Factory
3 4 (8.33%) Azure Functions
3 4 (8.33%) Serverless
4 3 (6.25%) Amazon ElastiCache
4 3 (6.25%) Amazon OpenSearch
4 3 (6.25%) Amazon SQS
4 3 (6.25%) Microsoft 365
5 2 (4.17%) Azure Logic Apps
5 2 (4.17%) Azure Pipelines
5 2 (4.17%) Azure Synapse Analytics
6 1 (2.08%) Figma
6 1 (2.08%) Rubrik
6 1 (2.08%) WhatsApp
Communications & Networking
1 5 (10.42%) 3G
1 5 (10.42%) 4G
1 5 (10.42%) 5G
1 5 (10.42%) Diameter Protocol
1 5 (10.42%) DNS
1 5 (10.42%) GGSN
1 5 (10.42%) LTE
1 5 (10.42%) Radio Access Network
1 5 (10.42%) RANAP
1 5 (10.42%) SGSN
1 5 (10.42%) VoLTE
1 5 (10.42%) Wireshark
2 2 (4.17%) Remote Desktop
2 2 (4.17%) VPN
3 1 (2.08%) IP Telephony
Database & Business Intelligence
1 11 (22.92%) Power BI
2 7 (14.58%) Amazon RDS
3 6 (12.50%) Azure SQL Database
4 3 (6.25%) Amazon Aurora
4 3 (6.25%) BusinessObjects XI
4 3 (6.25%) Elasticsearch
4 3 (6.25%) PostgreSQL
4 3 (6.25%) Power Query
4 3 (6.25%) PowerPivot
5 2 (4.17%) Data Lake
6 1 (2.08%) DataStage
6 1 (2.08%) Spark SQL
6 1 (2.08%) Tableau
Development Applications
1 3 (6.25%) Bitbucket
1 3 (6.25%) Cucumber
1 3 (6.25%) EasyMock
1 3 (6.25%) Jenkins
1 3 (6.25%) JUnit
1 3 (6.25%) Maven
1 3 (6.25%) Mockito
1 3 (6.25%) Postman
1 3 (6.25%) Selenium
1 3 (6.25%) SonarQube
1 3 (6.25%) TestNG
General
1 10 (20.83%) Analytical Skills
2 9 (18.75%) Finance
2 9 (18.75%) Social Skills
2 9 (18.75%) Telecoms
3 6 (12.50%) Presentation Skills
4 5 (10.42%) Billing
4 5 (10.42%) Multimedia
5 4 (8.33%) Local Government
6 3 (6.25%) Banking
6 3 (6.25%) Influencing Skills
7 2 (4.17%) Law
8 1 (2.08%) Advertising
8 1 (2.08%) Automotive
8 1 (2.08%) Legal
8 1 (2.08%) Marketing
8 1 (2.08%) Wholesale Banking
Job Titles
1 13 (27.08%) Lead
2 12 (25.00%) Administrator
3 9 (18.75%) Developer
4 5 (10.42%) C Developer
4 5 (10.42%) Server Administrator
4 5 (10.42%) Windows Administrator
4 5 (10.42%) Windows Server Administrator
5 4 (8.33%) Azure Data Engineer
5 4 (8.33%) Azure Engineer
5 4 (8.33%) Data Engineer
6 3 (6.25%) Analyst
6 3 (6.25%) Backup Administrator
7 2 (4.17%) Backend Developer
7 2 (4.17%) Commercial Director
7 2 (4.17%) Data Analyst
7 2 (4.17%) Java Developer
7 2 (4.17%) Junior
8 1 (2.08%) C/C++ Developer
8 1 (2.08%) React Developer
8 1 (2.08%) Technology Director
Libraries, Frameworks & Software Standards
1 4 (8.33%) XML
2 3 (6.25%) Elastic Stack
2 3 (6.25%) Gherkin
2 3 (6.25%) Guice
2 3 (6.25%) JAX-RS
2 3 (6.25%) Kafka
2 3 (6.25%) Mustache
2 3 (6.25%) OpenAPI
2 3 (6.25%) REST
2 3 (6.25%) Spring
2 3 (6.25%) Spring Boot
2 3 (6.25%) Swagger
2 3 (6.25%) WireMock
3 1 (2.08%) CSS
3 1 (2.08%) PySpark
3 1 (2.08%) React
3 1 (2.08%) WebGL
Miscellaneous
1 4 (8.33%) NHS
1 4 (8.33%) Product Ownership
1 4 (8.33%) Smart Meter
2 3 (6.25%) Linked Data
3 2 (4.17%) Freedom of Information
4 1 (2.08%) Low-Code
Operating Systems
1 9 (18.75%) Linux
1 9 (18.75%) Unix
1 9 (18.75%) Windows
2 5 (10.42%) Red Hat Enterprise Linux
2 5 (10.42%) Windows Server
3 4 (8.33%) VMS
Processes & Methodologies
1 11 (22.92%) Business Intelligence
2 8 (16.67%) Capacity Planning
3 7 (14.58%) Analytics
3 7 (14.58%) ETL
3 7 (14.58%) Mentoring
4 6 (12.50%) Problem-Solving
5 5 (10.42%) Computer Science
5 5 (10.42%) Customer Experience
5 5 (10.42%) Data Visualisation
5 5 (10.42%) Full Stack Development
5 5 (10.42%) Network Architecture
5 5 (10.42%) Performance Metrics
5 5 (10.42%) Reverse Engineering
5 5 (10.42%) Server Management
5 5 (10.42%) Statistics
5 5 (10.42%) Visualisation
5 5 (10.42%) Vulnerability Assessment
6 4 (8.33%) Continuous Improvement
6 4 (8.33%) Dimensional Modelling
6 4 (8.33%) Vulnerability Management
Programming Languages
1 15 (31.25%) SQL
2 5 (10.42%) C
2 5 (10.42%) ProC
2 5 (10.42%) Shell Script
3 4 (8.33%) PL/SQL
4 3 (6.25%) Java
5 2 (4.17%) Data Analysis Expressions
6 1 (2.08%) C++
6 1 (2.08%) JavaScript
Qualifications
1 7 (14.58%) Degree
2 5 (10.42%) Computer Science Degree
3 2 (4.17%) PRINCE2 Certification
3 2 (4.17%) SC Cleared
3 2 (4.17%) Security Cleared
4 1 (2.08%) Master's Degree
4 1 (2.08%) Six Sigma Master Black Belt
Quality Assurance & Compliance
1 4 (8.33%) GDPR
2 3 (6.25%) Data Quality
2 3 (6.25%) PMO
2 3 (6.25%) SLA
3 1 (2.08%) Accessibility
System Software
1 5 (10.42%) Firmware
2 4 (8.33%) VMware Infrastructure
3 3 (6.25%) Docker
Systems Management
1 3 (6.25%) Ansible
1 3 (6.25%) Kubernetes
1 3 (6.25%) Kustomize
1 3 (6.25%) NetBackup
1 3 (6.25%) Packer
1 3 (6.25%) Terraform
2 1 (2.08%) Grafana
Vendors
1 5 (10.42%) Empirix
1 5 (10.42%) NetScout
1 5 (10.42%) Oracle
1 5 (10.42%) Veeam
1 5 (10.42%) VMware
2 4 (8.33%) Ab Initio
2 4 (8.33%) Microsoft
3 3 (6.25%) Red Hat
4 2 (4.17%) Laserfiche
5 1 (2.08%) Cadence
5 1 (2.08%) Cloudera
5 1 (2.08%) HubSpot
5 1 (2.08%) Pardot
5 1 (2.08%) Salesforce