Architectural Patterns Contracts with Work from Home Options

Architectural Patterns
UK > Work from Home

The table below provides summary statistics for contract job vacancies with an option to work from home (WFH) and a requirement for Architectural Patterns skills. Included is a benchmarking guide to the contractor rates offered in vacancies that have cited Architectural Patterns over the 6 months to 1 May 2024 with a comparison to the same period in the previous 2 years.

6 months to
1 May 2024
Same period 2023 Same period 2022
Rank 238 308 275
Rank change year-on-year +70 -33 -59
Contract jobs citing Architectural Patterns 111 169 423
As % of all contract jobs with a WFH option 0.72% 0.66% 0.95%
As % of the Processes & Methodologies category 0.82% 0.73% 1.04%
Number of daily rates quoted 78 118 313
10th Percentile £446 £461 £471
25th Percentile £521 £550 £544
Median daily rate (50th Percentile) £628 £646 £613
Median % change year-on-year -2.86% +5.47% +11.36%
75th Percentile £747 £725 £738
90th Percentile £783 £750 £800
UK median daily rate £650 £625 £625
% change year-on-year +4.00% - +10.86%
Number of hourly rates quoted 1 1 1
10th Percentile - - -
25th Percentile - £64.50 £46.25
Median hourly rate £81.00 £67.00 £47.50
Median % change year-on-year +20.90% +41.05% -
75th Percentile - £69.50 £48.75
90th Percentile - - -
UK median hourly rate £81.00 £75.00 £47.50
% change year-on-year +8.00% +57.89% +20.25%

All Process and Methodology Skills
Work from Home

Architectural Patterns is in the Processes and Methodologies category. The following table is for comparison with the above and provides summary statistics for all contract job vacancies with a WFH option and a requirement for process or methodology skills.

Contract vacancies with a requirement for process or methodology skills 13,465 23,106 40,645
As % of all contract jobs with a WFH option 87.90% 89.81% 91.15%
Number of daily rates quoted 8,984 16,334 29,499
10th Percentile £325 £363 £360
25th Percentile £425 £450 £431
Median daily rate (50th Percentile) £525 £540 £525
Median % change year-on-year -2.78% +2.86% +8.81%
75th Percentile £638 £650 £625
90th Percentile £750 £750 £719
UK median daily rate £525 £550 £525
% change year-on-year -4.55% +4.76% +7.69%
Number of hourly rates quoted 579 532 548
10th Percentile £15.17 £19.00 £13.50
25th Percentile £25.25 £30.54 £19.98
Median hourly rate £43.00 £55.00 £35.00
Median % change year-on-year -21.82% +57.14% +34.62%
75th Percentile £60.00 £68.75 £55.00
90th Percentile £75.25 £80.00 £67.50
UK median hourly rate £35.50 £36.42 £25.00
% change year-on-year -2.53% +45.69% -

Architectural Patterns
Trend for Jobs with a WFH Option

Job vacancies with a work from home option citing Architectural Patterns as a proportion of all IT jobs advertised.
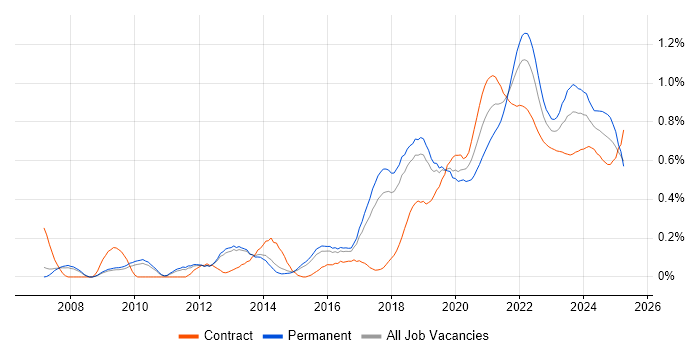
Architectural Patterns trend for jobs with a WFH option

Architectural Patterns
Daily Rate Trend for Jobs with a WFH Option

3-month moving average daily rate quoted in job vacancies with a work from home option citing Architectural Patterns.

Architectural Patterns daily rate for jobs with a WFH option

Architectural Patterns
Daily Rate Histogram for Jobs with a WFH Option

Daily rate distribution for jobs with a work from home option citing Architectural Patterns over the 6 months to 1 May 2024.

Architectural Patterns daily rate histogram for jobs with a WFH option

Architectural Patterns
Hourly Rate Trend for Jobs with a WFH Option

3-month moving average hourly rate quoted in job vacancies with a work from home option citing Architectural Patterns.

Architectural Patterns hourly rate for jobs with a WFH option

Architectural Patterns
Co-occurring Skills and Capabilities with WFH Options by Category

The follow tables expand on the table above by listing co-occurrences grouped by category. The same employment type, locality and period is covered with up to 20 co-occurrences shown in each of the following categories:

Application Platforms
1 2 (1.80%) Mule
2 1 (0.90%) Anypoint
2 1 (0.90%) Apache
2 1 (0.90%) Apache Spark
2 1 (0.90%) CMS
2 1 (0.90%) Confluence
2 1 (0.90%) Microsoft Exchange
2 1 (0.90%) Tomcat
Applications
1 4 (3.60%) MS Visio
Business Applications
1 4 (3.60%) Dynamics CRM
2 3 (2.70%) Sparx Enterprise Architect
Cloud Services
1 50 (45.05%) Azure
2 29 (26.13%) AWS
3 14 (12.61%) Azure DevOps
4 9 (8.11%) Power Platform
5 8 (7.21%) GCP
6 7 (6.31%) IaaS
6 7 (6.31%) PaaS
6 7 (6.31%) SaaS
7 6 (5.41%) Serverless
8 4 (3.60%) Amazon EKS
8 4 (3.60%) Azure AKS
8 4 (3.60%) Dynamics 365
8 4 (3.60%) GitHub
9 3 (2.70%) Azure Key Vault
9 3 (2.70%) Azure Logic Apps
9 3 (2.70%) Azure Service Bus
9 3 (2.70%) Azure Storage
9 3 (2.70%) Datadog
9 3 (2.70%) Power Automate
9 3 (2.70%) PowerApps
Communications & Networking
1 15 (13.51%) Network Security
2 7 (6.31%) LAN
2 7 (6.31%) WAN
3 2 (1.80%) Firewall
3 2 (1.80%) SCCP
4 1 (0.90%) 4G
4 1 (0.90%) ATM
4 1 (0.90%) Cisco Nexus
4 1 (0.90%) DMZ
4 1 (0.90%) SMS
4 1 (0.90%) VPN
Database & Business Intelligence
1 9 (8.11%) SQL Server
2 7 (6.31%) Relational Database
3 6 (5.41%) RDBMS
4 5 (4.50%) Big Data
5 4 (3.60%) PostgreSQL
5 4 (3.60%) SQLite
6 3 (2.70%) Azure SQL Database
6 3 (2.70%) Data Lake
6 3 (2.70%) Data Warehouse
6 3 (2.70%) OLTP
7 2 (1.80%) Apache Cassandra
7 2 (1.80%) Metadata
7 2 (1.80%) NoSQL
7 2 (1.80%) Redis
8 1 (0.90%) Apache Hive
8 1 (0.90%) Data Mining
8 1 (0.90%) Hadoop
8 1 (0.90%) HBase
8 1 (0.90%) MySQL
8 1 (0.90%) SAP HANA
Development Applications
1 11 (9.91%) Git
2 5 (4.50%) JIRA
3 3 (2.70%) Cypress.io
3 3 (2.70%) Jenkins
3 3 (2.70%) Visual Studio Team System
4 2 (1.80%) Postman
4 2 (1.80%) TeamCity
5 1 (0.90%) Android Studio
5 1 (0.90%) Gatling
5 1 (0.90%) JUnit
5 1 (0.90%) Mercurial
5 1 (0.90%) Mockito
5 1 (0.90%) ScalaTest
5 1 (0.90%) SonarQube
5 1 (0.90%) Subversion
General
1 29 (26.13%) Social Skills
2 25 (22.52%) Finance
3 10 (9.01%) Influencing Skills
3 10 (9.01%) Public Sector
4 8 (7.21%) Analytical Skills
5 7 (6.31%) Banking
5 7 (6.31%) Legal
6 6 (5.41%) Retail
7 4 (3.60%) Law
8 3 (2.70%) Investment Banking
8 3 (2.70%) Retail Banking
8 3 (2.70%) Wholesale Banking
9 2 (1.80%) Marketing
10 1 (0.90%) Manufacturing
10 1 (0.90%) Military
10 1 (0.90%) Organisational Skills
10 1 (0.90%) Police
10 1 (0.90%) Presentation Skills
10 1 (0.90%) Telecoms
Job Titles
1 77 (69.37%) Architect
2 29 (26.13%) Solutions Architect
3 22 (19.82%) Security Architect
4 20 (18.02%) Developer
5 14 (12.61%) Technical Architect
6 12 (10.81%) Lead
6 12 (10.81%) Senior
7 10 (9.01%) Azure Architect
8 7 (6.31%) Lead Architect
8 7 (6.31%) Senior Developer
9 6 (5.41%) Cloud Architect
10 5 (4.50%) Software Engineer
11 4 (3.60%) Enterprise Architect
11 4 (3.60%) Java Developer
11 4 (3.60%) Lead Security Architect
11 4 (3.60%) Principal Architect
12 3 (2.70%) Digital Architect
12 3 (2.70%) Salesforce Architect
12 3 (2.70%) Salesforce Solution Architect
12 3 (2.70%) Senior Android Developer
Libraries, Frameworks & Software Standards
1 17 (15.32%) .NET
2 8 (7.21%) Middleware
2 8 (7.21%) XML
3 7 (6.31%) .NET Framework
3 7 (6.31%) Spring
4 5 (4.50%) ASP.NET
4 5 (4.50%) JSON
4 5 (4.50%) REST
4 5 (4.50%) RESTful
4 5 (4.50%) Spring Boot
4 5 (4.50%) Web Services
5 4 (3.60%) Kafka
6 3 (2.70%) AngularJS
6 3 (2.70%) ARM Templates
6 3 (2.70%) CSS
6 3 (2.70%) PyTorch
6 3 (2.70%) React
6 3 (2.70%) scikit-learn
6 3 (2.70%) SOAP
6 3 (2.70%) TensorFlow
Miscellaneous
1 10 (9.01%) Public Cloud
2 7 (6.31%) Hybrid Cloud
3 6 (5.41%) Cloud Native
4 5 (4.50%) Management Information System
4 5 (4.50%) Mobile App
5 3 (2.70%) Algorithms
5 3 (2.70%) Low-Code
6 2 (1.80%) Data Centre
6 2 (1.80%) Data Structures
6 2 (1.80%) Distributed Systems
6 2 (1.80%) Reinsurance
6 2 (1.80%) Self-Motivation
7 1 (0.90%) Data Fabric
7 1 (0.90%) Enterprise Software
7 1 (0.90%) Greenfield Project
7 1 (0.90%) IoT
7 1 (0.90%) Legacy Systems
7 1 (0.90%) Marketing Technology
7 1 (0.90%) Private Cloud
7 1 (0.90%) Virtual Team
Operating Systems
1 9 (8.11%) Linux
2 8 (7.21%) Windows
3 4 (3.60%) Android
4 1 (0.90%) Apple iOS
4 1 (0.90%) Unix
Processes & Methodologies
1 41 (36.94%) Agile
2 34 (30.63%) DevOps
3 30 (27.03%) Design Patterns
4 27 (24.32%) Microservices
5 24 (21.62%) Information Security
6 21 (18.92%) Migration
7 20 (18.02%) Architectural Design
8 16 (14.41%) Computer Science
8 16 (14.41%) Security Management
8 16 (14.41%) TOGAF
9 15 (13.51%) Information Security Management
9 15 (13.51%) IT Strategy
10 14 (12.61%) Roadmaps
10 14 (12.61%) Technology Strategy
11 13 (11.71%) Business Strategy
11 13 (11.71%) Cloud Security
12 12 (10.81%) Information Assurance
12 12 (10.81%) Machine Learning
12 12 (10.81%) Risk Assessment
12 12 (10.81%) Translating Business Requirements
Programming Languages
1 16 (14.41%) Java
2 15 (13.51%) C#
3 9 (8.11%) SQL
4 6 (5.41%) Kotlin
5 5 (4.50%) JavaScript
5 5 (4.50%) Python
6 3 (2.70%) PowerShell
7 2 (1.80%) Scala
8 1 (0.90%) C
8 1 (0.90%) C++
8 1 (0.90%) Jython
8 1 (0.90%) PHP
8 1 (0.90%) R
8 1 (0.90%) Shell Script
8 1 (0.90%) TypeScript
8 1 (0.90%) VB.NET
Qualifications
1 23 (20.72%) Degree
2 19 (17.12%) Security Cleared
3 17 (15.32%) SC Cleared
4 11 (9.91%) CISSP
5 10 (9.01%) CISM
5 10 (9.01%) TOGAF Certification
6 8 (7.21%) CISA
6 8 (7.21%) Computer Science Degree
6 8 (7.21%) CREST Certified
7 6 (5.41%) DV Cleared
8 3 (2.70%) Master's Degree
9 2 (1.80%) BPSS Clearance
10 1 (0.90%) (ISC)2 CCSP
10 1 (0.90%) AWS Certification
10 1 (0.90%) CCSP
10 1 (0.90%) Cisco Certification
10 1 (0.90%) CSSLP
10 1 (0.90%) PhD
Quality Assurance & Compliance
1 17 (15.32%) NCSC
2 11 (9.91%) QA
3 9 (8.11%) NIST
4 8 (7.21%) ISO/IEC 27001
5 6 (5.41%) GDPR
6 3 (2.70%) PCI DSS
7 2 (1.80%) Accessibility
7 2 (1.80%) COBIT
7 2 (1.80%) Data Quality
7 2 (1.80%) Sarbanes-Oxley
System Software
1 5 (4.50%) Docker
2 3 (2.70%) Active Directory
2 3 (2.70%) VMware Infrastructure
3 1 (0.90%) HDFS
Systems Management
1 10 (9.01%) Kubernetes
2 7 (6.31%) Grafana
3 6 (5.41%) Terraform
4 2 (1.80%) Istio
4 2 (1.80%) Kibana
5 1 (0.90%) Ansible
5 1 (0.90%) Argo
5 1 (0.90%) CloudHub
5 1 (0.90%) Docker Swarm
5 1 (0.90%) Hadoop YARN
5 1 (0.90%) ITRS Geneos
5 1 (0.90%) Oozie
5 1 (0.90%) Prometheus
5 1 (0.90%) Rancher
5 1 (0.90%) SCOM
Vendors
1 14 (12.61%) Microsoft
2 10 (9.01%) Oracle
3 6 (5.41%) Databricks
4 4 (3.60%) Google
4 4 (3.60%) Salesforce
4 4 (3.60%) Sparx
5 3 (2.70%) VMware
5 3 (2.70%) Workday
6 2 (1.80%) Conga
6 2 (1.80%) DocuSign
6 2 (1.80%) MuleSoft
6 2 (1.80%) New Relic
6 2 (1.80%) Ping Identity
6 2 (1.80%) ServiceNow
7 1 (0.90%) BT
7 1 (0.90%) Checkmarx
7 1 (0.90%) Dynatrace
7 1 (0.90%) Salesforce Marketing Cloud
7 1 (0.90%) Splunk
7 1 (0.90%) TIBCO