Architectural Patterns Jobs with Hybrid/Remote/WFH Options

Architectural Patterns
UK > Work from Home

The table below provides summary statistics for permanent remote or hybrid work requiring Architectural Patterns skills. It includes a benchmarking guide to the annual salaries offered in vacancies that cited Architectural Patterns over the 6 months leading up to 1 May 2025, comparing them to the same period in the previous two years.

6 months to
1 May 2025
Same period 2024 Same period 2023
Rank 287 322 393
Rank change year-on-year +35 +71 -123
Permanent jobs citing Architectural Patterns 112 303 304
As % of all permanent jobs with a WFH option 0.75% 0.90% 0.71%
As % of the Processes & Methodologies category 0.80% 0.98% 0.74%
Number of salaries quoted 82 259 205
10th Percentile £56,809 £52,325 £52,500
25th Percentile £60,000 £56,809 £62,500
Median annual salary (50th Percentile) £76,250 £70,576 £75,000
Median % change year-on-year +8.04% -5.90% -9.09%
75th Percentile £87,500 £83,759 £89,852
90th Percentile £109,750 £91,387 £101,700
UK median annual salary £80,000 £70,576 £80,000
% change year-on-year +13.35% -11.78% -2.88%

All Process and Methodology Skills
Work from Home

Architectural Patterns falls under the Processes and Methodologies category. For comparison with the information above, the following table provides summary statistics for all permanent job vacancies with remote or hybrid options requiring process or methodology skills.

Permanent vacancies with a requirement for process or methodology skills 13,930 31,014 41,082
As % of all permanent jobs with a WFH option 93.15% 91.65% 96.09%
Number of salaries quoted 9,709 23,583 28,561
10th Percentile £30,000 £33,930 £37,500
25th Percentile £45,000 £42,500 £47,500
Median annual salary (50th Percentile) £60,000 £57,500 £62,500
Median % change year-on-year +4.35% -8.00% +4.17%
75th Percentile £77,500 £75,000 £82,500
90th Percentile £102,500 £95,000 £100,000
UK median annual salary £57,500 £55,000 £61,500
% change year-on-year +4.55% -10.57% +2.50%

Architectural Patterns
Trend for Jobs with a WFH Option

Job vacancies with remote working options citing Architectural Patterns as a proportion of all IT jobs advertised.
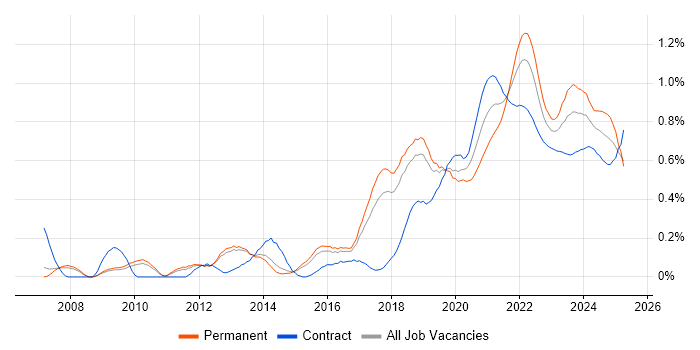
Architectural Patterns trend for jobs with Hybrid/Remote/WFH options

Architectural Patterns
Salary Trend for Jobs with a WFH Option

3-month moving average salary quoted in job vacancies with remote working options citing Architectural Patterns.

Architectural Patterns salary trend for jobs with a WFH option

Architectural Patterns
Salary Histogram for Jobs with a WFH Option

Salary distribution for jobs with remote working options citing Architectural Patterns over the 6 months to 1 May 2025.

Architectural Patterns salary histogram for jobs with a WFH option

Architectural Patterns
Co-occurring Skills and Capabilities with WFH Options by Category

The follow tables expand on the table above by listing co-occurrences grouped by category. The same employment type, locality and period is covered with up to 20 co-occurrences shown in each of the following categories:

Application Platforms
1 3 (2.68%) NetWeaver
2 1 (0.89%) Apache
2 1 (0.89%) Apache Spark
2 1 (0.89%) SAS
Cloud Services
1 32 (28.57%) GCP
2 30 (26.79%) AWS
3 25 (22.32%) SaaS
4 23 (20.54%) Azure
5 21 (18.75%) Serverless
6 14 (12.50%) AWS Lambda
7 13 (11.61%) AWS CloudFormation
7 13 (11.61%) AWS KMS
7 13 (11.61%) GitHub
8 9 (8.04%) GitHub Actions
9 8 (7.14%) OpenShift
10 4 (3.57%) Azure DevOps
11 3 (2.68%) PowerApps
12 2 (1.79%) Cloud Computing
12 2 (1.79%) Dynamics 365
12 2 (1.79%) Entra ID
12 2 (1.79%) Microsoft Purview
13 1 (0.89%) Akamai
13 1 (0.89%) Amazon S3
13 1 (0.89%) Azure Data Factory
Communications & Networking
1 17 (15.18%) Network Security
2 7 (6.25%) Firewall
3 2 (1.79%) Intrusion Detection
4 1 (0.89%) Cisco ISE
4 1 (0.89%) Cisco Nexus
4 1 (0.89%) Internet
4 1 (0.89%) LAN
4 1 (0.89%) MPLS
4 1 (0.89%) SD-WAN
4 1 (0.89%) Software-Defined Networking
4 1 (0.89%) WAN
4 1 (0.89%) WLAN
Database & Business Intelligence
1 14 (12.50%) NoSQL
2 12 (10.71%) Relational Database
3 8 (7.14%) MongoDB
4 7 (6.25%) RDBMS
4 7 (6.25%) SQL Server
5 4 (3.57%) MySQL
5 4 (3.57%) Redis
6 3 (2.68%) Hazelcast
6 3 (2.68%) SAP HANA
7 2 (1.79%) Big Data
7 2 (1.79%) Data Lake
8 1 (0.89%) Apache Cassandra
8 1 (0.89%) BigQuery
8 1 (0.89%) Delta Lake
8 1 (0.89%) DynamoDB
8 1 (0.89%) Pinecone
8 1 (0.89%) Power BI
8 1 (0.89%) Scylla
8 1 (0.89%) Snowflake Schema
8 1 (0.89%) Triplestore
Development Applications
1 11 (9.82%) Jenkins
2 10 (8.93%) Git
3 8 (7.14%) Gradle
3 8 (7.14%) SonarQube
4 2 (1.79%) GitLab
5 1 (0.89%) Babel
5 1 (0.89%) Octopus Deploy
5 1 (0.89%) webpack
General
1 38 (33.93%) Social Skills
2 27 (24.11%) Finance
3 18 (16.07%) Banking
4 14 (12.50%) Games
5 10 (8.93%) Public Sector
6 5 (4.46%) Inclusion and Diversity
7 4 (3.57%) Analytical Skills
8 2 (1.79%) Advertising
8 2 (1.79%) Back Office
8 2 (1.79%) Electronics
8 2 (1.79%) Manufacturing
8 2 (1.79%) Marketing
8 2 (1.79%) Telecoms
9 1 (0.89%) French Language
9 1 (0.89%) Law
9 1 (0.89%) Retail
Job Titles
1 59 (52.68%) Architect
2 39 (34.82%) Senior
3 24 (21.43%) Solutions Architect
4 22 (19.64%) Developer
5 18 (16.07%) Senior Architect
6 15 (13.39%) Cloud Architect
6 15 (13.39%) Lead
6 15 (13.39%) Python Engineer
7 14 (12.50%) GCP Engineer
8 13 (11.61%) AWS Architect
9 9 (8.04%) Data Architect
9 9 (8.04%) iOS Developer
9 9 (8.04%) Senior Solutions Architect
9 9 (8.04%) Software Engineer
10 8 (7.14%) Android Developer
10 8 (7.14%) iOS Android Developer
10 8 (7.14%) Lead Developer
11 7 (6.25%) Domain Architect
11 7 (6.25%) Lead iOS Developer
11 7 (6.25%) Senior Data Architect
Libraries, Frameworks & Software Standards
1 20 (17.86%) Kafka
2 19 (16.96%) REST
3 18 (16.07%) Elastic Stack
4 15 (13.39%) FastAPI
4 15 (13.39%) Flask
5 13 (11.61%) React
6 12 (10.71%) HTML
7 10 (8.93%) .NET
7 10 (8.93%) CSS
7 10 (8.93%) Node.js
8 8 (7.14%) Unity (Game Engine)
9 7 (6.25%) .NET Core
9 7 (6.25%) OpenAPI
10 6 (5.36%) RabbitMQ
10 6 (5.36%) RESTful
11 5 (4.46%) Spring Boot
12 4 (3.57%) .NET Framework
12 4 (3.57%) Spring
13 3 (2.68%) AngularJS
13 3 (2.68%) React Native
Miscellaneous
1 17 (15.18%) Mobile App
2 16 (14.29%) Cloud Native
3 14 (12.50%) Legacy Systems
3 14 (12.50%) Mobile Games
4 13 (11.61%) Management Information System
5 10 (8.93%) Public Cloud
6 8 (7.14%) Private Cloud
7 6 (5.36%) Enterprise Software
8 5 (4.46%) Educational Technology
8 5 (4.46%) IoT
8 5 (4.46%) Product Ownership
9 4 (3.57%) Greenfield Project
10 2 (1.79%) Distributed Systems
10 2 (1.79%) Legacy Applications
11 1 (0.89%) Credit Risk
11 1 (0.89%) Data Centre
11 1 (0.89%) Data Structures
11 1 (0.89%) Driving Licence
11 1 (0.89%) Grid Computing
11 1 (0.89%) Online Banking
Operating Systems
1 11 (9.82%) Android
1 11 (9.82%) Apple iOS
2 2 (1.79%) Windows
Processes & Methodologies
1 55 (49.11%) Microservices
2 51 (45.54%) Agile
3 45 (40.18%) Software Engineering
4 37 (33.04%) Design Patterns
4 37 (33.04%) Mentoring
5 34 (30.36%) DevOps
6 33 (29.46%) Problem-Solving
6 33 (29.46%) Technical Leadership
7 32 (28.57%) Containerisation
8 31 (27.68%) CI/CD
9 29 (25.89%) Computer Science
10 26 (23.21%) Architectural Design
11 23 (20.54%) Zero Trust
12 21 (18.75%) Event-Driven
12 21 (18.75%) Product Management
12 21 (18.75%) Roadmaps
13 20 (17.86%) Event-Driven Architecture
13 20 (17.86%) Security Architecture
14 19 (16.96%) Data Architecture
15 18 (16.07%) Coaching
Programming Languages
1 31 (27.68%) Java
2 22 (19.64%) SQL
3 20 (17.86%) Python
4 17 (15.18%) JavaScript
5 11 (9.82%) Kotlin
5 11 (9.82%) Swift
6 10 (8.93%) C#
7 9 (8.04%) TypeScript
8 8 (7.14%) Objective-C
9 5 (4.46%) PHP
10 3 (2.68%) ABAP
11 2 (1.79%) PowerShell
12 1 (0.89%) JCL
12 1 (0.89%) Ruby
12 1 (0.89%) Scala
12 1 (0.89%) SHACL
12 1 (0.89%) SPARQL
Qualifications
1 30 (26.79%) Degree
2 28 (25.00%) Computer Science Degree
3 19 (16.96%) Security Cleared
4 16 (14.29%) SC Cleared
5 13 (11.61%) AWS Certification
5 13 (11.61%) AWS Certified Solutions Architect
6 2 (1.79%) Cisco Certification
6 2 (1.79%) CISSP
6 2 (1.79%) DV Cleared
7 1 (0.89%) ACSA
7 1 (0.89%) ACSP
7 1 (0.89%) CCNP
7 1 (0.89%) CCSK
7 1 (0.89%) CCSP
7 1 (0.89%) ISSAP
7 1 (0.89%) Master's Degree
Quality Assurance & Compliance
1 16 (14.29%) GDPR
1 16 (14.29%) HIPAA
1 16 (14.29%) QA
2 3 (2.68%) Data Quality
2 3 (2.68%) ISO/IEC 27001
2 3 (2.68%) NIST
2 3 (2.68%) SOC 2
3 1 (0.89%) COBIT
3 1 (0.89%) GRC
3 1 (0.89%) NCSC
System Software
1 41 (36.61%) Docker
2 1 (0.89%) Active Directory
Systems Management
1 42 (37.50%) Kubernetes
2 27 (24.11%) Terraform
3 13 (11.61%) Grafana
3 13 (11.61%) Prometheus
4 1 (0.89%) Istio
Vendors
1 31 (27.68%) Google
2 14 (12.50%) Microsoft
3 8 (7.14%) New Relic
4 5 (4.46%) SAP
5 3 (2.68%) IBM
6 2 (1.79%) Databricks
7 1 (0.89%) Cisco
7 1 (0.89%) CyberArk
7 1 (0.89%) Meraki
7 1 (0.89%) Netskope
7 1 (0.89%) Okta
7 1 (0.89%) OpenAI
7 1 (0.89%) Palo Alto
7 1 (0.89%) Teradata
7 1 (0.89%) Zscaler