Design Patterns Contracts with Work from Home Options

Design Patterns
UK > Work from Home

The table below provides summary statistics for contract job vacancies with an option to work from home (WFH) and a requirement for Design Patterns skills. Included is a benchmarking guide to the contractor rates offered in vacancies that have cited Design Patterns over the 6 months to 29 April 2024 with a comparison to the same period in the previous 2 years.

6 months to
29 Apr 2024
Same period 2023 Same period 2022
Rank 187 136 130
Rank change year-on-year -51 -6 +3
Contract jobs citing Design Patterns 173 465 906
As % of all contract jobs with a WFH option 1.13% 1.80% 2.03%
As % of the Processes & Methodologies category 1.28% 2.00% 2.23%
Number of daily rates quoted 123 336 655
10th Percentile £402 £413 £413
25th Percentile £475 £495 £491
Median daily rate (50th Percentile) £585 £600 £575
Median % change year-on-year -2.50% +4.35% +15.00%
75th Percentile £753 £750 £675
90th Percentile £850 £775 £775
UK median daily rate £601 £620 £616
% change year-on-year -3.13% +0.65% +17.33%
Number of hourly rates quoted 5 13 19
10th Percentile £66.75 £62.90 £46.25
25th Percentile £67.50 £70.00 -
Median hourly rate £70.00 £72.50 £60.00
Median % change year-on-year -3.45% +20.83% +9.09%
75th Percentile £72.50 £75.00 £65.54
90th Percentile £78.50 - £65.93
UK median hourly rate £70.00 £73.75 £63.43
% change year-on-year -5.08% +16.28% +15.32%

All Process and Methodology Skills
Work from Home

Design Patterns is in the Processes and Methodologies category. The following table is for comparison with the above and provides summary statistics for all contract job vacancies with a WFH option and a requirement for process or methodology skills.

Contract vacancies with a requirement for process or methodology skills 13,505 23,232 40,651
As % of all contract jobs with a WFH option 87.83% 89.84% 91.14%
Number of daily rates quoted 9,015 16,421 29,503
10th Percentile £325 £363 £360
25th Percentile £425 £450 £431
Median daily rate (50th Percentile) £525 £540 £525
Median % change year-on-year -2.78% +2.86% +9.03%
75th Percentile £638 £650 £625
90th Percentile £750 £750 £719
UK median daily rate £525 £550 £525
% change year-on-year -4.55% +4.76% +7.69%
Number of hourly rates quoted 573 532 547
10th Percentile £15.17 £19.00 £13.50
25th Percentile £24.25 £30.54 £19.96
Median hourly rate £42.50 £55.00 £35.00
Median % change year-on-year -22.73% +57.14% +34.62%
75th Percentile £60.00 £68.75 £55.00
90th Percentile £75.25 £80.23 £67.50
UK median hourly rate £35.50 £37.30 £25.00
% change year-on-year -4.83% +49.20% -

Design Patterns
Trend for Jobs with a WFH Option

Job vacancies with a work from home option citing Design Patterns as a proportion of all IT jobs advertised.
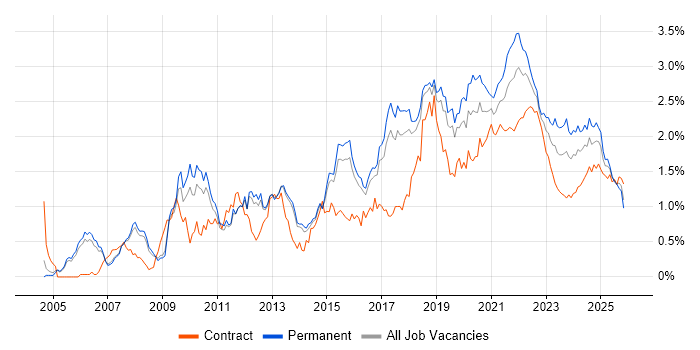
Design Patterns trend for jobs with a WFH option

Design Patterns
Daily Rate Trend for Jobs with a WFH Option

3-month moving average daily rate quoted in job vacancies with a work from home option citing Design Patterns.

Design Patterns daily rate for jobs with a WFH option

Design Patterns
Daily Rate Histogram for Jobs with a WFH Option

Daily rate distribution for jobs with a work from home option citing Design Patterns over the 6 months to 29 April 2024.

Design Patterns daily rate histogram for jobs with a WFH option

Design Patterns
Hourly Rate Trend for Jobs with a WFH Option

3-month moving average hourly rate quoted in job vacancies with a work from home option citing Design Patterns.

Design Patterns hourly rate for jobs with a WFH option

Design Patterns
Hourly Rate Histogram for Jobs with a WFH Option

Hourly rate distribution for jobs with a work from home option citing Design Patterns over the 6 months to 29 April 2024.

Design Patterns hourly rate histogram for jobs with a WFH option

Design Patterns
Co-occurring Skills and Capabilities with WFH Options by Category

The follow tables expand on the table above by listing co-occurrences grouped by category. The same employment type, locality and period is covered with up to 20 co-occurrences shown in each of the following categories:

Application Platforms
1 5 (2.89%) Confluence
2 4 (2.31%) Oracle SOA Suite
3 3 (1.73%) Apache Spark
3 3 (1.73%) CMS
3 3 (1.73%) IIS
4 2 (1.16%) Headless CMS
5 1 (0.58%) Anypoint
5 1 (0.58%) Apache
5 1 (0.58%) Mule
5 1 (0.58%) SharePoint
5 1 (0.58%) Tomcat
Applications
1 4 (2.31%) MS Visio
Business Applications
1 6 (3.47%) Dynamics CRM
2 4 (2.31%) Temenos T24
3 2 (1.16%) Endur
4 1 (0.58%) NetSuite
4 1 (0.58%) Shopify
Cloud Services
1 50 (28.90%) Azure
2 42 (24.28%) AWS
3 12 (6.94%) Azure DevOps
4 8 (4.62%) Power Platform
4 8 (4.62%) SaaS
5 7 (4.05%) IaaS
5 7 (4.05%) PaaS
6 6 (3.47%) Dynamics 365
6 6 (3.47%) npm
7 5 (2.89%) Azure AKS
7 5 (2.89%) Serverless
8 4 (2.31%) Amazon EKS
8 4 (2.31%) Apigee
8 4 (2.31%) Entra ID
8 4 (2.31%) GCP
8 4 (2.31%) GitHub
8 4 (2.31%) Kong
8 4 (2.31%) Microsoft 365
9 3 (1.73%) Amazon SQS
9 3 (1.73%) Azure Data Factory
Communications & Networking
1 10 (5.78%) Firewall
2 9 (5.20%) VPN
3 2 (1.16%) LAN
3 2 (1.16%) Network Security
3 2 (1.16%) PPP
3 2 (1.16%) SAN
3 2 (1.16%) WAN
4 1 (0.58%) ATM
4 1 (0.58%) Cisco Nexus
4 1 (0.58%) DMZ
4 1 (0.58%) FTP
4 1 (0.58%) HTTP
4 1 (0.58%) NFC
4 1 (0.58%) SMS
Database & Business Intelligence
1 28 (16.18%) SQL Server
2 20 (11.56%) Relational Database
3 15 (8.67%) NoSQL
4 12 (6.94%) MongoDB
4 12 (6.94%) MySQL
5 6 (3.47%) RDBMS
6 5 (2.89%) OLAP
6 5 (2.89%) OLTP
6 5 (2.89%) PostgreSQL
7 4 (2.31%) Oracle OLAP
8 3 (1.73%) Apache Cassandra
8 3 (1.73%) Data Warehouse
8 3 (1.73%) MariaDB
8 3 (1.73%) Power BI
8 3 (1.73%) Redis
9 2 (1.16%) Amazon Aurora
9 2 (1.16%) Amazon RDS
9 2 (1.16%) Big Data
9 2 (1.16%) Data Lake
9 2 (1.16%) HBase
Development Applications
1 22 (12.72%) JIRA
2 18 (10.40%) Git
3 10 (5.78%) Visual Studio
4 8 (4.62%) Jenkins
5 6 (3.47%) webpack
6 5 (2.89%) Cypress.io
6 5 (2.89%) GitLab
6 5 (2.89%) MSI
6 5 (2.89%) WiX
7 3 (1.73%) Gradle
7 3 (1.73%) Moq
7 3 (1.73%) SonarQube
8 2 (1.16%) git-flow
8 2 (1.16%) MSTest
8 2 (1.16%) NUnit
8 2 (1.16%) PHPUnit
8 2 (1.16%) Pylint
8 2 (1.16%) TeamCity
8 2 (1.16%) XCTest
8 2 (1.16%) XCUITest
General
1 54 (31.21%) Social Skills
2 34 (19.65%) Finance
3 27 (15.61%) Analytical Skills
4 23 (13.29%) Banking
5 19 (10.98%) Public Sector
6 11 (6.36%) Front Office
7 8 (4.62%) Retail
8 6 (3.47%) Investment Banking
9 5 (2.89%) Retail Banking
10 4 (2.31%) Corporate Banking
10 4 (2.31%) Legal
10 4 (2.31%) Marketing
11 3 (1.73%) Influencing Skills
11 3 (1.73%) Law
12 2 (1.16%) Financial Institution
12 2 (1.16%) Inclusion and Diversity
12 2 (1.16%) Publishing
13 1 (0.58%) Back Office
13 1 (0.58%) Games
13 1 (0.58%) Military
Job Titles
1 72 (41.62%) Developer
2 61 (35.26%) Architect
3 30 (17.34%) Senior
4 19 (10.98%) Full Stack Developer
4 19 (10.98%) Technical Architect
5 18 (10.40%) Senior Developer
5 18 (10.40%) Solutions Architect
6 17 (9.83%) Software Engineer
7 14 (8.09%) C# Developer
8 12 (6.94%) Lead
9 10 (5.78%) .NET Developer
9 10 (5.78%) AWS Architect
9 10 (5.78%) Cloud Architect
9 10 (5.78%) React Developer
10 9 (5.20%) Full-Stack C# Developer
10 9 (5.20%) Java Developer
10 9 (5.20%) Senior Software Engineer
11 8 (4.62%) Pega Architect
11 8 (4.62%) Technical Leader
12 7 (4.05%) Lead Architect
Libraries, Frameworks & Software Standards
1 41 (23.70%) .NET
2 36 (20.81%) REST
3 32 (18.50%) React
4 27 (15.61%) Node.js
5 26 (15.03%) ASP.NET
6 22 (12.72%) HTML
7 20 (11.56%) CSS
8 19 (10.98%) Web Services
9 18 (10.40%) AngularJS
10 17 (9.83%) .NET Framework
11 16 (9.25%) SOAP
12 14 (8.09%) JSON
12 14 (8.09%) RESTful
12 14 (8.09%) Vue
13 13 (7.51%) Entity Framework
14 12 (6.94%) XML
15 10 (5.78%) ASP.NET Core
15 10 (5.78%) ASP.NET Web API
15 10 (5.78%) Kafka
16 9 (5.20%) Spring
Miscellaneous
1 12 (6.94%) Public Cloud
2 9 (5.20%) Algorithms
3 8 (4.62%) Distributed Systems
4 6 (3.47%) Cloud Native
4 6 (3.47%) Hybrid Cloud
4 6 (3.47%) Management Information System
4 6 (3.47%) Product Ownership
5 5 (2.89%) Client/Server
5 5 (2.89%) Data Structures
5 5 (2.89%) Web 2.0
6 4 (2.31%) DataPower
6 4 (2.31%) Derivative
6 4 (2.31%) Mobile App
6 4 (2.31%) Self-Motivation
7 3 (1.73%) Fixed Income
7 3 (1.73%) Foreign Exchange (FX)
7 3 (1.73%) Linux Command Line
8 2 (1.16%) Enterprise Software
8 2 (1.16%) Equity Derivative
8 2 (1.16%) Marketing Technology
Operating Systems
1 19 (10.98%) Android
1 19 (10.98%) Windows
2 15 (8.67%) Apple iOS
3 13 (7.51%) Linux
4 10 (5.78%) Windows Server
5 6 (3.47%) Unix
6 2 (1.16%) Embedded Linux
7 1 (0.58%) Red Hat Enterprise Linux
7 1 (0.58%) tvOS
7 1 (0.58%) Ubuntu
Processes & Methodologies
1 64 (36.99%) Agile
2 49 (28.32%) DevOps
3 44 (25.43%) Software Engineering
4 41 (23.70%) Microservices
5 39 (22.54%) CI/CD
6 36 (20.81%) OO
7 32 (18.50%) Problem-Solving
8 30 (17.34%) Architectural Patterns
9 21 (12.14%) Full Stack Development
10 20 (11.56%) Continuous Improvement
10 20 (11.56%) SOLID
11 18 (10.40%) MVC
11 18 (10.40%) Web Development
12 17 (9.83%) Scrum
13 16 (9.25%) Clean Code
13 16 (9.25%) Code Quality
13 16 (9.25%) Risk Management
13 16 (9.25%) Test Automation
14 15 (8.67%) Unit Testing
15 14 (8.09%) Computer Science
Programming Languages
1 57 (32.95%) C#
2 42 (24.28%) JavaScript
3 38 (21.97%) Java
4 35 (20.23%) SQL
5 23 (13.29%) TypeScript
6 16 (9.25%) Python
7 10 (5.78%) PowerShell
8 9 (5.20%) Scala
9 7 (4.05%) PHP
10 6 (3.47%) Bash
10 6 (3.47%) T-SQL
11 5 (2.89%) C++
12 4 (2.31%) Kotlin
13 3 (1.73%) Go
13 3 (1.73%) Perl
13 3 (1.73%) Ruby
14 2 (1.16%) PL/SQL
14 2 (1.16%) Swift
14 2 (1.16%) VB.NET
15 1 (0.58%) Bicep
Qualifications
1 35 (20.23%) Degree
2 14 (8.09%) Computer Science Degree
2 14 (8.09%) Security Cleared
3 10 (5.78%) SC Cleared
4 7 (4.05%) Master's Degree
5 6 (3.47%) BPSS Clearance
6 3 (1.73%) CISM
6 3 (1.73%) CISSP
7 2 (1.16%) CCNA
7 2 (1.16%) CCNP
7 2 (1.16%) Cisco Certification
8 1 (0.58%) Azure Certification
8 1 (0.58%) CEH
8 1 (0.58%) DV Cleared
8 1 (0.58%) Numerate Degree
8 1 (0.58%) TOGAF Certification
Quality Assurance & Compliance
1 17 (9.83%) QA
2 6 (3.47%) Accessibility
2 6 (3.47%) GDPR
2 6 (3.47%) PCI DSS
3 2 (1.16%) Data Quality
3 2 (1.16%) MiFID
3 2 (1.16%) WCAG
4 1 (0.58%) Disclosure Scotland
4 1 (0.58%) ISO/IEC 27001
4 1 (0.58%) NIST
4 1 (0.58%) NIST 800
System Software
1 13 (7.51%) Docker
2 6 (3.47%) Active Directory
3 2 (1.16%) VMware ESXi
4 1 (0.58%) HDFS
4 1 (0.58%) VMware Infrastructure
Systems Management
1 12 (6.94%) Kubernetes
2 10 (5.78%) Terraform
3 4 (2.31%) Grafana
3 4 (2.31%) Single Sign-On
4 3 (1.73%) Ansible
5 2 (1.16%) Istio
5 2 (1.16%) Prometheus
5 2 (1.16%) Puppet
5 2 (1.16%) SCCM
6 1 (0.58%) Argo
6 1 (0.58%) CloudHub
6 1 (0.58%) FreeIPA
6 1 (0.58%) Hadoop YARN
6 1 (0.58%) Icinga
6 1 (0.58%) ITRS Geneos
6 1 (0.58%) Oozie
6 1 (0.58%) Progress Chef
6 1 (0.58%) Rancher
Vendors
1 22 (12.72%) Microsoft
2 13 (7.51%) Oracle
3 8 (4.62%) Pega
4 4 (2.31%) IBM
4 4 (2.31%) Salesforce
4 4 (2.31%) TSYS
5 3 (1.73%) Splunk
5 3 (1.73%) VMware
5 3 (1.73%) Workday
6 2 (1.16%) Apple
6 2 (1.16%) Avaloq
6 2 (1.16%) F5
6 2 (1.16%) Google
6 2 (1.16%) ServiceNow
7 1 (0.58%) Dynatrace
7 1 (0.58%) MuleSoft
7 1 (0.58%) Roku
7 1 (0.58%) Salesforce Marketing Cloud
7 1 (0.58%) Samsung
7 1 (0.58%) Xamarin