Change Control Contracts with Work from Home Options

Change Control
UK > Work from Home

The table below provides summary statistics for remote or hybrid contract work requiring Change Control skills. It includes a benchmarking guide to the contractor rates offered in vacancies that cited Change Control over the 6 months leading up to 20 June 2024, comparing them to the same period in the previous two years.

6 months to
20 Jun 2024
Same period 2023 Same period 2022
Rank 255 291 321
Rank change year-on-year +36 +30 -5
Contract jobs citing Change Control 87 169 335
As % of all contract jobs with a WFH option 0.59% 0.71% 0.76%
As % of the Processes & Methodologies category 0.68% 0.79% 0.84%
Number of daily rates quoted 59 112 251
10th Percentile £254 £400 £350
25th Percentile £411 £438 £413
Median daily rate (50th Percentile) £500 £515 £500
Median % change year-on-year -2.91% +3.00% +12.04%
75th Percentile £538 £625 £623
90th Percentile £602 £700 £740
UK median daily rate £500 £501 £500
% change year-on-year -0.25% +0.25% +17.65%
Number of hourly rates quoted 6 9 8
10th Percentile £13.63 £12.50 £28.34
25th Percentile £20.50 £20.79 £35.19
Median hourly rate £40.00 £47.50 £65.00
Median % change year-on-year -15.79% -26.92% +44.44%
75th Percentile £50.31 £50.00 £65.30
90th Percentile £60.78 £57.75 £66.71
UK median hourly rate £43.17 £54.00 £39.25
% change year-on-year -20.06% +37.58% +44.04%

All Process and Methodology Skills
Work from Home

Change Control falls under the Processes and Methodologies category. For comparison with the information above, the following table provides summary statistics for all contract job vacancies with remote or hybrid options requiring process or methodology skills.

Contract vacancies with a requirement for process or methodology skills 12,871 21,399 39,942
As % of all contract jobs with a WFH option 87.23% 89.63% 91.07%
Number of daily rates quoted 8,673 15,206 29,099
10th Percentile £325 £363 £363
25th Percentile £425 £450 £438
Median daily rate (50th Percentile) £525 £540 £525
Median % change year-on-year -2.78% +2.86% +5.42%
75th Percentile £638 £650 £638
90th Percentile £750 £750 £738
UK median daily rate £525 £550 £538
% change year-on-year -4.55% +2.33% +7.50%
Number of hourly rates quoted 572 495 518
10th Percentile £15.02 £18.49 £14.96
25th Percentile £24.00 £25.75 £20.75
Median hourly rate £43.00 £52.13 £40.00
Median % change year-on-year -17.51% +30.33% +66.67%
75th Percentile £60.00 £67.50 £60.00
90th Percentile £74.95 £78.45 £72.50
UK median hourly rate £37.00 £35.65 £26.00
% change year-on-year +3.79% +37.12% +13.04%

Change Control
Trend for Jobs with a WFH Option

Job vacancies with a work from home option citing Change Control as a proportion of all IT jobs advertised.
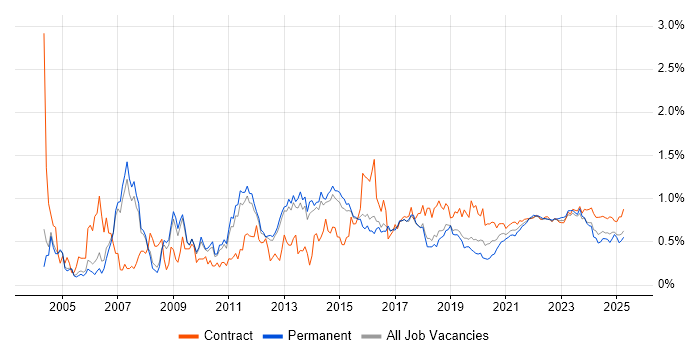
Change Control trend for jobs with a WFH option

Change Control
Daily Rate Trend for Jobs with a WFH Option

3-month moving average daily rate quoted in job vacancies with a work from home option citing Change Control.

Change Control daily rate for jobs with a WFH option

Change Control
Daily Rate Histogram for Jobs with a WFH Option

Daily rate distribution for jobs with a work from home option citing Change Control over the 6 months to 20 June 2024.

Change Control daily rate histogram for jobs with a WFH option

Change Control
Hourly Rate Trend for Jobs with a WFH Option

3-month moving average hourly rate quoted in job vacancies with a work from home option citing Change Control.

Change Control hourly rate for jobs with a WFH option

Change Control
Hourly Rate Histogram for Jobs with a WFH Option

Hourly rate distribution for jobs with a work from home option citing Change Control over the 6 months to 20 June 2024.

Change Control hourly rate histogram for jobs with a WFH option

Change Control
Co-occurring Skills and Capabilities with WFH Options by Category

The follow tables expand on the table above by listing co-occurrences grouped by category. The same employment type, locality and period is covered with up to 20 co-occurrences shown in each of the following categories:

Application Platforms
1 3 (3.45%) Microsoft Exchange
2 2 (2.30%) IIS
2 2 (2.30%) SharePoint
3 1 (1.15%) Exchange Server 2007
3 1 (1.15%) Exchange Server 2010
Applications
1 12 (13.79%) Microsoft Office
2 8 (9.20%) Microsoft Project
3 6 (6.90%) Microsoft Excel
4 2 (2.30%) Spreadsheet
5 1 (1.15%) Microsoft PowerPoint
5 1 (1.15%) MS Visio
Business Applications
1 2 (2.30%) Primavera
2 1 (1.15%) Oracle Assets
2 1 (1.15%) Oracle Cash Management
2 1 (1.15%) Oracle General Ledger
2 1 (1.15%) Oracle Payables
2 1 (1.15%) Oracle Receivables
2 1 (1.15%) Remedy ITSM
Cloud Services
1 12 (13.79%) Azure
2 11 (12.64%) AWS
3 4 (4.60%) Azure DevOps
3 4 (4.60%) GitHub
4 2 (2.30%) Amazon CloudWatch
4 2 (2.30%) Microsoft 365
4 2 (2.30%) Power Platform
5 1 (1.15%) AWS CloudFormation
5 1 (1.15%) GitHub Actions
5 1 (1.15%) Miro
5 1 (1.15%) Power Automate
5 1 (1.15%) PowerApps
5 1 (1.15%) SaaS
Communications & Networking
1 5 (5.75%) Firewall
1 5 (5.75%) WAN
2 4 (4.60%) LAN
2 4 (4.60%) MPLS
3 3 (3.45%) Cisco Nexus
3 3 (3.45%) TCP/IP
3 3 (3.45%) VPN
3 3 (3.45%) WAAS
3 3 (3.45%) Wireless
4 2 (2.30%) ADSL
4 2 (2.30%) Ethernet
4 2 (2.30%) Internet
4 2 (2.30%) PSTN
4 2 (2.30%) VLAN
5 1 (1.15%) BGP
5 1 (1.15%) DHCP
5 1 (1.15%) DMZ
5 1 (1.15%) OSPF
5 1 (1.15%) SAN
5 1 (1.15%) WLAN
Database & Business Intelligence
1 3 (3.45%) Amazon RDS
1 3 (3.45%) PostgreSQL
1 3 (3.45%) Relational Database
2 2 (2.30%) MySQL
2 2 (2.30%) Power BI
3 1 (1.15%) Amazon Aurora
3 1 (1.15%) NoSQL
3 1 (1.15%) RDBMS
3 1 (1.15%) SAP HANA
3 1 (1.15%) SQL Server
Development Applications
1 3 (3.45%) JIRA
2 1 (1.15%) AppScan
2 1 (1.15%) Burp Suite
2 1 (1.15%) Git
2 1 (1.15%) GitLab
2 1 (1.15%) Jenkins
2 1 (1.15%) SonarQube
General
1 28 (32.18%) Finance
2 20 (22.99%) Social Skills
3 10 (11.49%) Public Sector
4 8 (9.20%) Banking
5 7 (8.05%) Analytical Skills
6 6 (6.90%) Influencing Skills
6 6 (6.90%) Telecoms
7 5 (5.75%) Pharmaceutical
8 4 (4.60%) Local Government
9 3 (3.45%) Manufacturing
9 3 (3.45%) Marketing
9 3 (3.45%) Retail
10 2 (2.30%) Electronics
10 2 (2.30%) Financial Institution
10 2 (2.30%) Inclusion and Diversity
10 2 (2.30%) Legal
10 2 (2.30%) Publishing
11 1 (1.15%) Automotive
11 1 (1.15%) Back Office
11 1 (1.15%) Police
Job Titles
1 23 (26.44%) Project Manager
2 12 (13.79%) Analyst
3 10 (11.49%) Senior
4 6 (6.90%) Administrator
4 6 (6.90%) Developer
4 6 (6.90%) IT Manager
5 5 (5.75%) PMO Analyst
6 4 (4.60%) Business Analyst
6 4 (4.60%) Cloud Developer
6 4 (4.60%) DBA
6 4 (4.60%) Engineering Manager
6 4 (4.60%) IT Project Manager
6 4 (4.60%) Lead
6 4 (4.60%) Network Engineer
6 4 (4.60%) Programme Manager
6 4 (4.60%) Senior Analyst
7 3 (3.45%) 3rd Line Engineer
7 3 (3.45%) PowerShell Engineer
7 3 (3.45%) SCCM Engineer
7 3 (3.45%) Transformation Manager
Libraries, Frameworks & Software Standards
1 3 (3.45%) REST
2 1 (1.15%) Elastic Stack
2 1 (1.15%) Middleware
2 1 (1.15%) Oracle Fusion
2 1 (1.15%) SAP PI
Miscellaneous
1 4 (4.60%) Product Ownership
2 2 (2.30%) Clustering
2 2 (2.30%) Data Protection Act
2 2 (2.30%) Public Cloud
2 2 (2.30%) Virtual Team
3 1 (1.15%) Data Centre
3 1 (1.15%) Legacy Systems
3 1 (1.15%) Life Science
3 1 (1.15%) Management Information System
3 1 (1.15%) Onboarding
3 1 (1.15%) Operational Technology
3 1 (1.15%) PKI
3 1 (1.15%) SCADA
3 1 (1.15%) Security Posture
3 1 (1.15%) Self-Motivation
3 1 (1.15%) Smartcard
3 1 (1.15%) SWIFT Messaging Network
Operating Systems
1 8 (9.20%) Windows
2 5 (5.75%) Apple iOS
3 4 (4.60%) Android
4 3 (3.45%) Linux
4 3 (3.45%) Windows 10
5 2 (2.30%) Windows Server 2016
6 1 (1.15%) CentOS
6 1 (1.15%) Red Hat Enterprise Linux
6 1 (1.15%) Ubuntu
6 1 (1.15%) Windows Server
6 1 (1.15%) Windows Server 2012
6 1 (1.15%) Windows Server 2019
Processes & Methodologies
1 31 (35.63%) Project Management
2 21 (24.14%) Agile
3 18 (20.69%) Risk Management
4 15 (17.24%) Project Delivery
5 10 (11.49%) PRINCE2
6 9 (10.34%) DevOps
6 9 (10.34%) Problem-Solving
6 9 (10.34%) Programme Management
7 8 (9.20%) Business Case
7 8 (9.20%) Change Management
7 8 (9.20%) Configuration Management
7 8 (9.20%) Decision-Making
7 8 (9.20%) ITIL
7 8 (9.20%) Roadmaps
8 7 (8.05%) Stakeholder Management
9 6 (6.90%) Collaborative Working
9 6 (6.90%) Customer Service
9 6 (6.90%) Migration
9 6 (6.90%) Workflow
10 5 (5.75%) Infrastructure as Code
Programming Languages
1 9 (10.34%) PowerShell
2 6 (6.90%) SQL
3 2 (2.30%) Bash
4 1 (1.15%) Python
Qualifications
1 21 (24.14%) Security Cleared
2 18 (20.69%) SC Cleared
3 8 (9.20%) Degree
4 6 (6.90%) BPSS Clearance
5 5 (5.75%) PRINCE2 Practitioner
6 4 (4.60%) DV Cleared
7 2 (2.30%) Azure Certification
7 2 (2.30%) BC Cleared
8 1 (1.15%) (ISC)2 CCSP
8 1 (1.15%) APMP
8 1 (1.15%) Cisco Certification
8 1 (1.15%) CISSP
8 1 (1.15%) Computer Science Degree
8 1 (1.15%) CRISC
8 1 (1.15%) ISEB
8 1 (1.15%) ITIL Foundation Certificate
8 1 (1.15%) Master's Degree
8 1 (1.15%) MCSA
8 1 (1.15%) MCSE
8 1 (1.15%) Microsoft Certification
Quality Assurance & Compliance
1 17 (19.54%) PMO
2 11 (12.64%) QA
3 3 (3.45%) SLA
4 2 (2.30%) Disclosure Scotland
4 2 (2.30%) PCI DSS
5 1 (1.15%) Cyber Essentials
5 1 (1.15%) Government Security Classifications
5 1 (1.15%) GxP
5 1 (1.15%) ISO 20022
5 1 (1.15%) NCSC
System Software
1 8 (9.20%) Active Directory
2 3 (3.45%) VMware ESXi
2 3 (3.45%) VMware Infrastructure
2 3 (3.45%) vSphere
3 1 (1.15%) Docker
3 1 (1.15%) VMware NSX
3 1 (1.15%) VMware Server
3 1 (1.15%) XenApp
3 1 (1.15%) XenDesktop
Systems Management
1 8 (9.20%) SCCM
2 5 (5.75%) Terraform
3 4 (4.60%) AirWatch
4 3 (3.45%) Ansible
4 3 (3.45%) Nessus
4 3 (3.45%) WSUS
5 2 (2.30%) Grafana
5 2 (2.30%) Progress Chef
5 2 (2.30%) Puppet
6 1 (1.15%) Graylog
6 1 (1.15%) HP Fortify
6 1 (1.15%) Kubernetes
6 1 (1.15%) Nagios
6 1 (1.15%) Prometheus
6 1 (1.15%) vCenter Server
6 1 (1.15%) WebInspect
Vendors
1 21 (24.14%) Microsoft
2 6 (6.90%) Apple
2 6 (6.90%) Cisco
3 5 (5.75%) Avaya
3 5 (5.75%) VMware
4 4 (4.60%) Citrix
4 4 (4.60%) Genesys
4 4 (4.60%) Samsung
4 4 (4.60%) SAP
5 3 (3.45%) Computacenter
5 3 (3.45%) Qualys
6 2 (2.30%) BT
6 2 (2.30%) CheckPoint
6 2 (2.30%) F5
6 2 (2.30%) Fortinet
6 2 (2.30%) Juniper
6 2 (2.30%) Openreach
6 2 (2.30%) SolarWinds
7 1 (1.15%) iManage
7 1 (1.15%) Workday