Full Stack Development Contracts with Work from Home Options

Full-Stack Development
UK > Work from Home

The table below provides summary statistics for contract job vacancies with an option to work from home (WFH) and a requirement for Full Stack Development skills. Included is a benchmarking guide to the contractor rates offered in vacancies that have cited Full Stack Development over the 6 months to 5 May 2024 with a comparison to the same period in the previous 2 years.

6 months to
5 May 2024
Same period 2023 Same period 2022
Rank 74 73 67
Rank change year-on-year -1 -6 -10
Contract jobs citing Full Stack Development 408 806 1,728
As % of all contract jobs with a WFH option 2.69% 3.16% 3.88%
As % of the Processes & Methodologies category 3.06% 3.52% 4.25%
Number of daily rates quoted 333 607 1,297
10th Percentile £325 £403 £394
25th Percentile £413 £450 £450
Median daily rate (50th Percentile) £525 £550 £550
Median % change year-on-year -4.55% - +15.18%
75th Percentile £625 £669 £657
90th Percentile £750 £750 £775
UK median daily rate £525 £564 £575
% change year-on-year -6.91% -1.91% +15.00%
Number of hourly rates quoted 4 2 15
10th Percentile £30.60 £36.00 £45.50
25th Percentile £37.13 £37.50 £50.00
Median hourly rate £55.75 £40.00 £65.54
Median % change year-on-year +39.38% -38.97% +31.08%
75th Percentile £75.00 £42.50 £70.69
90th Percentile £79.50 £44.00 £77.05
UK median hourly rate £64.75 £50.00 £65.54
% change year-on-year +29.50% -23.71% +19.16%

All Process and Methodology Skills
Work from Home

Full Stack Development is in the Processes and Methodologies category. The following table is for comparison with the above and provides summary statistics for all contract job vacancies with a WFH option and a requirement for process or methodology skills.

Contract vacancies with a requirement for process or methodology skills 13,319 22,924 40,623
As % of all contract jobs with a WFH option 87.90% 89.76% 91.11%
Number of daily rates quoted 8,917 16,193 29,494
10th Percentile £325 £363 £362
25th Percentile £425 £450 £431
Median daily rate (50th Percentile) £525 £540 £525
Median % change year-on-year -2.78% +2.86% +8.25%
75th Percentile £638 £650 £630
90th Percentile £750 £750 £725
UK median daily rate £525 £550 £530
% change year-on-year -4.55% +3.77% +8.72%
Number of hourly rates quoted 575 527 541
10th Percentile £15.17 £18.67 £13.75
25th Percentile £24.63 £30.00 £20.00
Median hourly rate £42.50 £55.00 £35.00
Median % change year-on-year -22.73% +57.14% +40.00%
75th Percentile £60.00 £68.75 £55.25
90th Percentile £75.15 £80.25 £67.50
UK median hourly rate £35.95 £35.80 £25.00
% change year-on-year +0.42% +43.20% +2.04%

Full Stack Development
Trend for Jobs with a WFH Option

Job vacancies with a work from home option citing Full Stack Development as a proportion of all IT jobs advertised.
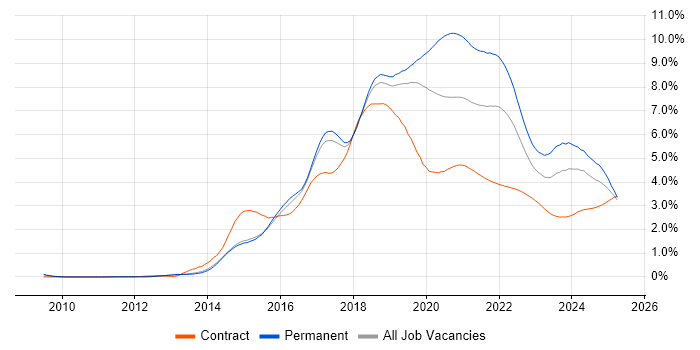
Full Stack Development trend for jobs with a WFH option

Full Stack Development
Daily Rate Trend for Jobs with a WFH Option

3-month moving average daily rate quoted in job vacancies with a work from home option citing Full Stack Development.

Full Stack Development daily rate for jobs with a WFH option

Full Stack Development
Daily Rate Histogram for Jobs with a WFH Option

Daily rate distribution for jobs with a work from home option citing Full Stack Development over the 6 months to 5 May 2024.

Full Stack Development daily rate histogram for jobs with a WFH option

Full Stack Development
Hourly Rate Trend for Jobs with a WFH Option

3-month moving average hourly rate quoted in job vacancies with a work from home option citing Full Stack Development.

Full Stack Development hourly rate for jobs with a WFH option

Full Stack Development
Hourly Rate Histogram for Jobs with a WFH Option

Hourly rate distribution for jobs with a work from home option citing Full Stack Development over the 6 months to 5 May 2024.

Full Stack Development hourly rate histogram for jobs with a WFH option

Full Stack Development
Co-occurring Skills and Capabilities with WFH Options by Category

The follow tables expand on the table above by listing co-occurrences grouped by category. The same employment type, locality and period is covered with up to 20 co-occurrences shown in each of the following categories:

Application Platforms
1 15 (3.68%) nginx
2 14 (3.43%) CMS
3 13 (3.19%) Apache
4 9 (2.21%) WordPress
5 6 (1.47%) Confluence
6 5 (1.23%) Apache Airflow
6 5 (1.23%) Apache Spark
6 5 (1.23%) Umbraco
7 4 (0.98%) Drupal
8 2 (0.49%) ArcGIS
8 2 (0.49%) BizTalk Server
8 2 (0.49%) EPiServer
8 2 (0.49%) GeoServer
8 2 (0.49%) Sitecore CMS
9 1 (0.25%) JBoss
9 1 (0.25%) SharePoint
9 1 (0.25%) Tomcat
9 1 (0.25%) WildFly
Applications
1 1 (0.25%) Microsoft Excel
Business Applications
1 5 (1.23%) Payment Gateway
2 2 (0.49%) Salesforce CRM
Cloud Services
1 164 (40.20%) AWS
2 95 (23.28%) Azure
3 37 (9.07%) Serverless
4 30 (7.35%) Azure DevOps
5 23 (5.64%) GitHub
6 22 (5.39%) GCP
7 21 (5.15%) AWS Lambda
8 18 (4.41%) Azure Functions
9 16 (3.92%) Amazon S3
10 15 (3.68%) AWS Elastic Beanstalk
11 12 (2.94%) Azure Cosmos DB
11 12 (2.94%) Azure Data Factory
11 12 (2.94%) SaaS
12 10 (2.45%) npm
13 9 (2.21%) Azure Service Bus
14 8 (1.96%) AWS CloudFormation
14 8 (1.96%) Azure Monitor
15 7 (1.72%) Amazon EKS
15 7 (1.72%) Entra ID
15 7 (1.72%) OpenShift
Communications & Networking
1 13 (3.19%) VPN
2 10 (2.45%) Firewall
3 4 (0.98%) DNS
4 3 (0.74%) HTTP
5 1 (0.25%) DHCP
5 1 (0.25%) FIX Connectivity
5 1 (0.25%) TCP/IP
5 1 (0.25%) VLAN
Database & Business Intelligence
1 43 (10.54%) PostgreSQL
2 36 (8.82%) SQL Server
3 30 (7.35%) MySQL
4 22 (5.39%) NoSQL
5 21 (5.15%) MongoDB
6 16 (3.92%) Relational Database
7 9 (2.21%) Amazon Aurora
7 9 (2.21%) Redis
8 8 (1.96%) Azure SQL Database
9 7 (1.72%) Elasticsearch
10 5 (1.23%) Apache Ignite
10 5 (1.23%) Flink
10 5 (1.23%) InterSystems Cache
11 4 (0.98%) GIS
11 4 (0.98%) MariaDB
12 3 (0.74%) Amazon QuickSight
12 3 (0.74%) Amazon RDS
12 3 (0.74%) DynamoDB
12 3 (0.74%) Power BI
13 2 (0.49%) Geospatial Data
Development Applications
1 31 (7.60%) Git
2 21 (5.15%) Cypress.io
2 21 (5.15%) JIRA
3 17 (4.17%) GitLab
4 15 (3.68%) webpack
5 14 (3.43%) Jenkins
6 7 (1.72%) CircleCI
6 7 (1.72%) JUnit
7 5 (1.23%) Cucumber
7 5 (1.23%) Mockito
7 5 (1.23%) Postman
8 4 (0.98%) SpecFlow
8 4 (0.98%) Visual Studio
9 3 (0.74%) Selenium
9 3 (0.74%) Snyk
9 3 (0.74%) TeamCity
9 3 (0.74%) Travis CI
10 2 (0.49%) MSTest
10 2 (0.49%) Octopus Deploy
10 2 (0.49%) SonarQube
General
1 77 (18.87%) Finance
2 52 (12.75%) Social Skills
3 36 (8.82%) Public Sector
4 30 (7.35%) Front Office
5 24 (5.88%) Analytical Skills
6 17 (4.17%) Banking
7 10 (2.45%) Financial Institution
8 8 (1.96%) Inclusion and Diversity
8 8 (1.96%) Tech for Good
9 7 (1.72%) Pharmaceutical
10 5 (1.23%) Investment Banking
11 4 (0.98%) Automotive
12 3 (0.74%) Marketing
12 3 (0.74%) Retail Banking
13 2 (0.49%) Health Technology
13 2 (0.49%) Retail
13 2 (0.49%) Telecoms
14 1 (0.25%) Documentation Skills
14 1 (0.25%) Law
14 1 (0.25%) Organisational Skills
Job Titles
1 317 (77.70%) Developer
2 233 (57.11%) Full Stack Developer
3 53 (12.99%) React Developer
4 43 (10.54%) .NET Developer
5 40 (9.80%) C# Developer
6 36 (8.82%) Full Stack Engineer
7 33 (8.09%) Full-Stack C# Developer
7 33 (8.09%) Lead
8 31 (7.60%) Angular Developer
8 31 (7.60%) Senior
9 29 (7.11%) Software Engineer
10 27 (6.62%) Java Developer
11 25 (6.13%) Full Stack .NET Developer
12 19 (4.66%) Senior Developer
13 18 (4.41%) Full Stack Java Developer
14 16 (3.92%) Front-End Developer (Client-Side Developer)
14 16 (3.92%) Lead Developer
15 15 (3.68%) Azure Developer
16 14 (3.43%) Developer/Software Engineer
16 14 (3.43%) JavaScript Developer
Libraries, Frameworks & Software Standards
1 188 (46.08%) React
2 99 (24.26%) .NET
3 93 (22.79%) HTML
4 92 (22.55%) AngularJS
4 92 (22.55%) CSS
5 91 (22.30%) Node.js
6 49 (12.01%) GraphQL
7 39 (9.56%) REST
8 34 (8.33%) Laravel
9 27 (6.62%) Next.js
9 27 (6.62%) Redux
9 27 (6.62%) Vue
10 26 (6.37%) Kafka
11 25 (6.13%) ASP.NET
12 23 (5.64%) Sass
13 22 (5.39%) Spring
14 20 (4.90%) .NET Core
14 20 (4.90%) RESTful
15 18 (4.41%) Spring Boot
16 17 (4.17%) Web Services
Miscellaneous
1 27 (6.62%) Greenfield Project
2 25 (6.13%) Product Ownership
3 15 (3.68%) Fixed Income
4 10 (2.45%) Hedge funds
5 6 (1.47%) Distributed Systems
5 6 (1.47%) Enterprise Software
5 6 (1.47%) Mobile App
6 4 (0.98%) Cloud Native
6 4 (0.98%) Data Structures
6 4 (0.98%) Legacy Systems
7 3 (0.74%) Derivative
7 3 (0.74%) Self-Motivation
8 2 (0.49%) Algorithms
8 2 (0.49%) Distributed Applications
8 2 (0.49%) Marketing Technology
8 2 (0.49%) NHS
8 2 (0.49%) Onboarding
8 2 (0.49%) Renewable Energy
9 1 (0.25%) PKI
9 1 (0.25%) Video on Demand
Operating Systems
1 28 (6.86%) Linux
2 18 (4.41%) Unix
3 4 (0.98%) Android
3 4 (0.98%) Windows
4 3 (0.74%) Apple iOS
5 1 (0.25%) Red Hat Enterprise Linux
5 1 (0.25%) Ubuntu
Processes & Methodologies
1 142 (34.80%) Agile
2 95 (23.28%) CI/CD
3 88 (21.57%) DevOps
4 81 (19.85%) Software Engineering
5 64 (15.69%) Microservices
6 57 (13.97%) Test Automation
7 46 (11.27%) TDD
8 40 (9.80%) Problem-Solving
9 39 (9.56%) User Experience
10 38 (9.31%) Web Development
11 29 (7.11%) MVC
12 27 (6.62%) Front End Development
12 27 (6.62%) Unit Testing
13 26 (6.37%) Scrum
14 25 (6.13%) SDLC
15 22 (5.39%) API Development
15 22 (5.39%) Continuous Improvement
16 21 (5.15%) Design Patterns
17 19 (4.66%) Analytics
18 18 (4.41%) Fintech
Programming Languages
1 186 (45.59%) JavaScript
2 119 (29.17%) TypeScript
3 107 (26.23%) C#
4 99 (24.26%) Java
5 85 (20.83%) Python
6 65 (15.93%) SQL
7 37 (9.07%) PHP
8 16 (3.92%) Go
9 15 (3.68%) Kotlin
10 6 (1.47%) C++
11 5 (1.23%) Bash
12 4 (0.98%) Bicep
12 4 (0.98%) PowerShell
12 4 (0.98%) Ruby
13 3 (0.74%) C
13 3 (0.74%) Scala
13 3 (0.74%) Shell Script
13 3 (0.74%) T-SQL
14 2 (0.49%) F#
14 2 (0.49%) PL/SQL
Qualifications
1 44 (10.78%) Security Cleared
2 36 (8.82%) SC Cleared
3 15 (3.68%) Degree
4 6 (1.47%) BPSS Clearance
5 5 (1.23%) Computer Science Degree
5 5 (1.23%) Master's Degree
6 3 (0.74%) CTC Cleared
6 3 (0.74%) DV Cleared
7 1 (0.25%) Azure Certification
7 1 (0.25%) Microsoft Certification
7 1 (0.25%) SANS
Quality Assurance & Compliance
1 27 (6.62%) Accessibility
2 26 (6.37%) QA
3 3 (0.74%) WCAG
4 2 (0.49%) ISO/IEC 12207
5 1 (0.25%) Data Quality
5 1 (0.25%) Disclosure Scotland
5 1 (0.25%) ISO 20022
5 1 (0.25%) MiFID
5 1 (0.25%) NIST
5 1 (0.25%) Sarbanes-Oxley
5 1 (0.25%) SLA
System Software
1 48 (11.76%) Docker
2 7 (1.72%) Active Directory
3 1 (0.25%) Virtual Machines
Systems Management
1 44 (10.78%) Kubernetes
2 24 (5.88%) Terraform
3 11 (2.70%) Grafana
4 8 (1.96%) Ansible
5 4 (0.98%) Prometheus
6 3 (0.74%) Kibana
7 2 (0.49%) Puppet
8 1 (0.25%) logstash
8 1 (0.25%) Packer
8 1 (0.25%) Progress Chef
Vendors
1 19 (4.66%) Microsoft
2 8 (1.96%) Oracle
3 7 (1.72%) Databricks
4 3 (0.74%) Google
4 3 (0.74%) Optimizely
4 3 (0.74%) WooCommerce
5 2 (0.49%) Confluent
5 2 (0.49%) MuleSoft
5 2 (0.49%) Salesforce
5 2 (0.49%) Sitecore
5 2 (0.49%) Splunk
5 2 (0.49%) Xamarin
6 1 (0.25%) Dynatrace
6 1 (0.25%) HP
6 1 (0.25%) IBM
6 1 (0.25%) NVIDIA
6 1 (0.25%) SAP
6 1 (0.25%) Virgin Media