PL/SQL Contracts with Work from Home Options

PL/SQL (PLSQL)
UK > Work from Home

The table below provides summary statistics for remote or hybrid contract work requiring PL/SQL skills. It includes a benchmarking guide to the contractor rates offered in vacancies that cited PL/SQL over the 6 months leading up to 14 June 2024, comparing them to the same period in the previous two years.

6 months to
14 Jun 2024
Same period 2023 Same period 2022
Rank 175 214 264
Rank change year-on-year +39 +50 -25
Contract jobs citing PL/SQL 179 267 448
As % of all contract jobs with a WFH option 1.21% 1.12% 1.02%
As % of the Programming Languages category 3.52% 3.07% 2.67%
Number of daily rates quoted 145 167 320
10th Percentile £381 - £400
25th Percentile £435 £400 £440
Median daily rate (50th Percentile) £535 £450 £500
Median % change year-on-year +18.89% -10.00% +5.26%
75th Percentile £575 £550 £600
90th Percentile £700 £613 £675
UK median daily rate £512 £500 £500
% change year-on-year +2.37% - +5.26%
Number of hourly rates quoted 0 4 1
Median hourly rate - £80.00 £65.00
Median % change year-on-year - +23.08% +23.81%
UK median hourly rate - £70.00 £65.00
% change year-on-year - +7.69% +26.83%

All Programming Languages
Work from Home

PL/SQL falls under the Programming Languages category. For comparison with the information above, the following table provides summary statistics for all contract job vacancies with remote or hybrid options requiring coding skills.

Contract vacancies with a requirement for coding skills 5,080 8,696 16,767
As % of all contract jobs with a WFH option 34.43% 36.42% 38.23%
Number of daily rates quoted 3,656 6,423 12,512
10th Percentile £356 £381 £381
25th Percentile £425 £450 £450
Median daily rate (50th Percentile) £525 £550 £538
Median % change year-on-year -4.55% +2.33% +7.50%
75th Percentile £650 £672 £638
90th Percentile £800 £775 £738
UK median daily rate £525 £550 £550
% change year-on-year -4.55% - +10.00%
Number of hourly rates quoted 132 187 184
10th Percentile £29.38 £26.96 £20.25
25th Percentile £44.88 £50.00 £35.00
Median hourly rate £55.00 £62.50 £50.00
Median % change year-on-year -12.00% +25.00% +11.11%
75th Percentile £72.50 £70.00 £62.69
90th Percentile £85.00 £85.00 £75.00
UK median hourly rate £62.50 £62.50 £52.25
% change year-on-year - +19.62% +16.76%

PL/SQL
Trend for Jobs with a WFH Option

Job vacancies with a work from home option citing PL/SQL as a proportion of all IT jobs advertised.
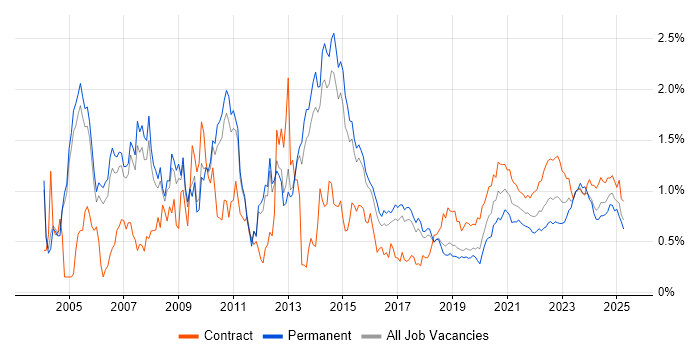
PL/SQL trend for jobs with a WFH option

PL/SQL
Daily Rate Trend for Jobs with a WFH Option

3-month moving average daily rate quoted in job vacancies with a work from home option citing PL/SQL.

PL/SQL daily rate for jobs with a WFH option

PL/SQL
Daily Rate Histogram for Jobs with a WFH Option

Daily rate distribution for jobs with a work from home option citing PL/SQL over the 6 months to 14 June 2024.

PL/SQL daily rate histogram for jobs with a WFH option

PL/SQL
Hourly Rate Trend for Jobs with a WFH Option

3-month moving average hourly rate quoted in job vacancies with a work from home option citing PL/SQL.

PL/SQL hourly rate for jobs with a WFH option

PL/SQL
Co-occurring Skills and Capabilities with WFH Options by Category

The follow tables expand on the table above by listing co-occurrences grouped by category. The same employment type, locality and period is covered with up to 20 co-occurrences shown in each of the following categories:

Application Platforms
1 8 (4.47%) Oracle Workflow
2 5 (2.79%) SAS
3 2 (1.12%) Apache Spark
3 2 (1.12%) BizTalk Server
3 2 (1.12%) Oracle HTTP Server
3 2 (1.12%) WebLogic
4 1 (0.56%) Appian
4 1 (0.56%) Confluence
4 1 (0.56%) IIS
4 1 (0.56%) JBoss
4 1 (0.56%) SharePoint
4 1 (0.56%) WebSphere
Applications
1 6 (3.35%) Microsoft Excel
2 3 (1.68%) Microsoft Office
2 3 (1.68%) MS Visio
Business Applications
1 10 (5.59%) Oracle EBS
2 9 (5.03%) Oracle EBS R12
3 8 (4.47%) Oracle Receivables
4 7 (3.91%) Oracle Financials
4 7 (3.91%) Teamcenter
5 6 (3.35%) Oracle Assets
5 6 (3.35%) Oracle Payables
6 5 (2.79%) Oracle 11i
7 4 (2.23%) NEC Housing
7 4 (2.23%) Oracle Applications
7 4 (2.23%) Oracle General Ledger
8 3 (1.68%) Endur
8 3 (1.68%) Oracle E-Business Tax
8 3 (1.68%) Oracle FAH
8 3 (1.68%) Oracle Procure-to-Pay
9 1 (0.56%) Oracle Cash Management
9 1 (0.56%) Oracle Internet Expenses
9 1 (0.56%) Oracle iProcurement
9 1 (0.56%) Oracle SCM
9 1 (0.56%) Oracle Subledger Accounting
Cloud Services
1 24 (13.41%) AWS
2 16 (8.94%) Azure
3 9 (5.03%) Power Platform
4 4 (2.23%) GitHub
4 4 (2.23%) OCI
4 4 (2.23%) PaaS
4 4 (2.23%) Snowflake
5 3 (1.68%) Azure Cosmos DB
5 3 (1.68%) SaaS
5 3 (1.68%) Veeva
6 2 (1.12%) AWS Lambda
6 2 (1.12%) Azure DevOps
6 2 (1.12%) Azure Functions
6 2 (1.12%) Azure Logic Apps
6 2 (1.12%) Azure Storage
6 2 (1.12%) Collibra
6 2 (1.12%) Dynamics 365
6 2 (1.12%) Serverless
6 2 (1.12%) WhatsApp
7 1 (0.56%) Virtual Private Cloud
Communications & Networking
1 3 (1.68%) PuTTY
2 2 (1.12%) HTTP
3 1 (0.56%) FTP
Database & Business Intelligence
1 49 (27.37%) Oracle Database
2 31 (17.32%) SQL Server
3 19 (10.61%) PostgreSQL
4 16 (8.94%) Oracle Database 11g
5 13 (7.26%) Oracle Reports
6 9 (5.03%) Power BI
7 6 (3.35%) Data Warehouse
7 6 (3.35%) Metadata
7 6 (3.35%) Oracle ODI
7 6 (3.35%) Tableau
8 5 (2.79%) Oracle Database 12c
9 4 (2.23%) Azure SQL Database
9 4 (2.23%) Oracle BI Publisher
10 3 (1.68%) Crystal Reports
10 3 (1.68%) Hadoop
10 3 (1.68%) MongoDB
10 3 (1.68%) Oracle Discoverer
10 3 (1.68%) Relational Database
10 3 (1.68%) SQL Server Reporting Services
10 3 (1.68%) SQLPlus
Development Applications
1 31 (17.32%) PVCS
1 31 (17.32%) Visual Studio
2 19 (10.61%) Oracle APEX
3 10 (5.59%) Oracle Forms
4 8 (4.47%) JIRA
5 3 (1.68%) GitLab
5 3 (1.68%) Team Foundation Server
5 3 (1.68%) Toad
6 2 (1.12%) Ant
7 1 (0.56%) Bitbucket
7 1 (0.56%) Jenkins
General
1 34 (18.99%) Finance
2 28 (15.64%) Social Skills
3 20 (11.17%) Public Sector
4 19 (10.61%) Analytical Skills
5 14 (7.82%) Banking
6 10 (5.59%) Presentation Skills
7 5 (2.79%) Organisational Skills
8 4 (2.23%) Retail
9 2 (1.12%) Local Government
9 2 (1.12%) Manufacturing
10 1 (0.56%) Billing
10 1 (0.56%) Corporate Banking
10 1 (0.56%) Front Office
10 1 (0.56%) General Ledger
10 1 (0.56%) Investment Banking
10 1 (0.56%) Italian Language
10 1 (0.56%) Pharmaceutical
10 1 (0.56%) Retail Banking
Job Titles
1 83 (46.37%) Developer
2 30 (16.76%) C Programmer
2 30 (16.76%) Oracle Developer
2 30 (16.76%) Programmer
2 30 (16.76%) SQL Developer
3 21 (11.73%) PL/SQL Developer
4 12 (6.70%) Architect
5 11 (6.15%) PostgreSQL Developer
6 10 (5.59%) Consultant
7 8 (4.47%) Analyst
8 7 (3.91%) Java Developer
8 7 (3.91%) Oracle Architect
8 7 (3.91%) Oracle Consultant
9 6 (3.35%) Administrator
9 6 (3.35%) DBA
9 6 (3.35%) Senior
9 6 (3.35%) Solutions Architect
10 4 (2.23%) Oracle Solutions Architect
10 4 (2.23%) Senior Developer
10 4 (2.23%) Storage Solutions Architect
Libraries, Frameworks & Software Standards
1 8 (4.47%) .NET
2 6 (3.35%) XML
3 4 (2.23%) Blazor
4 3 (1.68%) Oracle Fusion
4 3 (1.68%) RabbitMQ
4 3 (1.68%) REST
4 3 (1.68%) Spring Boot
5 2 (1.12%) .NET Core
5 2 (1.12%) Hibernate
5 2 (1.12%) HTML
5 2 (1.12%) JPA
5 2 (1.12%) Kafka
5 2 (1.12%) Web Services
6 1 (0.56%) AngularJS
6 1 (0.56%) CSS
6 1 (0.56%) JMS
6 1 (0.56%) Middleware
6 1 (0.56%) Sass
6 1 (0.56%) SOAP
6 1 (0.56%) WebSphere MQ
Miscellaneous
1 9 (5.03%) Replication
2 7 (3.91%) Blog
3 5 (2.79%) Management Information System
3 5 (2.79%) Virtual Team
4 4 (2.23%) Housing Association
5 3 (1.68%) Online Banking
6 2 (1.12%) Cloud Native
6 2 (1.12%) Clustering
6 2 (1.12%) Legacy Systems
6 2 (1.12%) Onboarding
6 2 (1.12%) Product Ownership
6 2 (1.12%) Self-Motivation
7 1 (0.56%) Enterprise Software
7 1 (0.56%) FMCG
Operating Systems
1 20 (11.17%) Unix
2 5 (2.79%) Windows
3 4 (2.23%) Linux
4 1 (0.56%) Windows Server
Processes & Methodologies
1 45 (25.14%) Agile
2 35 (19.55%) Problem-Solving
3 25 (13.97%) Migration
3 25 (13.97%) Performance Tuning
4 24 (13.41%) Unit Testing
5 23 (12.85%) DevOps
6 20 (11.17%) Software Engineering
7 19 (10.61%) Business Intelligence
8 18 (10.06%) Data Migration
9 16 (8.94%) Software Testing
10 15 (8.38%) Data Modelling
11 13 (7.26%) Clean Code
12 12 (6.70%) Computer Science
12 12 (6.70%) ETL
13 11 (6.15%) Architectural Design
13 11 (6.15%) Secure Coding
14 10 (5.59%) Analytics
14 10 (5.59%) High Availability
15 9 (5.03%) Data Management
15 9 (5.03%) User Acceptance Testing
Programming Languages
1 148 (82.68%) SQL
2 32 (17.88%) C
3 19 (10.61%) Java
4 12 (6.70%) JavaScript
5 10 (5.59%) T-SQL
6 9 (5.03%) C#
6 9 (5.03%) C++
7 8 (4.47%) Python
8 6 (3.35%) VB
9 5 (2.79%) R
10 4 (2.23%) Bash
10 4 (2.23%) Bourne shell
10 4 (2.23%) Korn
10 4 (2.23%) VB.NET
11 3 (1.68%) Groovy
11 3 (1.68%) Shell Script
12 2 (1.12%) Go
13 1 (0.56%) HiveQL
13 1 (0.56%) PowerShell
13 1 (0.56%) VBA
Qualifications
1 63 (35.20%) Security Cleared
2 60 (33.52%) SC Cleared
3 18 (10.06%) Degree
4 9 (5.03%) Computer Science Degree
5 6 (3.35%) BPSS Clearance
6 3 (1.68%) SAP Certification
7 2 (1.12%) Master's Degree
8 1 (0.56%) OCP
8 1 (0.56%) Oracle Certification
8 1 (0.56%) Tableau Certification
Quality Assurance & Compliance
1 3 (1.68%) CDISC
1 3 (1.68%) Data Quality
1 3 (1.68%) Good Clinical Practice
1 3 (1.68%) GxP
1 3 (1.68%) QA
2 1 (0.56%) California Consumer Privacy Act
2 1 (0.56%) GDPR
2 1 (0.56%) HIPAA
2 1 (0.56%) IFRS
2 1 (0.56%) IFRS 17
2 1 (0.56%) SLA
System Software
1 7 (3.91%) Active Directory
2 1 (0.56%) HDFS
2 1 (0.56%) Oracle RAC
Systems Management
1 3 (1.68%) Ansible
1 3 (1.68%) Data Guard
2 2 (1.12%) Kubernetes
2 2 (1.12%) Oracle Flashback
2 2 (1.12%) Oracle RMAN
3 1 (0.56%) Control-M
Vendors
1 110 (61.45%) Oracle
2 12 (6.70%) Microsoft
3 9 (5.03%) Avaloq
4 7 (3.91%) SAP
5 5 (2.79%) Sparx
6 4 (2.23%) NEC
7 3 (1.68%) Cloudera
7 3 (1.68%) Microgen
7 3 (1.68%) OpenLink
7 3 (1.68%) Red Hat
7 3 (1.68%) ServiceNow
8 2 (1.12%) Databricks
8 2 (1.12%) MuleSoft
8 2 (1.12%) Northgate
8 2 (1.12%) Talend
9 1 (0.56%) BMC
9 1 (0.56%) Citrix
9 1 (0.56%) IBM
9 1 (0.56%) Informatica
9 1 (0.56%) JDA