SAP ERP Jobs in England

SAP Enterprise Resource Planning (ERP)
UK > England

The following table provides summary statistics for permanent job vacancies advertised in England with a requirement for SAP ERP skills. Included is a benchmarking guide to the salaries offered in vacancies that have cited SAP ERP over the 6 months to 5 May 2024 with a comparison to the same period in the previous 2 years.

6 months to
5 May 2024
Same period 2023 Same period 2022
Rank 497 845 1069
Rank change year-on-year +348 +224 -284
Permanent jobs citing SAP ERP 375 102 78
As % of all permanent jobs advertised in England 0.44% 0.11% 0.059%
As % of the Business Applications category 9.37% 1.90% 1.49%
Number of salaries quoted 43 84 44
10th Percentile £41,519 £42,500 £40,750
25th Percentile £52,500 £62,500 £55,000
Median annual salary (50th Percentile) £62,500 £65,000 £65,000
Median % change year-on-year -3.85% - -
75th Percentile £78,750 £73,750 £90,625
90th Percentile £94,500 £80,000 £96,250
UK median annual salary £63,750 £65,000 £65,000
% change year-on-year -1.92% - -

All Business Application Skills
England

SAP ERP is in the Business Applications category. The following table is for comparison with the above and provides summary statistics for all permanent job vacancies advertised in England with a requirement for business application skills.

Permanent vacancies with a requirement for business application skills 4,003 5,380 5,220
As % of all permanent jobs advertised in England 4.70% 5.84% 3.94%
Number of salaries quoted 2,670 3,106 3,422
10th Percentile £31,250 £39,000 £35,125
25th Percentile £41,535 £47,500 £42,500
Median annual salary (50th Percentile) £55,000 £60,000 £57,500
Median % change year-on-year -8.33% +4.35% +4.55%
75th Percentile £75,000 £77,500 £78,750
90th Percentile £92,500 £95,000 £97,500
UK median annual salary £56,500 £60,000 £57,500
% change year-on-year -5.83% +4.35% +4.55%

SAP ERP
Job Vacancy Trend in England

Job postings citing SAP ERP as a proportion of all IT jobs advertised in England.
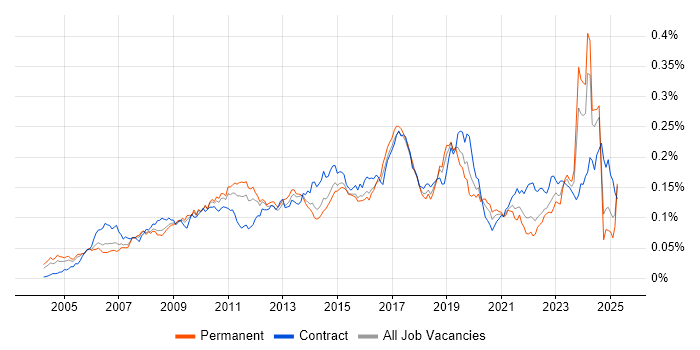
Job vacancy trend for SAP ERP in England

SAP ERP
Salary Trend in England

3-month moving average salary quoted in jobs citing SAP ERP in England.

Salary trend for SAP ERP in England

SAP ERP
Salary Histogram in England

Salary distribution for jobs citing SAP ERP in England over the 6 months to 5 May 2024.

Salary histogram for SAP ERP in England

SAP ERP
Job Locations in England

The table below looks at the demand and provides a guide to the median salaries quoted in IT jobs citing SAP ERP within the England region over the 6 months to 5 May 2024. The 'Rank Change' column provides an indication of the change in demand within each location based on the same 6 month period last year.

Location Rank Change
on Same Period
Last Year
Matching
Permanent
IT Job Ads
Median Salary
Past 6 Months
Median Salary
% Change
on Same Period
Last Year
Live
Jobs
London +322 232 £80,000 +14.29% 13
South East +59 79 £67,500 +3.85% 4
North of England +64 27 £62,500 +8.70% 8
Yorkshire +96 13 £62,500 +16.28% 2
North West +19 12 £110,000 +91.30% 6
Midlands +12 12 £52,500 +16.67% 2
East of England +25 9 £67,500 +17.39% 4
West Midlands +26 8 £52,500 -19.23%
East Midlands -22 4 £39,969 -11.18% 2
North East - 2 £61,250 -
South West -26 1 £33,500 -48.46%
SAP ERP
UK

SAP ERP
Co-occurring Skills and Capabilities in England by Category

The follow tables expand on the table above by listing co-occurrences grouped by category. The same employment type, locality and period is covered with up to 20 co-occurrences shown in each of the following categories:

Application Platforms
1 299 (79.73%) SAS
2 2 (0.53%) NetWeaver
3 1 (0.27%) Confluence
3 1 (0.27%) SharePoint
Applications
1 1 (0.27%) Microsoft Office
1 1 (0.27%) Microsoft Project
Business Applications
1 29 (7.73%) SAP S/4HANA
2 7 (1.87%) SAP HR
3 6 (1.60%) SAP CO
3 6 (1.60%) SAP FI
3 6 (1.60%) SAP FI/CO
4 5 (1.33%) SAP CX
5 4 (1.07%) SAP Payroll
6 3 (0.80%) Dynamics CRM
6 3 (0.80%) Salesforce CRM
7 2 (0.53%) Maximo
7 2 (0.53%) SAP EWM
7 2 (0.53%) SAP HCM
7 2 (0.53%) SAP MM
7 2 (0.53%) SAP SCM
7 2 (0.53%) SAP SD
7 2 (0.53%) SAP WM
8 1 (0.27%) Dynamics NAV
8 1 (0.27%) SAP IBP
Cloud Services
1 7 (1.87%) Microsoft 365
1 7 (1.87%) SaaS
1 7 (1.87%) WhatsApp
2 5 (1.33%) SAP Commerce Cloud
3 4 (1.07%) Azure
4 3 (0.80%) Azure API Management
4 3 (0.80%) Dynamics 365
5 1 (0.27%) Adobe Creative Cloud
5 1 (0.27%) AWS
5 1 (0.27%) Entra ID
5 1 (0.27%) Power Platform
5 1 (0.27%) SuccessFactors
Communications & Networking
1 299 (79.73%) Broadband
2 1 (0.27%) DHCP
2 1 (0.27%) DNS
2 1 (0.27%) VLAN
2 1 (0.27%) VoIP
Database & Business Intelligence
1 7 (1.87%) SAP HANA
2 6 (1.60%) SQL Server
3 5 (1.33%) Crystal Reports
3 5 (1.33%) MaxDB
4 3 (0.80%) GIS
5 1 (0.27%) Power BI
5 1 (0.27%) SAP BW
5 1 (0.27%) SAP Data Services
Development Applications
1 5 (1.33%) JIRA
1 5 (1.33%) Visual Studio
2 1 (0.27%) Atlassian Bamboo
2 1 (0.27%) Bitbucket
2 1 (0.27%) Jenkins
General
1 335 (89.33%) Social Skills
2 320 (85.33%) Finance
3 15 (4.00%) Analytical Skills
4 8 (2.13%) Manufacturing
5 7 (1.87%) Law
5 7 (1.87%) Retail
6 5 (1.33%) French Language
6 5 (1.33%) German Language
6 5 (1.33%) Legal
7 3 (0.80%) Marketing
8 2 (0.53%) Documentation Skills
8 2 (0.53%) Presentation Skills
9 1 (0.27%) Pharmaceutical
Job Titles
1 318 (84.80%) Architect
2 307 (81.87%) Solutions Architect
3 11 (2.93%) SAP Manager
4 9 (2.40%) SAP Architect
5 8 (2.13%) Analyst
6 7 (1.87%) Project Manager
6 7 (1.87%) SAP Analyst
7 6 (1.60%) Developer
7 6 (1.60%) ERP Manager
7 6 (1.60%) SAP Solutions Architect
7 6 (1.60%) Senior
8 5 (1.33%) .NET Developer
8 5 (1.33%) Business Architect
8 5 (1.33%) Lead
8 5 (1.33%) SAP Delivery Manager
8 5 (1.33%) SAP MM Analyst
8 5 (1.33%) SAP PP Analyst
8 5 (1.33%) Service Delivery Manager
8 5 (1.33%) Service Manager
8 5 (1.33%) Systems Architect
Libraries, Frameworks & Software Standards
1 7 (1.87%) SAP Basis
2 6 (1.60%) EDI
2 6 (1.60%) SAP Fiori
3 5 (1.33%) .NET
3 5 (1.33%) ASP.NET
3 5 (1.33%) BREW
3 5 (1.33%) XML
4 1 (0.27%) BAPI
4 1 (0.27%) IDoc
4 1 (0.27%) J2EE
4 1 (0.27%) JDBC
4 1 (0.27%) Middleware
4 1 (0.27%) REST
4 1 (0.27%) SAP PI
4 1 (0.27%) SOAP
4 1 (0.27%) WinForms
Miscellaneous
1 9 (2.40%) Product Ownership
2 7 (1.87%) Onboarding
3 6 (1.60%) Self-Motivation
4 5 (1.33%) Mobile App
5 4 (1.07%) Life Science
5 4 (1.07%) Renewable Energy
6 3 (0.80%) Management Information System
7 1 (0.27%) PMI
7 1 (0.27%) Virtual Team
Operating Systems
1 10 (2.67%) Windows
2 5 (1.33%) Linux
3 1 (0.27%) Windows 10
3 1 (0.27%) Windows 7
3 1 (0.27%) Windows Server
3 1 (0.27%) Windows XP
Processes & Methodologies
1 375 (100.00%) ERP
2 324 (86.40%) Roadmaps
3 309 (82.40%) Agile
4 307 (81.87%) Change Management
5 306 (81.60%) Strategic Roadmap
6 301 (80.27%) Enterprise Architecture
6 301 (80.27%) TOGAF
7 299 (79.73%) Data Management
7 299 (79.73%) Performance Management
8 20 (5.33%) Problem-Solving
9 18 (4.80%) Project Management
10 13 (3.47%) Continuous Improvement
11 11 (2.93%) Customer Experience
12 10 (2.67%) Computer Science
13 8 (2.13%) Collaborative Working
13 8 (2.13%) Service Delivery
14 7 (1.87%) CRM
14 7 (1.87%) Decision-Making
14 7 (1.87%) Migration
14 7 (1.87%) Project Delivery
Programming Languages
1 8 (2.13%) ABAP
2 7 (1.87%) Java
3 6 (1.60%) SQL
4 5 (1.33%) C#
5 1 (0.27%) JavaScript
5 1 (0.27%) PowerShell
5 1 (0.27%) Python
Qualifications
1 32 (8.53%) Degree
2 6 (1.60%) SAP Certification
2 6 (1.60%) SC Cleared
2 6 (1.60%) Security Cleared
3 3 (0.80%) Computer Science Degree
4 2 (0.53%) PMP
5 1 (0.27%) APMP
5 1 (0.27%) BPSS Clearance
5 1 (0.27%) PMI Certification
Quality Assurance & Compliance
1 5 (1.33%) QA
2 1 (0.27%) PMO
System Software
1 7 (1.87%) Active Directory
2 1 (0.27%) VMware Infrastructure
Systems Management
1 1 (0.27%) WSUS
Vendors
1 375 (100.00%) SAP
2 303 (80.80%) Oracle
3 300 (80.00%) Hyperion
4 299 (79.73%) Anaplan
5 7 (1.87%) Microsoft
6 5 (1.33%) Sybase
6 5 (1.33%) SYSPRO
6 5 (1.33%) Xamarin
7 4 (1.07%) Salesforce
8 3 (0.80%) QAD
8 3 (0.80%) Workday
9 2 (0.53%) Sage
10 1 (0.27%) Adobe
10 1 (0.27%) Ariba
10 1 (0.27%) Cisco
10 1 (0.27%) Dell
10 1 (0.27%) Tagetik
10 1 (0.27%) UiPath
10 1 (0.27%) VMware
10 1 (0.27%) webMethods