SAP S/4HANA
UK > England
The table below provides summary statistics for permanent job vacancies advertised in England requiring SAP S/4HANA skills. It includes a benchmarking guide to the annual salaries offered in vacancies that cited SAP S/4HANA over the 6 months leading up to 31 May 2025, comparing them to the same period in the previous two years.
| 6 months to 31 May 2025 |
Same period 2024 | Same period 2023 | |
|---|---|---|---|
| Rank | 465 | 562 | 352 |
| Rank change year-on-year | +97 | -210 | +464 |
| Permanent jobs citing SAP S/4HANA | 220 | 304 | 789 |
| As % of all permanent jobs advertised in England | 0.45% | 0.34% | 0.93% |
| As % of the Business Applications category | 8.98% | 7.53% | 15.05% |
| Number of salaries quoted | 132 | 170 | 232 |
| 10th Percentile | £42,550 | £52,500 | £50,125 |
| 25th Percentile | £55,000 | £55,000 | £57,500 |
| Median annual salary (50th Percentile) | £67,500 | £77,500 | £65,000 |
| Median % change year-on-year | -12.90% | +19.23% | -3.70% |
| 75th Percentile | £84,625 | £95,000 | £83,750 |
| 90th Percentile | £108,750 | £110,000 | £107,500 |
| UK median annual salary | £68,750 | £77,500 | £67,500 |
| % change year-on-year | -11.29% | +14.81% | - |
All Business Application Skills
England
SAP S/4HANA falls under the Business Applications category. For comparison with the information above, the following table provides summary statistics for all permanent job vacancies requiring business application skills in England.
| Permanent vacancies with a requirement for business application skills | 2,450 | 4,038 | 5,243 |
| As % of all permanent jobs advertised in England | 4.97% | 4.50% | 6.16% |
| Number of salaries quoted | 1,672 | 2,684 | 3,051 |
| 10th Percentile | £32,500 | £31,250 | £40,000 |
| 25th Percentile | £40,000 | £41,750 | £47,500 |
| Median annual salary (50th Percentile) | £55,000 | £55,000 | £60,000 |
| Median % change year-on-year | - | -8.33% | +2.56% |
| 75th Percentile | £75,000 | £75,000 | £75,000 |
| 90th Percentile | £102,500 | £92,500 | £95,000 |
| UK median annual salary | £55,000 | £56,500 | £60,000 |
| % change year-on-year | -2.65% | -5.83% | +4.35% |
SAP S/4HANA
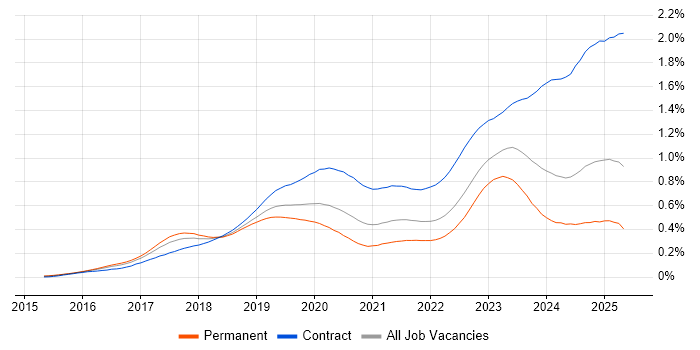
Job Vacancy Trend in England
Job postings citing SAP S/4HANA as a proportion of all IT jobs advertised in England.

SAP S/4HANA
Salary Trend in England
3-month moving average salary quoted in jobs citing SAP S/4HANA in England.
SAP S/4HANA
Salary Histogram in England
Salary distribution for jobs citing SAP S/4HANA in England over the 6 months to 31 May 2025.
SAP S/4HANA
Job Locations in England
The table below looks at the demand and provides a guide to the median salaries quoted in IT jobs citing SAP S/4HANA within the England region over the 6 months to 31 May 2025. The 'Rank Change' column provides an indication of the change in demand within each location based on the same 6 month period last year.
| Location | Rank Change on Same Period Last Year |
Matching Permanent IT Job Ads |
Median Salary Past 6 Months |
Median Salary % Change on Same Period Last Year |
Live Jobs |
|---|---|---|---|---|---|
| North of England | +32 | 65 | £55,000 | -15.38% | 36 |
| North West | +15 | 57 | £55,000 | -38.89% | 29 |
| London | +39 | 53 | £86,250 | -4.17% | 126 |
| Midlands | +75 | 50 | £72,500 | +3.57% | 40 |
| West Midlands | +65 | 37 | £72,500 | - | 30 |
| South East | +56 | 28 | £60,000 | - | 53 |
| East Midlands | +43 | 11 | £68,750 | +17.52% | 10 |
| Yorkshire | +41 | 8 | £42,000 | -23.64% | 3 |
| South West | - | 5 | £72,500 | - | 17 |
| East of England | +44 | 4 | £65,000 | -7.14% | 13 |
| SAP S/4HANA UK |
|||||
SAP S/4HANA
Co-occurring Skills and Capabilities in England by Category
The follow tables expand on the table above by listing co-occurrences grouped by category. The same employment type, locality and period is covered with up to 20 co-occurrences shown in each of the following categories:
|
|
||||||||||||||||||||||||||||||||||||||||||||||||||||||||||||||||||||||||||||||||||||||||||||||||||||||||||||||||||||||||||||||
|
|
||||||||||||||||||||||||||||||||||||||||||||||||||||||||||||||||||||||||||||||||||||||||||||||||||||||||||||||||||||||||||||||
|
|
||||||||||||||||||||||||||||||||||||||||||||||||||||||||||||||||||||||||||||||||||||||||||||||||||||||||||||||||||||||||||||||
|
|
||||||||||||||||||||||||||||||||||||||||||||||||||||||||||||||||||||||||||||||||||||||||||||||||||||||||||||||||||||||||||||||
|
|
||||||||||||||||||||||||||||||||||||||||||||||||||||||||||||||||||||||||||||||||||||||||||||||||||||||||||||||||||||||||||||||
|
|
||||||||||||||||||||||||||||||||||||||||||||||||||||||||||||||||||||||||||||||||||||||||||||||||||||||||||||||||||||||||||||||
|
|
||||||||||||||||||||||||||||||||||||||||||||||||||||||||||||||||||||||||||||||||||||||||||||||||||||||||||||||||||||||||||||||
|
|
||||||||||||||||||||||||||||||||||||||||||||||||||||||||||||||||||||||||||||||||||||||||||||||||||||||||||||||||||||||||||||||
|
|
||||||||||||||||||||||||||||||||||||||||||||||||||||||||||||||||||||||||||||||||||||||||||||||||||||||||||||||||||||||||||||||
|
|||||||||||||||||||||||||||||||||||||||||||||||||||||||||||||||||||||||||||||||||||||||||||||||||||||||||||||||||||||||||||||||
