VMS Jobs in London

VMS
England > London

The table below provides summary statistics for permanent job vacancies advertised in London requiring VMS skills. It includes a benchmarking guide to the annual salaries offered in vacancies that cited VMS over the 6 months leading up to 14 May 2025, comparing them to the same period in the previous two years.

6 months to
14 May 2025
Same period 2024 Same period 2023
Rank 390 450 546
Rank change year-on-year +60 +96 +209
Permanent jobs citing VMS 13 67 83
As % of all permanent jobs advertised in London 0.10% 0.28% 0.24%
As % of the Operating Systems category 0.72% 2.20% 1.53%
Number of salaries quoted 11 29 40
10th Percentile £65,000 £51,000 -
25th Percentile £67,500 £53,750 £31,250
Median annual salary (50th Percentile) £87,500 £57,500 £37,500
Median % change year-on-year +52.17% +53.33% -53.13%
75th Percentile £89,375 £101,250 £67,500
90th Percentile £91,250 £167,500 £85,875
England median annual salary £60,000 £57,500 £47,500
% change year-on-year +4.35% +21.05% -31.65%

All Operating Systems
London

VMS falls under the Operating Systems category. For comparison with the information above, the following table provides summary statistics for all permanent job vacancies requiring operating system skills in London.

Permanent vacancies with a requirement for operating system skills 1,804 3,047 5,412
As % of all permanent jobs advertised in London 13.95% 12.92% 15.77%
Number of salaries quoted 1,219 2,310 4,142
10th Percentile £33,250 £31,250 £32,500
25th Percentile £42,500 £41,250 £45,000
Median annual salary (50th Percentile) £65,000 £62,500 £65,000
Median % change year-on-year +4.00% -3.85% -
75th Percentile £87,500 £82,500 £90,000
90th Percentile £111,250 £102,500 £111,250
England median annual salary £45,000 £45,000 £52,500
% change year-on-year - -14.29% -

VMS
Job Vacancy Trend in London

Job postings citing VMS as a proportion of all IT jobs advertised in London.
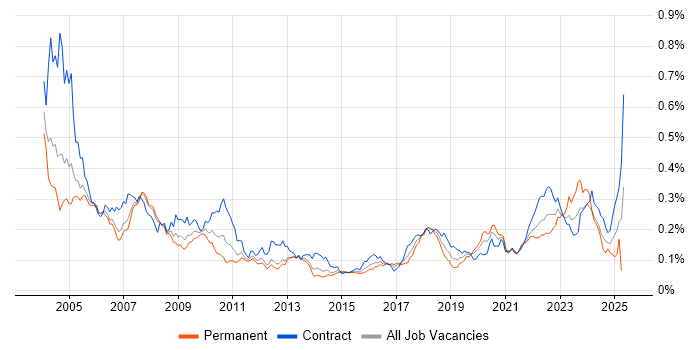
Job vacancy trend for VMS in London

VMS
Salary Trend in London

3-month moving average salary quoted in jobs citing VMS in London.

Salary trend for VMS in London

VMS
Salary Histogram in London

Salary distribution for jobs citing VMS in London over the 6 months to 14 May 2025.

Salary histogram for VMS in London

VMS
Co-occurring Skills and Capabilities in London by Category

The follow tables expand on the table above by listing co-occurrences grouped by category. The same employment type, locality and period is covered with up to 20 co-occurrences shown in each of the following categories:

Application Platforms
1 3 (23.08%) Apache Airflow
2 1 (7.69%) Confluence
Cloud Services
1 12 (92.31%) Azure
2 5 (38.46%) Entra ID
3 4 (30.77%) Azure AKS
3 4 (30.77%) GitHub
3 4 (30.77%) GitHub Actions
3 4 (30.77%) Microsoft 365
4 3 (23.08%) AWS
4 3 (23.08%) GCP
5 2 (15.38%) Azure Machine Learning
5 2 (15.38%) Cloud Computing
5 2 (15.38%) Google Workspace
5 2 (15.38%) SaaS
5 2 (15.38%) Slack
6 1 (7.69%) Azure DevOps
6 1 (7.69%) Azure ExpressRoute
6 1 (7.69%) Azure Functions
6 1 (7.69%) Azure Key Vault
6 1 (7.69%) Azure Monitor
6 1 (7.69%) PaaS
6 1 (7.69%) Serverless
Communications & Networking
1 6 (46.15%) Network Security
2 3 (23.08%) Firewall
2 3 (23.08%) VPN
3 2 (15.38%) 4G
3 2 (15.38%) Internet
3 2 (15.38%) LAN
3 2 (15.38%) OpenVPN
3 2 (15.38%) WAN
Development Applications
1 3 (23.08%) JIRA
2 2 (15.38%) Artifactory
2 2 (15.38%) Git
3 1 (7.69%) Octopus Deploy
General
1 5 (38.46%) Finance
2 1 (7.69%) Analytical Skills
2 1 (7.69%) Front Office
2 1 (7.69%) Legal
Job Titles
1 4 (30.77%) Azure Engineer
1 4 (30.77%) DevOps Engineer
1 4 (30.77%) Infrastructure Engineer
1 4 (30.77%) Senior
2 3 (23.08%) Azure DevOps Engineer
2 3 (23.08%) Machine Learning Engineer
2 3 (23.08%) Security Engineer
3 2 (15.38%) Lead
3 2 (15.38%) Senior Infrastructure Engineer
4 1 (7.69%) Azure Platform Engineer
4 1 (7.69%) Cloud Platform Engineer
4 1 (7.69%) Platform Engineer
4 1 (7.69%) Vendor Manager
Libraries, Frameworks & Software Standards
1 3 (23.08%) Azure Blueprints
1 3 (23.08%) Pandas
1 3 (23.08%) scikit-learn
2 2 (15.38%) Anaconda
Miscellaneous
1 3 (23.08%) Linux Command Line
1 3 (23.08%) Management Information System
1 3 (23.08%) Security Posture
2 2 (15.38%) Security Operations Centre
Operating Systems
1 7 (53.85%) Windows
2 6 (46.15%) Linux
3 2 (15.38%) Mac OS
3 2 (15.38%) Windows Server
4 1 (7.69%) Red Hat Enterprise Linux
Processes & Methodologies
1 8 (61.54%) DevOps
2 5 (38.46%) CI/CD
2 5 (38.46%) Continuous Improvement
2 5 (38.46%) Incident Response
3 4 (30.77%) Cloud Security
3 4 (30.77%) Infrastructure as Code
3 4 (30.77%) Infrastructure Engineering
3 4 (30.77%) Network Monitoring
4 3 (23.08%) Computer Science
4 3 (23.08%) Data Science
4 3 (23.08%) Forensic Analysis
4 3 (23.08%) Identity Access Management
4 3 (23.08%) Machine Learning
4 3 (23.08%) Penetration Testing
4 3 (23.08%) Security Architecture
4 3 (23.08%) Software Engineering
4 3 (23.08%) Threat and Vulnerability Management
4 3 (23.08%) Threat Detection
4 3 (23.08%) Vulnerability Management
4 3 (23.08%) Vulnerability Scanning
Programming Languages
1 8 (61.54%) Bash
1 8 (61.54%) PowerShell
2 6 (46.15%) Python
3 3 (23.08%) SQL
4 2 (15.38%) Shell Script
Qualifications
1 5 (38.46%) Cisco Certification
2 4 (30.77%) Degree
3 3 (23.08%) (ISC)2 CCSP
3 3 (23.08%) AWS Certification
3 3 (23.08%) CCSP
3 3 (23.08%) CISSP
3 3 (23.08%) Computer Science Degree
4 2 (15.38%) CCNA
Quality Assurance & Compliance
1 5 (38.46%) GDPR
2 3 (23.08%) NIST
2 3 (23.08%) PCI DSS
2 3 (23.08%) Sarbanes-Oxley
3 1 (7.69%) PSD2
System Software
1 7 (53.85%) Active Directory
1 7 (53.85%) Virtual Machines
2 3 (23.08%) Docker
2 3 (23.08%) VMware Infrastructure
3 2 (15.38%) vSphere
4 1 (7.69%) Virtual Desktop
Systems Management
1 8 (61.54%) Kubernetes
2 7 (53.85%) Terraform
3 4 (30.77%) Microsoft Intune
4 3 (23.08%) CASB
4 3 (23.08%) Istio
4 3 (23.08%) linkerd
4 3 (23.08%) Packer
5 2 (15.38%) Jamf Pro
5 2 (15.38%) Single Sign-On
Vendors
1 7 (53.85%) Microsoft
2 5 (38.46%) Google
3 3 (23.08%) VMware
4 2 (15.38%) Cisco
4 2 (15.38%) Meraki
5 1 (7.69%) Citrix
5 1 (7.69%) Palo Alto
5 1 (7.69%) Red Hat