Single Sign-On Jobs in London

Single Sign-On (SSO)
England > London

The table below provides summary statistics for permanent job vacancies advertised in London requiring Single Sign-On skills. It includes a benchmarking guide to the annual salaries offered in vacancies that cited Single Sign-On over the 6 months leading up to 31 May 2025, comparing them to the same period in the previous two years.

6 months to
31 May 2025
Same period 2024 Same period 2023
Rank 323 382 452
Rank change year-on-year +59 +70 +225
Permanent jobs citing Single Sign-On 73 119 161
As % of all permanent jobs advertised in London 0.57% 0.50% 0.50%
As % of the Systems Management category 3.67% 3.76% 2.90%
Number of salaries quoted 67 97 78
10th Percentile £57,500 £47,500 £51,750
25th Percentile £63,125 £54,570 £57,625
Median annual salary (50th Percentile) £77,500 £72,500 £79,632
Median % change year-on-year +6.90% -8.96% +13.76%
75th Percentile £90,000 £87,500 £94,876
90th Percentile £97,500 £91,500 £101,500
England median annual salary £77,500 £65,000 £60,000
% change year-on-year +19.23% +8.33% -7.69%

All Systems Management Skills
London

Single Sign-On falls under the Systems Management category. For comparison with the information above, the following table provides summary statistics for all permanent job vacancies requiring systems management skills in London.

Permanent vacancies with a requirement for systems management skills 1,991 3,169 5,551
As % of all permanent jobs advertised in London 15.58% 13.19% 17.25%
Number of salaries quoted 1,389 2,437 3,939
10th Percentile £42,450 £45,000 £44,441
25th Percentile £60,000 £60,750 £57,500
Median annual salary (50th Percentile) £80,000 £80,000 £77,500
Median % change year-on-year - +3.23% -3.13%
75th Percentile £100,000 £97,500 £97,500
90th Percentile £118,750 £117,500 £117,500
England median annual salary £69,384 £62,500 £67,500
% change year-on-year +11.01% -7.41% -3.57%

Single Sign-On
Job Vacancy Trend in London

Job postings citing Single Sign-On as a proportion of all IT jobs advertised in London.
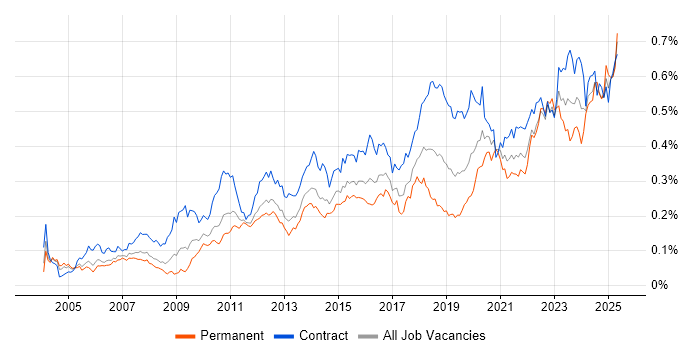
Job vacancy trend for Single Sign-On in London

Single Sign-On
Salary Trend in London

3-month moving average salary quoted in jobs citing Single Sign-On in London.

Salary trend for Single Sign-On in London

Single Sign-On
Salary Histogram in London

Salary distribution for jobs citing Single Sign-On in London over the 6 months to 31 May 2025.

Salary histogram for Single Sign-On in London

Single Sign-On
Job Locations in London

The table below looks at the demand and provides a guide to the median salaries quoted in IT jobs citing Single Sign-On within the London region over the 6 months to 31 May 2025. The 'Rank Change' column provides an indication of the change in demand within each location based on the same 6 month period last year.

Location Rank Change
on Same Period
Last Year
Matching
Permanent
IT Job Ads
Median Salary
Past 6 Months
Median Salary
% Change
on Same Period
Last Year
Live
Jobs
Central London +27 30 £77,500 -8.82% 8
East London - 1 - - 1
West London - 1 £41,975 - 1
Single Sign-On
England

Single Sign-On
Co-occurring Skills and Capabilities in London by Category

The follow tables expand on the table above by listing co-occurrences grouped by category. The same employment type, locality and period is covered with up to 20 co-occurrences shown in each of the following categories:

Application Platforms
1 28 (38.36%) Microsoft Exchange
2 24 (32.88%) SharePoint
3 2 (2.74%) Apache
3 2 (2.74%) Confluence
4 1 (1.37%) JBoss
Applications
1 2 (2.74%) Microsoft Office
Business Applications
1 6 (8.22%) SimCorp Dimension
2 4 (5.48%) Fidessa
3 1 (1.37%) Salesforce CRM
Cloud Services
1 56 (76.71%) Azure
2 48 (65.75%) Entra ID
3 43 (58.90%) Microsoft 365
4 22 (30.14%) AWS
5 16 (21.92%) OneDrive
6 14 (19.18%) Power Automate
7 11 (15.07%) Cloud Computing
8 10 (13.70%) Serverless
9 9 (12.33%) AWS Lambda
10 8 (10.96%) Amazon Kinesis
10 8 (10.96%) Google Workspace
11 6 (8.22%) Amazon S3
11 6 (8.22%) AWS Step Functions
11 6 (8.22%) Azure Monitor
11 6 (8.22%) SaaS
12 5 (6.85%) Azure Sentinel
12 5 (6.85%) Microsoft Purview
13 4 (5.48%) Amazon SQS
14 3 (4.11%) Amazon EKS
14 3 (4.11%) Power Platform
Communications & Networking
1 26 (35.62%) Firewall
2 20 (27.40%) DNS
3 16 (21.92%) DHCP
4 15 (20.55%) TCP/IP
5 12 (16.44%) VPN
6 9 (12.33%) Network Security
7 6 (8.22%) SSL
7 6 (8.22%) VLAN
7 6 (8.22%) Wireless
8 5 (6.85%) Kerberos
9 4 (5.48%) NetScaler
9 4 (5.48%) WAN
10 3 (4.11%) LAN
11 2 (2.74%) OpenVPN
11 2 (2.74%) SAN
12 1 (1.37%) ADSL
12 1 (1.37%) Ethernet
12 1 (1.37%) Fibre Channel
12 1 (1.37%) HTTPS
12 1 (1.37%) iSCSI
Database & Business Intelligence
1 8 (10.96%) SQL Server
2 5 (6.85%) Amazon RDS
3 4 (5.48%) Amazon Aurora
3 4 (5.48%) MySQL
4 3 (4.11%) DynamoDB
4 3 (4.11%) PostgreSQL
5 2 (2.74%) Amazon Athena
5 2 (2.74%) Amazon Redshift
5 2 (2.74%) Electronic Patient Records
5 2 (2.74%) Flink
6 1 (1.37%) Data Lake
6 1 (1.37%) Elasticsearch
6 1 (1.37%) InfluxDB
6 1 (1.37%) MongoDB
6 1 (1.37%) Power BI
6 1 (1.37%) Redis
6 1 (1.37%) Relational Database
6 1 (1.37%) Tableau
Development Applications
1 10 (13.70%) JIRA
2 3 (4.11%) Git
3 2 (2.74%) Jenkins
4 1 (1.37%) Artifactory
4 1 (1.37%) Atlassian Bamboo
4 1 (1.37%) Bitbucket
4 1 (1.37%) TestRail
General
1 24 (32.88%) Finance
1 24 (32.88%) Social Skills
2 14 (19.18%) Legal
3 9 (12.33%) Banking
4 8 (10.96%) Law
5 7 (9.59%) Analytical Skills
5 7 (9.59%) Marketing
6 5 (6.85%) Inclusion and Diversity
7 4 (5.48%) Investment Banking
8 3 (4.11%) Organisational Skills
Job Titles
1 20 (27.40%) Senior
2 18 (24.66%) Infrastructure Engineer
3 10 (13.70%) Architect
4 9 (12.33%) Developer
4 9 (12.33%) Lead
5 7 (9.59%) Senior Developer
5 7 (9.59%) Solutions Architect
6 6 (8.22%) AWS Developer
6 6 (8.22%) Python Developer
7 5 (6.85%) Identity and Access Management Engineer
7 5 (6.85%) Identity Management Engineer
7 5 (6.85%) IT Engineer
7 5 (6.85%) Security Engineer
7 5 (6.85%) Senior IT Engineer
7 5 (6.85%) Software Engineer
8 4 (5.48%) Infrastructure Security Engineer
8 4 (5.48%) Java Developer
8 4 (5.48%) Senior Java Developer
8 4 (5.48%) Senior Python Developer
8 4 (5.48%) Senior Software Engineer
Libraries, Frameworks & Software Standards
1 13 (17.81%) OAuth
2 10 (13.70%) OpenID
3 9 (12.33%) SAML
4 8 (10.96%) SailPoint
5 6 (8.22%) LDAP
5 6 (8.22%) SOAP
6 4 (5.48%) Django
6 4 (5.48%) Flask
6 4 (5.48%) Kafka
6 4 (5.48%) REST
7 3 (4.11%) GraphQL
7 3 (4.11%) Lightning Web Components
8 2 (2.74%) boto
8 2 (2.74%) FastAPI
8 2 (2.74%) JSON Web Signature
8 2 (2.74%) JWT
8 2 (2.74%) LangChain
8 2 (2.74%) Microsoft Graph
8 2 (2.74%) PyTorch
8 2 (2.74%) TensorFlow
Miscellaneous
1 11 (15.07%) Cyber Threat
1 11 (15.07%) Management Information System
2 7 (9.59%) Cloud Native
3 6 (8.22%) Onboarding
3 6 (8.22%) PKI
3 6 (8.22%) Public Cloud
4 4 (5.48%) Enterprise Software
4 4 (5.48%) Hedge funds
5 3 (4.11%) Analytical Mindset
5 3 (4.11%) Product Ownership
5 3 (4.11%) Security Posture
6 2 (2.74%) AI Agents
6 2 (2.74%) Hybrid Cloud
7 1 (1.37%) Clustering
7 1 (1.37%) CMDB
7 1 (1.37%) Data Centre
7 1 (1.37%) NHS
7 1 (1.37%) Taxonomies
Operating Systems
1 29 (39.73%) Windows
2 20 (27.40%) Windows Server
3 9 (12.33%) Linux
4 5 (6.85%) Windows Server 2016
5 3 (4.11%) Windows Server 2012
6 2 (2.74%) Mac OS
6 2 (2.74%) VMS
7 1 (1.37%) Unix
Processes & Methodologies
1 25 (34.25%) Cybersecurity
2 22 (30.14%) Identity Management
3 21 (28.77%) Infrastructure Engineering
4 20 (27.40%) Disaster Recovery
4 20 (27.40%) Task Automation
5 18 (24.66%) Network Design
6 17 (23.29%) Identity Access Management
7 15 (20.55%) Mobile Device Management
8 14 (19.18%) Agile
8 14 (19.18%) Project Management
8 14 (19.18%) Software Distribution
9 12 (16.44%) Business Continuity
10 11 (15.07%) DevOps
11 10 (13.70%) Cloud Security
11 10 (13.70%) Continuous Improvement
11 10 (13.70%) Data Protection
11 10 (13.70%) Problem-Solving
11 10 (13.70%) SIEM
12 9 (12.33%) Infrastructure as Code
12 9 (12.33%) Infrastructure Management
Programming Languages
1 43 (58.90%) PowerShell
2 11 (15.07%) Java
2 11 (15.07%) SQL
3 10 (13.70%) Python
4 3 (4.11%) Apex Code
4 3 (4.11%) Bash
4 3 (4.11%) JavaScript
5 2 (2.74%) Rust
5 2 (2.74%) SOQL
6 1 (1.37%) Bicep
Qualifications
1 10 (13.70%) Degree
2 6 (8.22%) CISM
2 6 (8.22%) CISSP
2 6 (8.22%) Microsoft Certification
3 4 (5.48%) Azure Certification
4 3 (4.11%) AWS Certification
4 3 (4.11%) Computer Science Degree
5 1 (1.37%) CASP
5 1 (1.37%) CompTIA Security+
5 1 (1.37%) DBS Check
5 1 (1.37%) Master's Degree
5 1 (1.37%) MCSA
Quality Assurance & Compliance
1 5 (6.85%) GDPR
1 5 (6.85%) ISO/IEC 27001
2 4 (5.48%) NIST
2 4 (5.48%) SLA
3 2 (2.74%) Data Quality
4 1 (1.37%) QA
4 1 (1.37%) SOC 2
System Software
1 38 (52.05%) Active Directory
2 15 (20.55%) Virtual Machines
3 8 (10.96%) VMware Infrastructure
4 6 (8.22%) Hyper-V
4 6 (8.22%) VMware ESXi
5 3 (4.11%) BitLocker
5 3 (4.11%) vSphere
6 1 (1.37%) Docker
6 1 (1.37%) VMware Server
Systems Management
1 40 (54.79%) Microsoft Intune
2 19 (26.03%) SCCM
3 8 (10.96%) Jamf Pro
4 6 (8.22%) Active Directory Federation Services
5 5 (6.85%) QRadar
5 5 (6.85%) Terraform
5 5 (6.85%) vCenter Server
6 3 (4.11%) Kubernetes
7 2 (2.74%) Ansible
7 2 (2.74%) SCOM
8 1 (1.37%) Argo
8 1 (1.37%) Check_MK
8 1 (1.37%) DatAdvantage
8 1 (1.37%) FortiGate
8 1 (1.37%) Kibana
8 1 (1.37%) Kustomize
8 1 (1.37%) logstash
8 1 (1.37%) Opsgenie
8 1 (1.37%) Progress Chef
8 1 (1.37%) Prometheus
Vendors
1 50 (68.49%) Microsoft
2 15 (20.55%) Cisco
3 11 (15.07%) VMware
4 9 (12.33%) Google
4 9 (12.33%) Meraki
5 6 (8.22%) SimCorp
5 6 (8.22%) Splunk
6 5 (6.85%) Bloomberg
6 5 (6.85%) Fortinet
6 5 (6.85%) Okta
6 5 (6.85%) SolarWinds
6 5 (6.85%) Veeam
7 4 (5.48%) Citrix
7 4 (5.48%) FactSet
7 4 (5.48%) ForgeRock
7 4 (5.48%) iManage
7 4 (5.48%) NetApp
7 4 (5.48%) Proofpoint
7 4 (5.48%) Refinitiv
7 4 (5.48%) Salesforce