Platform Engineer
England > London
The median Platform Engineer salary in London is £80,000 per year, according to job vacancies posted during the 6 months leading to 21 February 2026.
The table below compares current salary benchmarking and summary statistics with the previous two years.
| 6 months to 21 Feb 2026 |
Same period 2025 | Same period 2024 | |
|---|---|---|---|
| Rank | 254 | 301 | 322 |
| Rank change year-on-year | +47 | +21 | +90 |
| Permanent jobs requiring a Platform Engineer | 132 | 120 | 150 |
| As % of all permanent jobs in London | 0.84% | 0.81% | 0.70% |
| As % of the Job Titles category | 0.91% | 0.89% | 0.75% |
| Number of salaries quoted | 108 | 88 | 132 |
| 10th Percentile | £62,500 | £64,841 | £65,000 |
| 25th Percentile | £72,188 | £73,750 | £72,500 |
| Median annual salary (50th Percentile) | £80,000 | £90,000 | £80,000 |
| Median % change year-on-year | -11.11% | +12.50% | -5.88% |
| 75th Percentile | £100,000 | £110,625 | £106,250 |
| 90th Percentile | £120,000 | £140,000 | £122,500 |
| England median annual salary | £75,000 | £77,500 | £75,000 |
| % change year-on-year | -3.23% | +3.33% | +3.45% |
All Permanent IT Job Roles
London
For comparison with the information above, the following table provides summary statistics for all permanent IT job vacancies in London. Most job vacancies include a discernible job title that can be normalized. As such, the figures in the second row provide an indication of the number of permanent jobs in our overall sample.
| Permanent vacancies in London with a recognized job title | 14,434 | 13,516 | 20,098 |
| % of permanent jobs with a recognized job title | 91.33% | 91.37% | 94.45% |
| Number of salaries quoted | 9,618 | 7,878 | 16,237 |
| 10th Percentile | £36,250 | £42,500 | £39,500 |
| 25th Percentile | £50,000 | £56,250 | £52,500 |
| Median annual salary (50th Percentile) | £72,500 | £75,000 | £72,500 |
| Median % change year-on-year | -3.33% | +3.45% | -0.97% |
| 75th Percentile | £95,000 | £97,500 | £95,000 |
| 90th Percentile | £110,000 | £120,000 | £115,000 |
| England median annual salary | £55,000 | £60,000 | £55,000 |
| % change year-on-year | -8.33% | +9.09% | -11.29% |
Platform Engineer
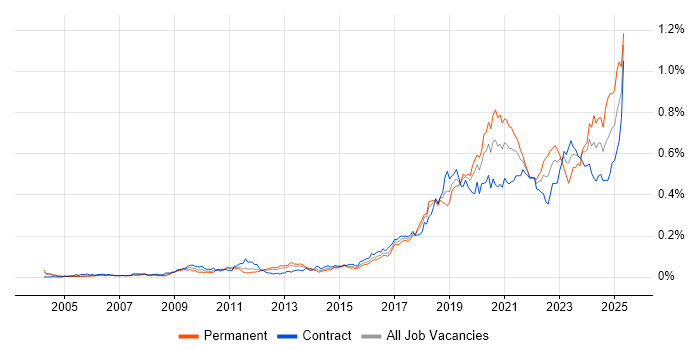
Job Vacancy Trend in London
Historical trend showing the proportion of permanent IT job postings featuring 'Platform Engineer' in the job title relative to all permanent IT jobs advertised in London.

Platform Engineer
Salary Trend in London
Salary distribution trend for Platform Engineer job vacancies in London.

Platform Engineer
Salary Histogram in London
Salary distribution for jobs citing Platform Engineer in London over the 6 months to 21 February 2026.
Platform Engineer
Job Locations in London
The table below looks at the demand and provides a guide to the median salaries quoted in IT jobs citing Platform Engineer within the London region over the 6 months to 21 February 2026. The 'Rank Change' column provides an indication of the change in demand within each location based on the same 6 month period last year.
| Location | Rank Change on Same Period Last Year |
Matching Permanent IT Job Ads |
Median Salary Past 6 Months |
Median Salary % Change on Same Period Last Year |
Live Jobs |
|---|---|---|---|---|---|
| Central London | +41 | 27 | £80,000 | -8.57% | 20 |
| Platform Engineer England |
|||||
Platform Engineer Skill Set
Top 30 Co-Occurring Skills & Capabilities in London
For the 6 months to 21 February 2026, Platform Engineer job roles required the following skills and capabilities in order of popularity. The figures indicate the absolute number of co-occurrences and as a proportion of all permanent job ads across the London region featuring Platform Engineer in the job title.
|
|
Platform Engineer Skill Set
Co-Occurring Skills & Capabilities in London by Category
The following tables expand on the one above by listing co-occurrences grouped by category. They cover the same employment type, locality and period, with up to 20 co-occurrences shown in each category:
|
|
||||||||||||||||||||||||||||||||||||||||||||||||||||||||||||||||||||||||||||||||||||||||||||||||||||||||||||||||||
|
|
||||||||||||||||||||||||||||||||||||||||||||||||||||||||||||||||||||||||||||||||||||||||||||||||||||||||||||||||||
|
|
||||||||||||||||||||||||||||||||||||||||||||||||||||||||||||||||||||||||||||||||||||||||||||||||||||||||||||||||||
|
|
||||||||||||||||||||||||||||||||||||||||||||||||||||||||||||||||||||||||||||||||||||||||||||||||||||||||||||||||||
|
|
||||||||||||||||||||||||||||||||||||||||||||||||||||||||||||||||||||||||||||||||||||||||||||||||||||||||||||||||||
|
|
||||||||||||||||||||||||||||||||||||||||||||||||||||||||||||||||||||||||||||||||||||||||||||||||||||||||||||||||||
|
|
||||||||||||||||||||||||||||||||||||||||||||||||||||||||||||||||||||||||||||||||||||||||||||||||||||||||||||||||||
|
|
||||||||||||||||||||||||||||||||||||||||||||||||||||||||||||||||||||||||||||||||||||||||||||||||||||||||||||||||||
|
|||||||||||||||||||||||||||||||||||||||||||||||||||||||||||||||||||||||||||||||||||||||||||||||||||||||||||||||||||
