JIRA Jobs in London

Atlassian JIRA
England > London

The table below provides summary statistics for permanent job vacancies advertised in London requiring JIRA skills. It includes a benchmarking guide to the annual salaries offered in vacancies that cited JIRA over the 6 months leading up to 26 July 2024, comparing them to the same period in the previous two years.

6 months to
26 Jul 2024
Same period 2023 Same period 2022
Rank 139 80 64
Rank change year-on-year -59 -16 +7
Permanent jobs citing JIRA 507 1,010 4,533
As % of all permanent jobs advertised in London 2.44% 3.72% 6.04%
As % of the Development Applications category 23.54% 25.62% 23.22%
Number of salaries quoted 352 758 1,851
10th Percentile £40,000 £42,000 £42,500
25th Percentile £47,500 £51,401 £52,500
Median annual salary (50th Percentile) £62,500 £67,500 £67,500
Median % change year-on-year -7.41% - +3.85%
75th Percentile £78,000 £82,536 £85,000
90th Percentile £94,900 £100,000 £100,000
England median annual salary £55,000 £60,000 £58,750
% change year-on-year -8.33% +2.13% +2.17%

All Development Application Skills
London

JIRA falls under the Development Applications category. For comparison with the information above, the following table provides summary statistics for all permanent job vacancies requiring development application skills in London.

Permanent vacancies with a requirement for development application skills 2,154 3,942 19,524
As % of all permanent jobs advertised in London 10.39% 14.53% 26.03%
Number of salaries quoted 1,377 3,119 6,945
10th Percentile £44,543 £46,250 £47,500
25th Percentile £56,250 £56,250 £57,500
Median annual salary (50th Percentile) £75,000 £72,500 £72,500
Median % change year-on-year +3.45% - +3.57%
75th Percentile £95,000 £92,000 £90,000
90th Percentile £115,000 £107,500 £105,000
England median annual salary £60,000 £65,000 £62,500
% change year-on-year -7.69% +4.00% +8.70%

JIRA
Job Vacancy Trend in London

Job postings citing JIRA as a proportion of all IT jobs advertised in London.
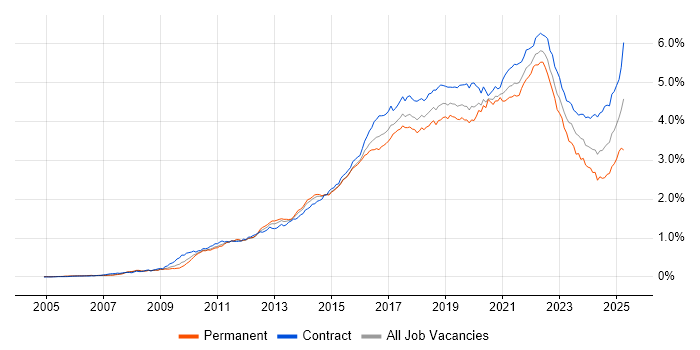
Job vacancy trend for JIRA in London

JIRA
Salary Trend in London

3-month moving average salary quoted in jobs citing JIRA in London.

Salary trend for JIRA in London

JIRA
Salary Histogram in London

Salary distribution for jobs citing JIRA in London over the 6 months to 26 July 2024.

Salary histogram for JIRA in London

JIRA
Job Locations in London

The table below looks at the demand and provides a guide to the median salaries quoted in IT jobs citing JIRA within the London region over the 6 months to 26 July 2024. The 'Rank Change' column provides an indication of the change in demand within each location based on the same 6 month period last year.

Location Rank Change
on Same Period
Last Year
Matching
Permanent
IT Job Ads
Median Salary
Past 6 Months
Median Salary
% Change
on Same Period
Last Year
Live
Jobs
Central London +6 118 £60,000 -11.11% 13
South London -28 20 £65,000 -7.14% 3
East London +19 6 £70,000 +33.33% 4
West London -27 4 £50,000 -23.08%
JIRA
England

JIRA
Co-occurring Skills and Capabilities in London by Category

The follow tables expand on the table above by listing co-occurrences grouped by category. The same employment type, locality and period is covered with up to 20 co-occurrences shown in each of the following categories:

Application Platforms
1 146 (28.80%) Confluence
2 37 (7.30%) CMS
3 19 (3.75%) SharePoint
4 15 (2.96%) Microsoft Exchange
5 9 (1.78%) Apache
6 5 (0.99%) nginx
6 5 (0.99%) Oracle Workflow
7 4 (0.79%) IIS
8 3 (0.59%) Apache Spark
9 2 (0.39%) WordPress
10 1 (0.20%) Adobe Experience Manager
10 1 (0.20%) Apache Airflow
10 1 (0.20%) Umbraco
Applications
1 39 (7.69%) Microsoft Excel
2 38 (7.50%) Microsoft Office
3 18 (3.55%) Photoshop
4 17 (3.35%) Microsoft Project
4 17 (3.35%) MS Visio
5 10 (1.97%) Trello
6 5 (0.99%) Microsoft PowerPoint
7 2 (0.39%) Adobe After Effects
7 2 (0.39%) Adobe Creative Suite
7 2 (0.39%) Adobe Premiere
8 1 (0.20%) Notion
8 1 (0.20%) Sketch
8 1 (0.20%) UXPin
8 1 (0.20%) Zeplin
Business Applications
1 33 (6.51%) SDL Web 8
2 5 (0.99%) NEC Housing
3 4 (0.79%) Dynamics CRM
4 3 (0.59%) Fidessa
4 3 (0.59%) Payment Gateway
4 3 (0.59%) Remedy ITSM
5 2 (0.39%) Magento
5 2 (0.39%) SAP SD
5 2 (0.39%) Temenos T24
6 1 (0.20%) CA PPM
6 1 (0.20%) Markit EDM
6 1 (0.20%) R3 Corda
6 1 (0.20%) SAP ERP
6 1 (0.20%) SAP Hybris
6 1 (0.20%) SAP S/4HANA
6 1 (0.20%) Shopify
6 1 (0.20%) thinkFolio
6 1 (0.20%) Workday HCM
6 1 (0.20%) Workfront
Cloud Services
1 120 (23.67%) Azure
2 74 (14.60%) AWS
3 53 (10.45%) Azure DevOps
4 34 (6.71%) GitHub
5 24 (4.73%) Power Platform
6 20 (3.94%) Microsoft 365
6 20 (3.94%) SaaS
7 19 (3.75%) Serverless
8 18 (3.55%) Adobe Creative Cloud
9 17 (3.35%) NuGet
10 16 (3.16%) Figma
11 15 (2.96%) Entra ID
11 15 (2.96%) GCP
12 13 (2.56%) AWS Lambda
13 12 (2.37%) PaaS
14 11 (2.17%) Asana
14 11 (2.17%) Miro
15 10 (1.97%) GitHub Actions
16 8 (1.58%) BrowserStack
16 8 (1.58%) OpenShift
Communications & Networking
1 17 (3.35%) VPN
2 15 (2.96%) Firewall
3 14 (2.76%) DNS
4 13 (2.56%) TCP/IP
5 11 (2.17%) BGP
5 11 (2.17%) DHCP
5 11 (2.17%) Ethernet VPN
5 11 (2.17%) MPLS
6 10 (1.97%) 5G
7 8 (1.58%) HTTP
8 7 (1.38%) HTTPS
8 7 (1.38%) LAN
8 7 (1.38%) WAN
9 5 (0.99%) FTP
9 5 (0.99%) IP Telephony
9 5 (0.99%) PABX
9 5 (0.99%) VLAN
10 3 (0.59%) FIX Connectivity
10 3 (0.59%) SSH
11 2 (0.39%) Network Security
Database & Business Intelligence
1 76 (14.99%) SQL Server
2 30 (5.92%) PostgreSQL
3 28 (5.52%) MongoDB
4 26 (5.13%) NoSQL
5 24 (4.73%) Power BI
6 15 (2.96%) Relational Database
7 11 (2.17%) Data Warehouse
7 11 (2.17%) SQL Server Integration Services
8 9 (1.78%) MySQL
9 7 (1.38%) Azure SQL Database
9 7 (1.38%) Elasticsearch
10 4 (0.79%) Big Data
10 4 (0.79%) Data Lake
10 4 (0.79%) Enterprise Data Warehouse
10 4 (0.79%) MariaDB
10 4 (0.79%) Power Query
10 4 (0.79%) Redis
10 4 (0.79%) SQL Server Analysis Services
10 4 (0.79%) Squirro
10 4 (0.79%) Tableau
Development Applications
1 109 (21.50%) Git
2 42 (8.28%) TeamCity
3 40 (7.89%) NUnit
4 37 (7.30%) Jenkins
5 34 (6.71%) GitLab
6 33 (6.51%) Moq
7 28 (5.52%) Visual Studio
8 27 (5.33%) SpecFlow
9 26 (5.13%) Selenium
10 18 (3.55%) Cucumber
10 18 (3.55%) Octopus Deploy
10 18 (3.55%) Sourcetree
11 17 (3.35%) git-flow
12 13 (2.56%) Postman
13 10 (1.97%) Ant
14 9 (1.78%) Bitbucket
15 8 (1.58%) Artifactory
15 8 (1.58%) Snyk
15 8 (1.58%) Team Foundation Server
16 7 (1.38%) SonarQube
General
1 227 (44.77%) Social Skills
2 138 (27.22%) Finance
3 70 (13.81%) Marketing
4 66 (13.02%) Analytical Skills
5 60 (11.83%) Banking
6 27 (5.33%) Presentation Skills
7 23 (4.54%) Legal
8 21 (4.14%) Law
8 21 (4.14%) Public Sector
9 18 (3.55%) Inclusion and Diversity
10 17 (3.35%) Retail Banking
11 14 (2.76%) Retail
12 13 (2.56%) Front Office
13 12 (2.37%) Telecoms
14 9 (1.78%) Organisational Skills
15 8 (1.58%) Local Government
15 8 (1.58%) Police
16 6 (1.18%) Back Office
16 6 (1.18%) German Language
17 5 (0.99%) Advertising
Job Titles
1 122 (24.06%) Developer
2 81 (15.98%) Senior
3 73 (14.40%) Analyst
4 69 (13.61%) Full Stack Developer
5 60 (11.83%) Lead
6 41 (8.09%) Senior Developer
7 38 (7.50%) C# Developer
7 38 (7.50%) Full-Stack C# Developer
8 34 (6.71%) Project Manager
9 26 (5.13%) Business Analyst
10 24 (4.73%) Senior Full Stack Developer
11 23 (4.54%) .NET Developer
12 22 (4.34%) Full Stack .NET Developer
13 21 (4.14%) C# .NET Developer
14 20 (3.94%) Applications Support
15 18 (3.55%) Senior C# Developer
16 16 (3.16%) Architect
17 15 (2.96%) Senior Analyst
17 15 (2.96%) Support Analyst
17 15 (2.96%) Support Engineer
Libraries, Frameworks & Software Standards
1 86 (16.96%) RESTful
2 82 (16.17%) HTML
3 72 (14.20%) .NET
4 69 (13.61%) CSS
5 62 (12.23%) .NET Framework
5 62 (12.23%) React
6 60 (11.83%) SOAP
7 59 (11.64%) ASP.NET
7 59 (11.64%) jQuery
8 54 (10.65%) Entity Framework
9 47 (9.27%) Web Services
10 46 (9.07%) XML
11 43 (8.48%) REST
12 37 (7.30%) ASP.NET MVC
12 37 (7.30%) JSON
13 34 (6.71%) GraphQL
14 33 (6.51%) ASP.NET MVC 5
14 33 (6.51%) Semantic HTML
15 32 (6.31%) Node.js
16 27 (5.33%) AngularJS
Miscellaneous
1 33 (6.51%) Legacy Code
2 28 (5.52%) Product Ownership
3 20 (3.94%) Greenfield Project
4 18 (3.55%) Derivative
5 17 (3.35%) Social Media
6 14 (2.76%) Onboarding
7 12 (2.37%) Mobile App
8 11 (2.17%) Clustering
8 11 (2.17%) Fixed Income
8 11 (2.17%) Management Information System
9 9 (1.78%) Data Structures
9 9 (1.78%) Distributed Systems
9 9 (1.78%) IoT
9 9 (1.78%) OTC Derivatives
9 9 (1.78%) PMI
9 9 (1.78%) Wiki
10 8 (1.58%) Enterprise Software
11 7 (1.38%) Cloud Native
11 7 (1.38%) Equities
11 7 (1.38%) Public Cloud
Operating Systems
1 61 (12.03%) Linux
2 56 (11.05%) Windows
3 33 (6.51%) Unix
4 21 (4.14%) CentOS
5 18 (3.55%) Windows Server
6 9 (1.78%) Windows 10
7 6 (1.18%) Android
7 6 (1.18%) Debian
8 5 (0.99%) Mac OS
9 4 (0.79%) Apple iOS
10 3 (0.59%) Ubuntu
11 2 (0.39%) Solaris
12 1 (0.20%) VMS
12 1 (0.20%) VxWorks
Processes & Methodologies
1 261 (51.48%) Agile
2 134 (26.43%) Scrum
3 118 (23.27%) DevOps
4 101 (19.92%) Problem-Solving
5 85 (16.77%) Project Management
6 78 (15.38%) Full Stack Development
7 62 (12.23%) Computer Science
8 59 (11.64%) CI/CD
8 59 (11.64%) Continuous Improvement
9 56 (11.05%) Stakeholder Management
10 55 (10.85%) Test Automation
11 49 (9.66%) Kanban
12 47 (9.27%) TDD
13 46 (9.07%) E-Commerce
14 43 (8.48%) Mentoring
15 41 (8.09%) SDLC
16 40 (7.89%) MVC
16 40 (7.89%) Performance Tuning
16 40 (7.89%) Risk Management
16 40 (7.89%) Unit Testing
Programming Languages
1 142 (28.01%) SQL
2 95 (18.74%) JavaScript
3 90 (17.75%) C#
4 65 (12.82%) Python
5 63 (12.43%) Java
6 43 (8.48%) T-SQL
7 27 (5.33%) PowerShell
8 18 (3.55%) Bash
9 17 (3.35%) XPath
10 15 (2.96%) Scala
11 13 (2.56%) TypeScript
12 10 (1.97%) Apex Code
12 10 (1.97%) Go
12 10 (1.97%) Perl
13 9 (1.78%) Kotlin
14 7 (1.38%) Ruby
15 5 (0.99%) SOQL
15 5 (0.99%) VBA
16 4 (0.79%) Data Analysis Expressions
17 3 (0.59%) Shell Script
Qualifications
1 97 (19.13%) Degree
2 25 (4.93%) Security Cleared
3 23 (4.54%) SC Cleared
4 18 (3.55%) PMI Certification
5 16 (3.16%) ISEB
6 15 (2.96%) ISTQB
7 10 (1.97%) Computer Science Degree
8 9 (1.78%) PMP
9 8 (1.58%) BPSS Clearance
10 6 (1.18%) AWS Certification
11 5 (0.99%) DBS Check
12 4 (0.79%) ISEB Practitioner
12 4 (0.79%) PRINCE2 Certification
13 3 (0.59%) Azure Certification
13 3 (0.59%) CISSP
13 3 (0.59%) CSPO
13 3 (0.59%) ITIL Certification
14 2 (0.39%) CIMA
14 2 (0.39%) CISM
14 2 (0.39%) DV Cleared
Quality Assurance & Compliance
1 78 (15.38%) QA
2 25 (4.93%) PMO
3 17 (3.35%) Data Quality
4 14 (2.76%) Accessibility
4 14 (2.76%) GDPR
5 9 (1.78%) MiFID
6 4 (0.79%) SLA
7 3 (0.59%) ISO 20022
7 3 (0.59%) P3O
8 2 (0.39%) IFRS
8 2 (0.39%) ISO/IEC 27001
8 2 (0.39%) NCSC
9 1 (0.20%) Actionable Recommendations
9 1 (0.20%) California Consumer Privacy Act
9 1 (0.20%) Government Security Classifications
9 1 (0.20%) ISO/IEC 27002 (supersedes ISO/IEC 17799)
9 1 (0.20%) ISO/IEC 27005
9 1 (0.20%) PSD2
9 1 (0.20%) Software Quality Assurance
9 1 (0.20%) WCAG
System Software
1 25 (4.93%) Docker
2 22 (4.34%) Active Directory
3 15 (2.96%) VMware ESXi
4 14 (2.76%) Firmware
5 5 (0.99%) VMware Infrastructure
6 2 (0.39%) Embedded Firmware
6 2 (0.39%) Virtual Machines
7 1 (0.20%) Hyper-V
7 1 (0.20%) vSphere
Systems Management
1 35 (6.90%) Kubernetes
2 17 (3.35%) Terraform
3 16 (3.16%) Single Sign-On
4 15 (2.96%) Ansible
5 12 (2.37%) vCenter Server
6 11 (2.17%) Microsoft Clustering
6 11 (2.17%) Microsoft Intune
7 10 (1.97%) Istio
8 5 (0.99%) CloudHub
8 5 (0.99%) HP ALM
8 5 (0.99%) Progress Chef
9 4 (0.79%) Grafana
9 4 (0.79%) Puppet
10 3 (0.59%) Control-M
10 3 (0.59%) SCCM
10 3 (0.59%) SCOM
11 2 (0.39%) Kibana
11 2 (0.39%) Prometheus
11 2 (0.39%) Red Hat Spacewalk
12 1 (0.20%) VxRail
Vendors
1 59 (11.64%) Microsoft
2 41 (8.09%) ServiceNow
3 40 (7.89%) Atlassian
4 33 (6.51%) Salesforce
5 23 (4.54%) Adobe
6 17 (3.35%) Cognizant
6 17 (3.35%) VMware
7 15 (2.96%) Google
7 15 (2.96%) Oracle
8 13 (2.56%) Cisco
9 12 (2.37%) Sun
10 11 (2.17%) Commvault
10 11 (2.17%) Sybase
11 8 (1.58%) SAP
11 8 (1.58%) Splunk
12 6 (1.18%) HP
13 5 (0.99%) IBM
13 5 (0.99%) Murex
13 5 (0.99%) Red Hat
13 5 (0.99%) Zuora